 Amit Kumar
 Nikola Škoro
 Wolfgang Gernjak3,4
 Nevena Puač
95% of researchers rate our articles as excellent or good
Learn more about the work of our research integrity team to safeguard the quality of each article we publish.
Find out more
ORIGINAL RESEARCH article
Front. Phys. , 15 February 2022
Sec. Low-Temperature Plasma Physics
Volume 10 - 2022 | https://doi.org/10.3389/fphy.2022.835635
This article is part of the Research Topic Prospects of Plasma Generated Species Interaction With Organic and Inorganic Materials View all 6 articles
In this work, the direct and indirect removal of Acid Blue 25 (AB25) from water by using cold atmospheric pressure plasma jet (APPJ) has been demonstrated. APPJ with a pin electrode type configuration operating with argon as a working gas was used as a plasma source for treatments. In this configuration, argon plasma was formed in the contact with surrounding air over the liquid surface. The plasma was driven by using a high voltage radio frequency (RF) power supply. The system was characterized by the measurement of electrical characteristics and by employing optical emission spectroscopy (OES). The electrical characterization gave information about the voltages and currents, i.e., working points of the discharge, as well as power deposition to the sample. OES recorded the emission spectra and confirmed several existing reactive species in the gas phase of the plasma system. During the direct treatment, AB25-containing solution was directly exposed to APPJ. The direct treatment was performed by modifying various experimental parameters, such as initial AB25 concentrations, treatment times, and input powers. In the indirect treatment, AB25 was treated by using plasma activated water (PAW). The characterization of PAW was performed and various plasma-induced long-lived species, such as nitrate (NO3−), nitrite (NO2−) and hydrogen peroxide (H2O2) have been quantified using colorimetric techniques. Besides, blank experiments have been conducted with main constituents in PAW, where AB25 was treated individually by NO3−, NO2−, and H2O2 and with a mixture of these three species. As expected, with the direct treatment almost complete removal of AB25 was achieved. The measurements also provided an insight into the kinetics of the degradation of AB25. In the indirect treatment, PAW removed a significant amount of AB25 within 17 days. In the blank experiments, H2O2 containing solutions created a favourable influence on removal of AB25 from liquid.
Organic dyes are the major group of toxic pollutants that have been constantly detected in the environment [1–3] with the textile industries as the main source of dyes in the water bodies [4, 5]. It has been estimated that 200 thousand tons of different dyes are discharged every year into the environment during their application process [6]. Therefore, around 17–20% of industrial wastewater originates only from the textile industries [7, 8]. From an environmental point of view, dye effluents can lead to adverse effects on aquatic life, plant life as well as on public health [6, 9–11]. However, it has been reported that many organic dyes are extremely difficult to degrade by conventional wastewater treatment plants due to their stable chemical structures (e.g., aromatic rings) [12–14].
Many advanced oxidation processes (AOPs), with various approaches including H2O2/Fenton, UV/TiO2, O3/H2O2, UV/H2O2, UV/O3, ozonation have been studied for the treatment of organic dyes from wastewater [15–17]. AOPs are known to generate hydroxyl radical (HO), which is well known as a powerful oxidant with an oxidation potential of around 2.86 V [12, 17, 18]. HO can react and degrade almost all the non-biodegradable stable organic compounds via abstraction of hydrogen bond, electrophilic addition and electron transfer reactions [10, 18, 19]. Many authors have reported that the reactivity of non-selective HO towards most of the organic substrates in the range of 106–1010 M−1s−1, which of course depends on the nature of the target pollutants [10, 17, 18, 20, 21].
In recent years, cold atmospheric plasma (also known as non-thermal or non-equilibrium plasma) has gained attention and proven to be an alternative tool for the oxidation of organic contaminants from water due to the abundant production of reactive species without addition of chemicals and increment of ambient temperature [22–26]. Cold atmospheric plasma is an electrically conductive gas and multi-component system of high-energy electrons, and reactive species, negative and positive ions, neutrals, metastables with thermal energies, and photons of different wavelengths [27–31]. It has been frequently tested for variety of applications, including agriculture [32], destruction of toxic gases [33], food preservations [34], medicines [27], surface modification [35], etc.
Although plasma can be formed inside a liquid, plasma formed in the gas phase above the liquid target require lower operating voltages. Plasma in contact with liquid has been demonstrated by many researchers to be suitable for the successful treatment of various organic pollutants, such as organic dyes [25, 36, 37], pharmaceuticals [21, 38], pesticides [39, 40], and so on. Plasma interacts with liquid leading to the formation of several reactive oxygen (ROS) and nitrogen species (RNS): HO, O, H2O2, NO, ONOOH, O3, etc., that proved to be highly effective in the elimination of a high range of organic pollutants from water [13, 19, 26, 41–43].
Various APPJ with different reactor configurations were used and reported as promising plasma sources for the treatment of dye-containing polluted waters [11, 14, 22, 44, 45].
Generally, in the direct treatment process, where the solution is directly exposed to the plasma formed in the gaseous phase, several factors such as high energetic electrons, short and long-lived ROS and RNS, UV emission, electric field, all originating from the active plasma volume, can play a significant role in the degradation of organic dyes [24–26, 41]. However, in case of PAW application i.e. indirect treatment only long-lived ROS and RNS that remained in the water after plasma treatment can be responsible for the degradation [42, 46–50].
AB25 dye is widely used for dyeing wool, silk, polyamide, leather and mixed fabric [51, 52]. AB25 has an anthraquinone structure with three fused aromatic rings, which makes the molecule resistant to oxidation by conventional wastewater treatment [13, 53, 54]. Anthraquinone dyes together with azo dyes are the most commonly used in the textile industries [55].
In the present study, AB25 dye was selected as a model anthraquinone compound. The removal of AB25 was carried out with direct exposure to APPJ and by using the PAW—indirect treatment. To the best of our knowledge, we could not find a similar report in the literature. The electrical characterization of the plasma system was performed and power deposition to the sample was determined. OES was carried out to study existing short-lived reactive species in the plasma. In indirect AB25 treatments, quantification of long-lived reactive species in PAW was performed. Then, AB25 treatment results with PAW and with chemicals were compared.
AB25 (product number: 210684; purity: 45%; chemical formula: C20H13N2NaO5S; chemical class: anthraquinone; classification: anionic; maximum absorbance: 602 nm) was purchased from Sigma Aldrich. A stock dye-containing solution with a concentration of 50 mg/L was prepared by dissolving an adequate amount of analytical grade of AB25 in distilled water. The lower concentration was achieved by the addition of distilled water into the stock solution.
The schematic diagram of the experimental setup is given in Figure 1. APPJ consists of glass and ceramic tubes and a stainless steel electrode (powered electrode). The powered electrode is a 1 mm diameter stainless steel wire with a sharpened edge placed inside a ceramic tube, both axially positioned. The outer and inner diameters of the glass tube are 6 and 4 mm, respectively. The inner powered electrode is connected to the high voltage (HV) source. The sample vessel was grounded with a copper tape placed at the bottom side via a 1 kΩ resistor. A commercial high voltage RF power supply (T&C Power Conversion AG0201HV) provided a sine signal at the frequency of 330 kHz. Argon (5.0 purity) was used as a feed gas with a flow rate of 1 slm (standard liters per minute) and the flow rate was controlled through a mass flow meter (OMEGA, FMA5800/5500). We have chosen argon as a feed gas because it reduces the breakdown voltage of the discharge. The discharge is ignited in the mixture of argon with air. For discharge in air we would need tens of kV of applied voltage and our power supply was a limiting factor. The distance between the tip of the powered electrode and the surface of the liquid sample placed underneath was 10 mm. In all experiments, the sample volume was 5 ml.
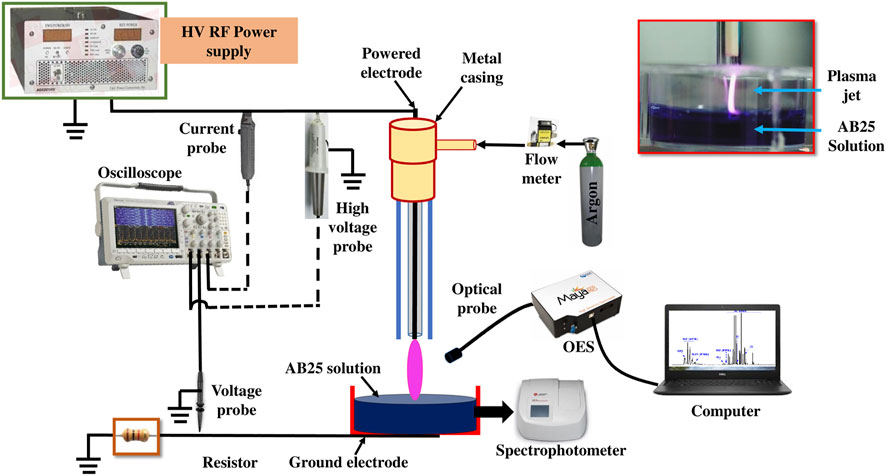
FIGURE 1. Schematic diagram of the experiment and a photo of APPJ over the liquid surface.
The voltage at the powered electrode was determined by a high voltage probe (Tektronix 6015A). The current at the powered electrode was measured with a current probe (Agilent N2783B). The voltage drop across the 1 kΩ resistor used to establish the current in the grounded part was recorded using a voltage probe (Agilent 10073C). The time variable voltage and current signals were monitored by using an oscilloscope (Tektronix MDO3024). Simultaneously, the data from the oscilloscope was transferred to a laptop for further analysis. The power delivered from the power supply to the plasma source and the power in the grounded line, i.e., the power deposited from the plasma passing through the sample, were calculated.
An example of the recorded voltage and current waveform during the direct treatment of AB25 is displayed in Figure 2.
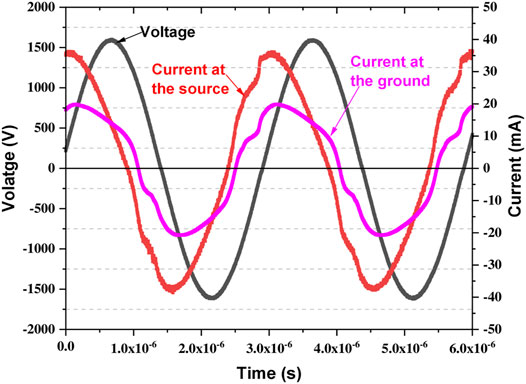
FIGURE 2. Typical voltage (source) and current (source and ground) waveforms measured during the plasma generation.
The mean power at the source was determined by averaging the instantaneous power (product of measured voltage and current) over a time interval of 6 periods.
Where, Pmean: mean power at the source; v(t): voltage signal at the source; is(t): current at the source: nT = T2–T1.
The mean power at the ground (in contact with the sample) was similarly determined.
With ig(t): current at the ground:
Where Pmean: mean power at the sample; vR(t): voltage drop at the resistor; resistance R = 1 kΩ.
OES spectra of excited species in the plasma system were captured by using Maya2000 Pro-UV-NIR (Ocean Insight-High Sensitive Spectrometer) and an optical fiber (M114L02). The fiber diameter (core) and length were 600 µm and 2 m, respectively. The position of the fiber enabled the recording of the emission from the whole volume of the plasma jet. The emission was recorded in the range of 200–1,100 nm with the exposure time of 10 ms. The background spectra (without plasma) was subtracted from the plasma emission spectra. The spectral intensity was corrected for the optical system efficiency.
During the direct treatment, AB25-containing solution was directly exposed to APPJ and the solution was characterized immediately after the treatment. In the indirect treatment, AB25 was treated by mixing with plasma-activated water (PAW). The PAW was generated by exposing distilled water to APPJ for 10 min. After PAW was added into AB25 solution, we monitored and analysed the solution for several days to understand the role of long-lived reactive species in PAW on AB25 degradation. Schematics of both processes are illustrated in Figure 3.
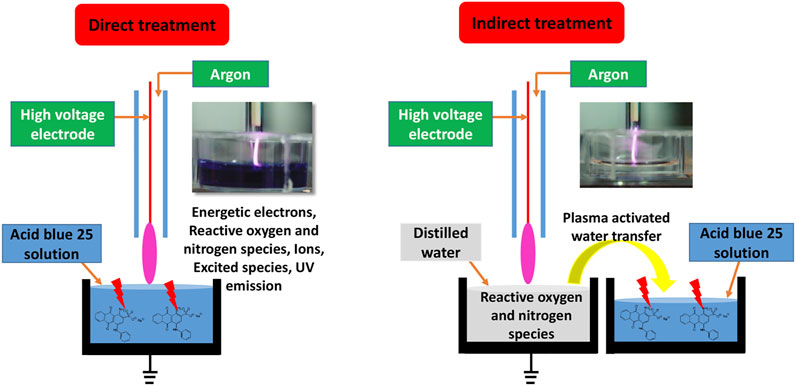
FIGURE 3. Schematics of the direct and the indirect treatment.
A spectrophotometer (Beckman Coulter DU 720 UV/Visible) with a 5 ml cuvette was used for the investigation of AB25 dye degradation. The maximum intensity of the AB25 absorbance occurs in the visible region at 602 nm and this wavelength was used to detect the degradation of the dye by direct plasma or PAW [56]. It is expected that during degradation of the AB25 through the chemical oxidation process the color donating chemical moiety will be influenced thus eliminating the molecule’s capacity to absorb light in the visual region.
AB25 removal efficiency was determined by using Eq. 4:
Whereas Co (mg/L) is the initial dye concentration, C (mg/L) is the final dye concentration after the treatment and d is the evaporation coefficient.
The energy yield (Y), defined by the removal of AB25 per unit power deposition to the sample that was determined by Eq. 5
Where Vo indicates the initial volume of solution (in liters), Pmean is power deposition at the sample (in kW) and t is the treatment time (in h).
The energy yield at 50% removal was calculated by the following Eq. 6
The determination of long-lived ROS and RNS in the PAW was performed. After the plasma activation, the PAW was immediately characterized, and the concentrations of NO3−, NO2− and H2O2 are determined by using a UV/Visible spectrophotometer. In order to determine the concentration of H2O2, titanium oxysulfate (TiOSO4) reagent was added to the PAW. H2O2 in the PAW reacted with TiOSO4 giving a yellow colour and the absorbance was recorded at 407 nm. NO3−/NO2− were measured by using Griess assay kits (Nitrate test—1.09713.0002, Nitrite test—1.14776.0002, Merck). NO3− was measured with the use of sulphuric acid (H2SO4) and nitrate reagent. However, NO2− was determined by using H2SO4 and nitrite reagent. The absorbance of the formed complexes were recorded at 357 and 525 nm for NO3− and NO2−, respectively.
In all treatment processes, the solution conductivity and pH are measured by a conductivity (HANNA-HI76312) and a pH (HANNA-HI1330) meter, respectively. The pH meter measures the concentration of hydrogen ions (H+). Hence, the concentration of H+ ions based on the measured pH of treated and untreated solutions was determined and discussed in Direct Plasma Treatment of AB25.
Volt-ampere (V-A) characteristics of the pin-APPJ system were investigated and power deposition was calculated for different input conditions. The characterization was done in the identical conditions as in treatments, with the AB25 aqueous sample as a grounded target and Ar flow of 1 slm.
The results of electrical characterization are given in Figures 4, 5. Figure 4A represents the V-A at the jet, while Figure 4B shows the V-A of the plasma in contact with the sample. In both plots, RMS (root mean square) values of the voltage and appropriate current are presented. The linear part of the dependence represents the conditions when plasma is not ignited. At around 1.6 kVRMS voltage the plasma was ignited resulting in a considerable reduction in voltage. One needs to keep in mind that here we did not measured the breakdown voltage but the operating voltage. With a further increase of power given by the RF power supply after plasma ignition, operating voltage did not change significantly and remained at about 1.1 kVRMS. However, after ignition, the values of IRMS at ground, i.e., in the plasma, raise more than 50%. In comparison to the IRMS in the source, IRMS in the part of the circuit that includes the sample were observed to be more than two fold lower.
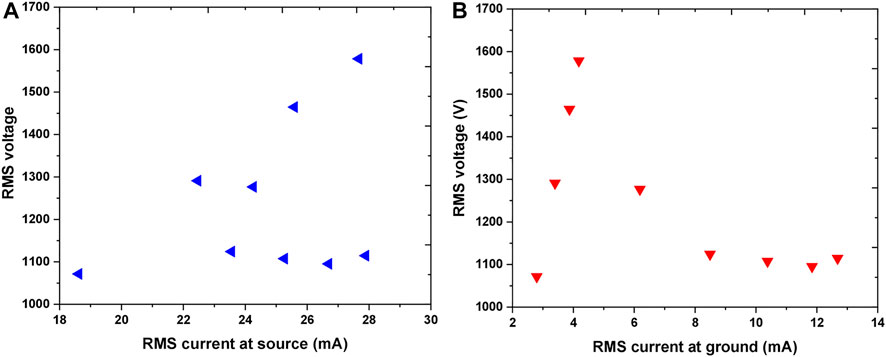
FIGURE 4. V-A characteristics representing RMS voltage as a function of RMS current at source (A) and RMS current at the ground—in contact with the sample (B) Working gas: Ar 1 slm.
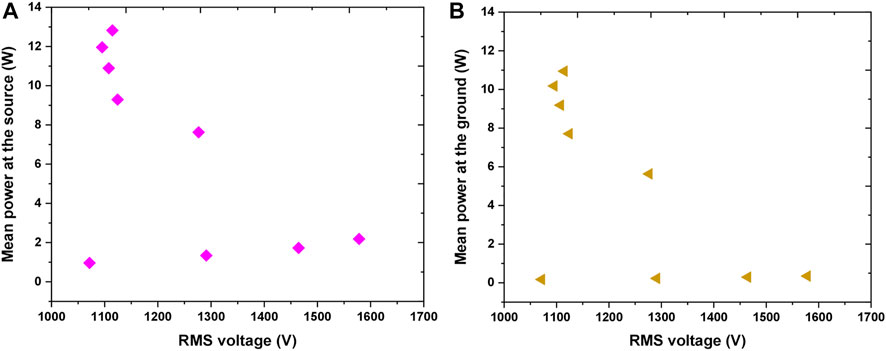
FIGURE 5. Variation of mean power deposited in the plasma as a function of RMS voltage (A) mean power at the source (B) mean power at the ground.
The most important parameter for plasma treatments is power deposited into the plasma system. The variation in the power deposition at the source and sample are illustrated in Figures 5A,B, respectively. For the lowest powers applied, when the plasma was not ignited, it was observed that there was a small power deposition of 1–2 W at the source even though the system is mainly capacitive. This is due to the small resistive impedance of the electrical connections and components. When the applied voltage increased above 1.6 kVRMS the breakdown occurs and with the inception of plasma the power deposition is increased. We can see that the increase of the power deposited in the system occurred while the voltage stayed almost constant or slightly decreasing indicating that the power increment is significantly due to the higher current in the source and through the ground i.e., in contact with the sample. Of particular importance was to calculate the power at the ground, i.e., deposited in the part of the electrical circuit in contact with the sample. It can be observed in Figure 5B that when the plasma was ignited the power delivered to the sample was in the range of about 5–11 W.
OES was used for the detection of excited species in argon plasma in the air interacting with the liquid. A typical OES spectrum during AB25 treatment in the range of 200–1,100 nm can be seen in Figure 6. Excited species such as hydroxyl radical (HO), atomic hydrogen (H), atomic oxygen (O), atomic argon, nitrogen second positive system (SPS), nitrogen first positive system (FPS) and nitrogen first negative system (FNS) were observed.
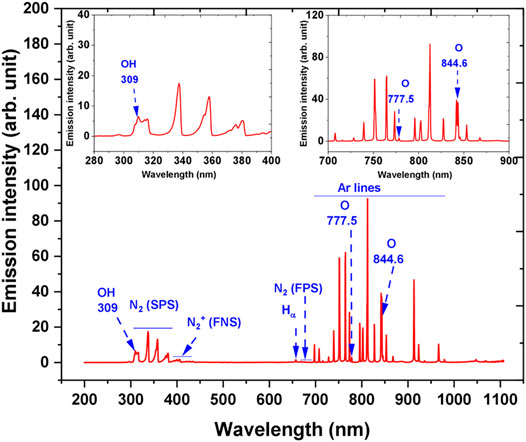
FIGURE 6. The emission spectrum of Ar—APPJ in contact with ambient air and over a liquid surface. During the diagnostics, AB25 was placed under APPJ, Vo = 5 ml, Ar 1 slm, Pmean at the sample 11 W. Inset plots show parts of the spectrum zoomed.
A-X band of HO and Hα line were detected with maximum emission of at 309 and 656.2 nm, respectively. In the discharge HO emission could have originated due to dissociative excitation of water molecules in collisions of electron or argon metastables [57–59]. The main source of water molecules in the gaseous phase or discharge region mostly comes from the evaporation of the target sample due to the effect of purging caused by gas flow or could be via local heating caused by the impact of heavy ions in APPJ [57, 60]. Since the plasma was ignited in the mixture of argon with the surrounding air, excited argon lines, molecular nitrogen bands and atomic oxygen lines were present. The emission of O lines were at 777.5 and 844.6 nm, excited molecular nitrogen SPS between 300 and 405.8 nm with intensive band-head at 337.7 nm. For the molecular ions, the nitrogen molecular FNS between 391.4 and 428 nm and a weak intensity of FPS are also present. Excited argon lines were observed in the spectral region between 696.5 and 965.7 nm and the strongest emission occurred at 773.5 and 811.5 nm, respectively. The formation of O and molecular nitrogen can be attributed to the reactions of energetic electrons or argon metastables with ambient air [57]. Many authors have reported that HO and O radicals are considered as one of the main short-lived ROS in the plasma discharge, and they can directly react with organic pollutants which lead to degradation [14, 19, 24, 61].
Emission intensities are determined with various input powers. Figure 7 illustrates that the emission intensities of HO, H, nitrogen SPS, excited argon as a function of deposited power to the sample (ground). It can be observed that the spectral emission intensity of the species increases almost linearly with the increase in deposited power. The largest change in the intensity occurred with species such as O (844.6 nm), nitrogen SPS and excited argon, whereas the intensity of HO, H, and O (777.5 nm) only slightly increases with input powers. The observed influence of input power correlates with results presented by other researchers [57]. Changes in emission intensities with power are related to higher energy delivered to the plasma. Higher power probably could lead to an increase in the electron temperature as well as electron density which influences the emission intensity of excited species [62]. From the viewpoint of treatments, higher intensities and concentrations of reactive species are the essential factors in order to degrade organic pollutants [11, 44]. The OES is a simple and, more important, non-intrusive diagnostic technique that can give information about the excited atomic, molecular and ion species. Its simplicity makes it readily available and the obtained results can be easily interpreted. However, they do not give the whole picture about the plasma chemistry (especially in the gas phase). This can be done by using the Fourier transform infrared (FTIR) spectroscopy, which was not readily available in our case. In the literature, FTIR analysis was carried out to analyze long-lived reactive species in the gas phase. For example, in the study of [11], FTIR analysis was performed to characterize the plasma-liquid interaction, where a plasma jet was formed over the liquid surface in ambient air. It was found that FTIR confirmed the presence of various reactive species (e.g., O3, NO2, HNO3, HNO2, etc.) during plasma–liquid interaction in ambient air. [63] have demonstrated the effect of a water surface on the production of reactive species and FTIR spectroscopy was applied to identify O3 and NO2 in the far-field of the cold atmospheric plasma jet. [64] investigated the synthesis of nanoparticles in liquid with cold atmospheric plasma and they have used FTIR for surface characterization of the TiO2. Another diagnostic technique that can give information about plasma chemistry (both radicals, atoms, molecules, and ions) is mass spectrometry at atmospheric pressure. We have performed characterization of various plasma sources that operate at atmospheric pressure by using HIDEN HPR60 and obtained mass spectra of neutral radicals (atoms/molecules) and ions (results are presented here) [65–68].

FIGURE 7. The emission intensity of excited species under various input powers in contact with the sample at Vo = 5 ml and Ar flow 1 slm.
In the direct treatment process, the effect of various experimental parameters, including initial concentration of AB25, treatment time and power deposition on the degradation of dye was investigated.
In the laboratory-scale experiments, two initial concentrations of AB25 were used. The degradation of dye in the solutions as a function of treatment time is given in Figure 8A. With the increase of treatment time, the concentration of AB25 was decreased exponentially. In both cases, the degradation was significantly more pronounced in the first 5 min. The removal efficiency values were about 87% for 25 mg/L and 73% for 50 mg/L within 5 min. In case of lower initial concentration, the destruction of AB25 for the longest treatment time (10 min) was about 100%, whereas for the two times greater initial concentration the obtained removal efficiency was around 93%. It can be expected that for a longer time the higher initial concentration of AB25 would be completely removed.
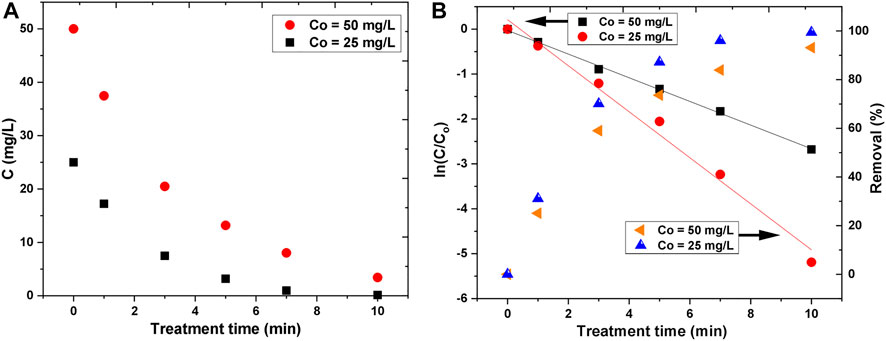
FIGURE 8. Decrease of AB25 concentration (C) as a function of treatment time (A) and logarithmic illustration of AB25 concentration decrease and removal percentage with treatment time (B) at Vo = 5 ml, Ar flow 1 slm and Pmean at the sample 11 W.
Visually, the change in the coloring of the sample can be observed in Figure 9. For lower AB25 concentration and within 10 min of treatment time, dye almost disappeared. On the other hand, for the higher concentration, the solution was not completely colorless.
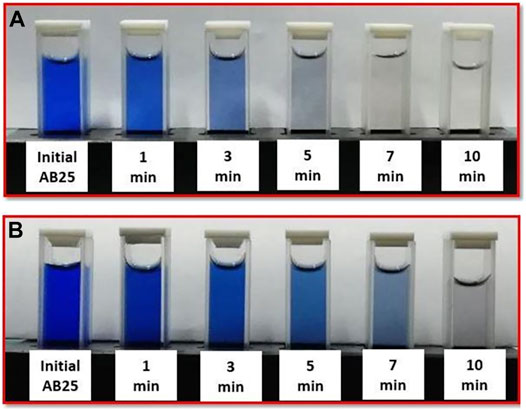
FIGURE 9. Colour change of AB25 samples during the direct treatment by APPJ (A) Co = 25 mg/L (B) Co = 50 mg/L at Vo = 5 ml, Ar flow 1 slm, and Pmean power at the sample 11 W.
The kinetic study was performed in order to understand the degradation rate of AB25. It was found that the degradation of AB25 for both initial concentrations followed the first-order kinetics during investigated treatment duration (Figure 8B) with good regression coefficient values (R2 ≥ 0.98).
First-order kinetics is defined by the following Eq. 7, where k is rate constant and t is treatment time.
The half-life (t1/2) AB25 decomposition time was determined by the given Eq. 8 and shown in Table 1.
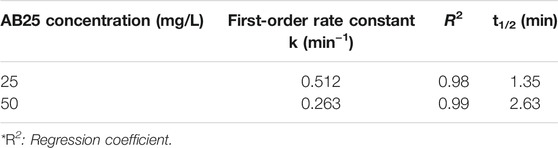
TABLE 1. Degradation rate constants and half-life at two different AB25 concentrations in the sample.
It can be inferred from Table 1 that the lower initial concentration of AB25 promotes the higher degradation rate constant. The half-life time for 25 mg/L was almost 2 times lower than 50 mg/L, which attributed to a faster degradation rate for the lower AB25 initial concentration. The higher concentration of AB25 means a higher number of dye molecules in the solution, whereas the formation of plasma species remains almost the same. Moreover, at the higher concentration, intermediate products may become more relevant and not all introduced plasma species continue reacting with the original AB25 molecules (competition with intermediates). Yet, concerning that equation for first-order kinetics (7) precisely fits the data, the effect involving intermediate products is not pronounced. Almost a similar behavior was reported in the previous research on the degradation of AB25, where DC glow discharge was formed in ambient air over the liquid surface [9].
Ghodbane et al. [9] have studied the degradation of AB25 with direct exposure to glow discharge, whereas plasma-treated samples were characterized by using HPLC and HPLC-MS. They have reported that the key reactive species such as high energy electrons, O3, and HO can attack at various positions of AB25 molecules and lead to the formation of low molecular weight residues. For example, initially, the reactive species can attack various chemical bonds in the AB25 molecule, including amino, sulfonic and vinylsulfonyl since they are located far from anthraquinone rings (stable), and then various bonds in naphthaquinone rings can be eliminated. It was found that low molecular weight products such as pyrocatechol, 3,6-diamino-4-methylphthalic acid, benzene, and 2,5-dimethylphenol appeared due to oxidation of AB25. [69] have investigated the degradation of AB25 with AOPs (e.g., UV-H2O2 and UV-TiO2), and they reported the possible degradation pathways for AB25. It was mentioned that degradation can be initiated by attacking at C-N bond to separate the aromatic ring and then hydroxylation in the secondary amine position. In further steps, splitting of quinone ring leading to the formation of 2-amino-4-(2-carboxybenzoyl)-5-hydroxybenzenesulfonate, after that it further oxidizes to phthalic acid and then turns into formic and oxalic acids. Finally, ending up with complete mineralization of the dye. In the study of [70] corona discharge was used for degradation of AB25. Authors reported degradation pathways of AB25, whereas O3 and H2O2 were the major reactive species that are responsible for degradation. The products such as CO2, H2O, SO42−, NO3− were found by the end of treatment.
The energy yield was calculated and it depended on the removal percentage of AB25 for both initial concentrations. The energy yield was higher at the beginning of the treatment (shorter treatment times) due to a faster degradation rate. However, for fixed removal percentage the difference in the energy yield was not significant for both initial AB25 concentrations. In this case, the energy yield was about 259 mg/kWh for 50 mg/L and 252 mg/kWh for 25 mg/L at 50% removal, respectively.
The pH and the conductivity of the treated solutions were also measured. The results are presented in Figure 10. For both initial concentrations, the pH changed in the same way and it drastically dropped with the treatment time. After 10 min of treatment time, the final pH was about 2.5. The decrease in the pH can be attributed to the formation of acidic molecules (e.g., HNO3 and HNO2) and the higher concentration of hydrogen ions (H+) inside the solution [11, 71–73]. Based on measured pH, the concentration of H+ ions was determined by Eq. 9 [74]. The concentration of H+ ions with treatment time is plotted in Figure 10A, where it increased linearly with treatment time.
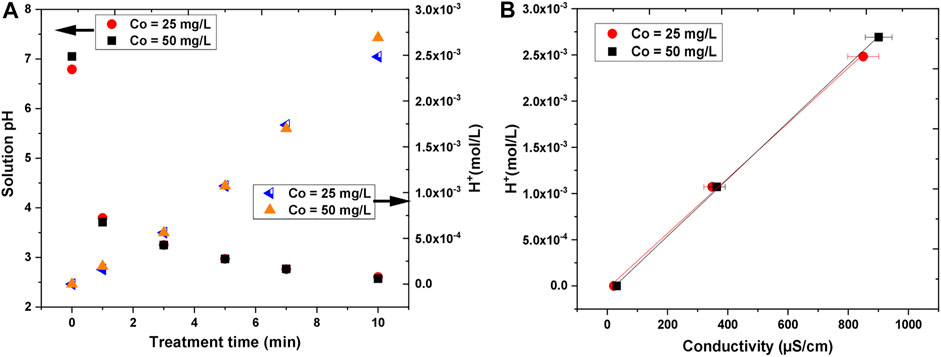
FIGURE 10. The variation in (A) solution pH and hydrogen ion (H+) concentration with treatment time (B) hydrogen ion (H+) concentration with conductivity.
It was observed that the conductivity of the treated solutions increased with the increase in treatment time. The initial conductivity, which was quite small (21–31 μS/cm), was enhanced up to about 850–900 μS/cm after 10 min of treatment. The conductivity was somewhat higher for the higher initial concentration of AB25, but the difference was not significant. The electrical conductivity is determined by the Kohlrausch law taking into account the concentration and nature of ions inside solution, whereby H+ ions can contribute strongly because of the Grotthus proton-hopping mechanism leading to an exceptionally high limiting molar ionic conductivity (349.8 S cm2/mol). Figure 10B shows that the H+ ions concentration measured against conductivity has a linear dependence.
The influence of deposited power on AB25 degradation was also investigated. The experiment was carried at the initial AB25 concentration of 50 mg/L and treatment time of 5 min. In Figure 11, the effect of the deposited power into the discharge on the change in AB25 concentration and removal percentage is shown. As expected, the higher degradation of AB25 was accomplished when there was more power transferred to the sample. At higher input power, more energy can be delivered to the plasma to support the formation of more reactive species. It was evident from OES result (Figure 7), where emission intensities of reactive species increased with input powers. Therefore, the presence of more reactive species in the gas phase can lead to the degradation of AB25. The observed effect was illustrated in various papers, showing that input power played a beneficial role in the degradation of various organic dyes [75, 76].
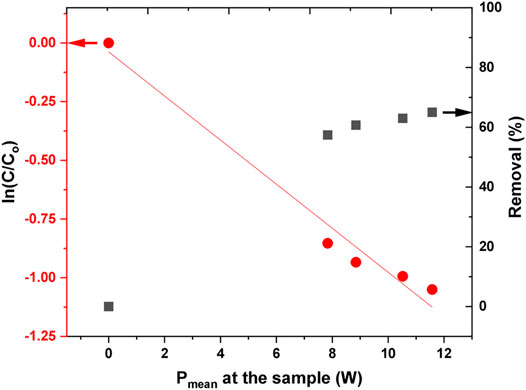
FIGURE 11. Normalized decrease of AB25 concentration shown in logarithmic scale and removal percentage as a function of power deposition to the sample. The initial concentration of AB25 was Co = 50 mg/L, treatment time 5 min, Vo = 5 ml, Ar flow 1 slm.
The kinetic curves for the removal of AB25 as a function of deposited power are shown in Figure 11. In the first-order reaction (Eq. 7), the time was replaced by input power to determine what is more cost-efficient: to increase the power or to use a longer treatment time. The value of the rate constant revealed that increasing the input power shows slower degradation compared to increasing the treatment time. A modified first-order and half-life equation is described by a given equation.
It takes about 7 W of input power to decompose 50% of AB25 (Table 2), calculated by Eq. 11.

TABLE 2. Degradation rate constant and half-life at different power in plasma.
Since the treatment was carried out at different input powers, the energy yield was also determined based on the amount of power consumed to remove 50% of AB25 at a fixed treatment time of 5 min and AB25 concentration of 50 mg/L. The calculated energy yield was about 203 mg/kWh. Comparing to Table 1 for 50% proves that removal varying the power at fixed treatment time was not cost-effective. It is more effective to use lower power and longer treatment times.
In the indirect treatment, AB25 was treated with PAW and, as control experiments, with solutions containing: (a) H2O2 (b) NO3−, (c) NO2− and (d) H2O2 + NO3− + NO2−.
The control experiments were commenced taking into account that PAW is a cocktail of various long-lived stable species (e.g., H2O2, NO3−, NO2−, ONOOH, O3, etc.) [27, 48]. In this study, the PAW has been generated by exposure of distilled water for 10 min to APPJ argon plasma, with deposited power delivered to the sample of about 11 W and with Ar flow of 1 slm. After the generation of PAW, concentrations of several identified species were measured and the measured values are: H2O2—255 mg/L, NO3−—222 mg/L, NO2−—0.06 mg/L. After the activation, it was observed that the pH dropped from about 6.5 to 2.62 and conductivity increased from around 12 to 708.4 μS/cm, respectively. Many authors have worked on the generation and characterization of PAW, where they quantified various long-lived ROS and RNS [14, 57, 77, 78].
It was evident from OES spectra, that HO., O., H. and nitrogen species were formed in the plasma discharge. These species could contribute to produce varieties of oxygen and nitrogen-based species in the gaseous phase as well as at the gas-liquid interface. The generated species could transfer into the liquid phase and be converted to long-lived species, such as H2O2, NO3−, and NO2−. The comprehensive overview of the origination of ROS and RNS during plasma and liquid interactions has been investigated by several authors [19, 24, 41, 79].
H2O2 is the key active ROS formed in the PAW [14, 42], with an oxidation potential of 1.77 V [24]. The formation of H2O2 can be attributed mainly due to the recombination reactions of HO radicals, generated during plasma and liquid interactions [9]. The most dominant and straightforward reaction pathways in the gaseous phase which contribute to the production of H2O2 are described by Eqs 12, 13 [14, 25, 48, 57, 79].
The formation of NO2− and NO3− in the PAW can be generated due to the dissociation of acids such as HNO2 and HNO3 [42, 79]. Both acids can be formed from the reaction of N2 and O2 in the gaseous phase as well as at the gas and liquid interface. NO2− and NO3− inside the liquid can be formed through the following possible reaction pathways [42, 79].
The presence of long-lived species, including H2O2, NO2− and H+ in the liquid with a lower pH can produce peroxynitrous acid (ONOOH), which is a powerful oxidizing agent with an oxidation potential of 2.0 V [46]. ONOOH can also be decomposed and it is possible to generate HO via the following reaction mechanism [48, 79].
After creation, PAW was immediately mixed with AB25-containing solution. Based on the quantified concentration of species that were produced in PAW, four different solutions, namely (I) H2O2, (II) NO3−, (III) NO2− and (IV) H2O2 + NO3− + NO2−, were prepared and mixed with AB25-containing solution as control experiments. The PAW and AB25 containing solution, as well as, solutions (I)–(IV) and AB25 containing solution have then been followed and periodically characterized for 17 days to check the influence of long-lived reactive species on the degradation of AB25. The initial pH of each solution were measured and the measured values are: pH of PAW + AB25—2.97, H2O2 + AB25—4.22, NO3− + AB25—6, NO2− + AB25—6, and H2O2 + NO3− + NO2− + AB25—4.55.
The effect of PAW and chemicals on the degradation of AB25 is shown in Figure 12. There was no degradation observed immediately after the PAW or solutions (I)–(IV) were mixed with AB25 containing solution (at 0 days). Degradation was noticed after a couple of days of experiment. The solutions containing individual chemicals (II)—NO3− or (III)—NO2− did not play any significant role up to 17 days (almost negligible). In case of solution (I)-H2O2 the degradation of the AB25 became significant after 8 days ending at close to the 50%. The mixture of all three chemicals solution (IV) gave slightly better results in the first days after the solution (IV) was added to the AB25 solution, but on day 17 the removal percentage was similar as in case of only solution (I)—H2O2. The degradation of AB25 was more pronounced with a combination of all three chemicals in the first 10 days, whereas almost the same influence occurred with both cases in between 14 and 17 days. Such influence could attribute to the formation of other reactive species in the solution with the presence of H2O2 + NO3− + NO2−, which might be responsible for the faster degradation in the first 10 days. The best degradation rate was obtained when AB25 solution was mixed with PAW with the maximal removal percentage of about 71% within 17 days. The PAW seems to have a significant influence on the depletion of AB25 compared to the solution with chemicals. Such difference can be explained by the probability of the formation of other reactive species in PAW, which supported and contributed to faster degradation. In the study by Cadorin et al. [46] and Moussa et al. [47], it was reported that the presence of ONOOH in the plasma-activated solution favored the degradation of organic dye (methyl orange).
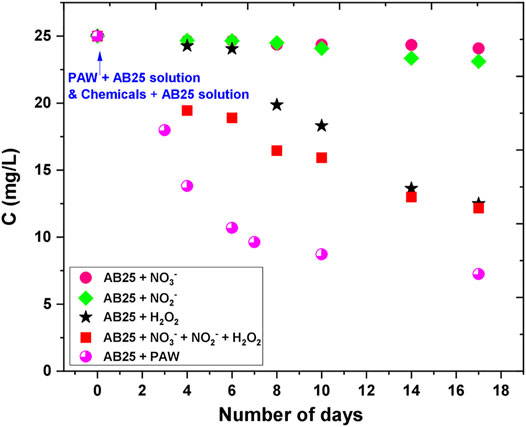
FIGURE 12. Effect of PAW and artificial RONS solutions on the degradation of AB25. The initial concentration of AB25 was 25 mg/L. The concentration of AB25 was intermittently measured during 17 days.
To examine the effect of low pH on AB25 removal, an additional experiment with a control sample was performed, where hydrochloric acid (HCl) was added into AB25 solution to maintain a low pH of 3.04. It was observed that the concentration of AB25 almost remained the same within 17 days. Hence, only in acidic conditions, there was no significant acid-catalyzed hydrolysis of AB25.
To allow comparison to the long-term effects of the indirect treatment, direct treatment experiments were carried out with two different initial AB25 concentrations and the plasma-treated solutions were kept and analyzed for 17 days as in the indirect case (e.g., with PAW and reagents). The objective was to investigate the effect of formed long-lived ROS and RNS on the degradation of AB25 after direct exposure to APPJ. After 5 min of treatment, the concentration of AB25 decreased from 50 mg/L to about 16 mg/L and 25 mg/L to about 3 mg/L, respectively. Here, AB25 solution was not directly treated for a longer duration because of evidence from the direct treatment indicating that higher treatment time favored almost complete degradation. Therefore, the treatment time was kept short so that the effect of long-lived reactive species on the degradation of residual AB25 after the direct treatment could be studied.
As shown in Figure 13, it was observed that there was minor decay of AB25 concentration after the analysis of the plasma-treated sample for several days. Since H2O2 was the important long-lived ROS in the indirect treatment process (Figure 12) we can assume that insufficient amount of H2O2 remained after the direct exposure of AB25 solution to APPJ due to its role in degradation processes. This revealed that dominant HO. was consumed immediately after it was formed and consequently reacted with dye molecules.
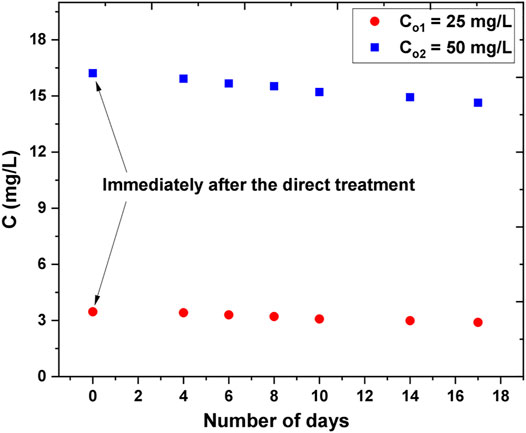
FIGURE 13. Follow-up of extended effect of the long-lived species on the degradation of AB25 after the direct plasma treatment. The initial concentrations of AB25 samples were Co1 = 25 mg/L and Co2 = 50 mg/L which were treated directly by APPJ, treatment time 5 min, Ar flow 1 slm, V0 = 5 ml, Pmean at the sample 11 W. Concentrations of AB25 were measured immediately after the direct plasma treatment and then intermittently during next 17 days.
The treatment of AB25 with direct APPJ exposure, with PAW, and with solution of mixed chemicals have been studied. A pin-type APPJ was studied as a potentially efficient tool to remove AB25 from water. The plasma characteristics of pin type-APPJ including electrical characterization with calculations of mean power deposited to the discharge were presented. OES shows the emission spectra of the discharge with various reactive species (e.g., HO, O, H etc.). The plasma was ignited in a mixture of argon with the surrounding air, hence there was a significant presence of argon lines, the nitrogen molecule and ion bands. In the emission spectrum, HO as well as O radicals, were the most important detected short-lived species, since they could attack AB25 molecules and contribute to degradation. It was also noticed that the emission intensities of these species increase with the input power. The increase of the emission intensity of reactive oxygen species such as HO and O (844.6 nm) was more pronounced with input power, whereas O (777.5 nm) emission intensity increased only slightly.
In the direct treatment process, the removal rate of AB25 was increased by decreasing the initial AB25 concentration. The removal efficiency was about 87% with a lower concentration of 25 mg/L and 73% with a higher concentration of 50 mg/L within 5 min of treatment and power deposition of 11 W. Almost complete removal was obtained with a treatment time of 10 min and at AB25 concentration of 25 mg/L and power deposition of 11 W. For both initial concentrations, the degradation rates followed the first-order kinetics. An explanation for a continued first-order degradation could be that the bulk of the AB25 degradation happens through a species that reacts selectively with AB25 and that it is present in a pseudo-steady-state concentration. It was observed that the degradation is enhanced with the increase of the input power and this was supported with OES results. On the other hand, the increase in power does not lead to such a significant increase in the degradation rate as compared with the increase in treatment time.
The indirect treatments of AB25 with PAW and with solutions containing main PAW chemicals and their mixture were performed and compared during 17 days monitoring period. It was observed that the degradation was higher with PAW and with the mixture of H2O2 + NO3− + NO2−. Within 17 days, the highest removal efficiency was found to reach about 71% when AB25 solution was mixed with PAW. However, individual reagents such as NO3− and NO2− did not contribute any major role to the degradation. AB25 solution was also kept at low pH without any reagents, the results confirm that acidic condition does not influence degradation.
Apart from indirect treatment experiments, samples after the direct treatment by APPJ were kept and characterized for 17 days to facilitate comparison. It was noticed that there was no significant difference in the concentration of AB25, which indicated that there might be unavailability of enough long-lived ROS in the solution (e.g., H2O2).
Considering all experimental results, it can be concluded that removal of AB25 from water can be accomplished in a direct treatment with APPJ, indirect treatment with PAW, as well as adding H2O2, and mixture H2O2 + NO3− + NO2−. The depletion of AB25 was faster after the direct treatment with APPJ and slower for indirect treatment with PAW and with added chemicals.
The original contributions presented in the study are included in the article/supplementary material, further inquiries can be directed to the corresponding authors.
Conceptualization AK. NP, WG, NS; writing—original draft preparation AK, review and editing AK, NS, NP, WG; supervision NP, WG, DP; project administration NP, WG. All authors have read and agreed to the published version of the manuscript.
This work was carried out under NOWELTIES project. NOWELTIES received funding from the European Union’s Horizon 2020 research and innovation programme under the Marie Skłodowska-Curie grant agreement No. 812880. NS and NP are funded by the Ministry of Education, Science and Technological Development, grant number 451-03-68/2020- 14/200024.
The authors declare that the research was conducted in the absence of any commercial or financial relationships that could be construed as a potential conflict of interest.
All claims expressed in this article are solely those of the authors and do not necessarily represent those of their affiliated organizations, or those of the publisher, the editors and the reviewers. Any product that may be evaluated in this article, or claim that may be made by its manufacturer, is not guaranteed or endorsed by the publisher.
This article is based upon work from COST Action PLAGRI—CA19110, supported by the COST (European Cooperation in Science and Technology), www.cost.eu. AK is grateful to Ms. Andjelija Petrovic and Ms. Olivera Jovanovic for useful instructions and help regarding plasma diagnostics and protocols for liquid samples.
1. Bayomie OS, Kandeel H, Shoeib T, Yang H, Youssef N, El-Sayed MMH. Novel Approach for Effective Removal of Methylene Blue Dye from Water Using Fava Bean Peel Waste. Sci Rep (2020) 10:1–10. doi:10.1038/s41598-020-64727-5
2. Tiwari M, Shukla SP, Mohan D. Toxicity of Disperse Dyes and its Removal from Wastewater Using Various Adsorbents: A Review. Res J. Environ Toxicol (2017) 11:72–89. doi:10.3923/rjet.2017.72.89
3. Fernández C, Larrechi MS, Callao MP. An Analytical Overview of Processes for Removing Organic Dyes from Wastewater Effluents. Trac Trends Anal Chem (2010) 29:1202–11. doi:10.1016/j.trac.2010.07.011
4. Islam M, Mostafa M. Textile Dyeing Effluents and Environment Concerns - A Review. J Environ Sci Nat Resour (2019) 11:131–44. doi:10.3329/jesnr.v11i1-2.43380
5. Mia R, Selim M, Shamim AM, Chowdhury M, Sultana S, Armin M, et al. Review on Various Types of Pollution Problem in Textile Dyeing & Printing Industries of Bangladesh and Recommandation for Mitigation. J Text Eng (2019) 5:220–6. doi:10.15406/jteft.2019.05.00205
6. Drumond Chequer FM, de Oliveira GAR, Anastacio Ferraz ER, Carvalho J, Boldrin Zanoni MV, de Oliveir DP. Textile Dyes: Dyeing Process and Environmental Impact. Eco-Friendly Text Dye Finish (2013) 6:151–17. doi:10.5772/53659
7. Wong S, Ghafar NA, Ngadi N, Razmi FA, Inuwa IM, Mat R, et al. Effective Removal of Anionic Textile Dyes Using Adsorbent Synthesized from Coffee Waste. Sci Rep (2020) 10:1–13. doi:10.1038/s41598-020-60021-6
8. Kant R. Textile Dyeing Industry an Environmental Hazard. Nat Sci (2012) 04:22–6. doi:10.4236/ns.2012.41004
9. Ghodbane H, Nikiforov AY, Hamdaoui O, Surmont P, Lynen F, Willems G, et al. Non-Thermal Plasma Degradation of Anthraquinonic Dye in Water: Oxidation Pathways and Effect of Natural Matrices. J Adv Oxid Technol (2014) 17:372–84. doi:10.1515/jaots-2014-0223
10. Mitrović J, Radović-Vučić M, Kostić M, Velinov N, Najdanović S, Bojić D, et al. The Effect of Anions on Decolorization of Textile Azo Dye Reactive Orange 16 with UV/H2O2 Process. Adv Techol (2019) 8:33–40. doi:10.5937/savteh1901033m
11. Naz MY, Shukrullah S, Rehman SU, Khan Y, Al-Arainy AA, Meer R. Optical Characterization of Non-thermal Plasma Jet Energy Carriers for Effective Catalytic Processing of Industrial Wastewaters. Sci Rep (2021) 11:1–13. doi:10.1038/s41598-021-82019-4
12. Guivarch E, Trevin S, Lahitte C, Oturan MA. Degradation of Azo Dyes in Water by Electro-Fenton Process. Environ Chem Lett (2003) 1:38–44. doi:10.1007/s10311-002-0017-0
13. Merouani DR, Abdelmalek F, Taleb F, Martel M, Semmoud A, Addou A. Plasma Treatment by Gliding Arc Discharge of Dyes/dye Mixtures in the Presence of Inorganic Salts. Arabian J Chem (2015) 8:155–63. doi:10.1016/j.arabjc.2011.01.034
14. Attri P, Yusupov M, Park JH, Lingamdinne LP, Koduru JR, Shiratani M, et al. Mechanism and Comparison of Needle-Type Non-Thermal Direct and Indirect Atmospheric Pressure Plasma Jets on the Degradation of Dyes. Sci Rep (2016) 6:1–14. doi:10.1038/srep34419
15. Ruppert G, Bauer R, Heisler G. UV-O3, UV-H2O2, UV-TiO2 and the Photo-Fenton Reaction - Comparison of Advanced Oxidation Processes for Wastewater Treatment. Chemosphere (1994) 28:1447–54. doi:10.1016/0045-6535(94)90239-9
16. Abhilasha J, Ashma A, Marazban K. A Greener Approach for the Degradation of Dye Methylene Blue by Organic Additive Catalysed Photo - Fenton Process. J Chil Chem Soc (2016) 61:3043–8. doi:10.4067/S0717-97072016000300007
17. Papić S, Koprivanac N, Božić AL, Vujević D, Dragičević SK, Kušić H, et al. Advanced Oxidation Processes in Azo Dye Wastewater Treatment. Water Environ Res (2006) 78:572–9. doi:10.2175/106143006x101665
18. Cuerda-Correa EM, Alexandre-Franco MF, Fernández-González C. Advanced Oxidation Processes for the Removal of Antibiotics from Water. An Overview. Water (2019) 12:102. doi:10.3390/w12010102
19. Mouele ESM, Tijani JO, Fatoba OO, Petrik LF. Degradation of Organic Pollutants and Microorganisms from Wastewater Using Different Dielectric Barrier Discharge Configurations-A Critical Review. Environ Sci Pollut Res (2015) 22:18345–62. doi:10.1007/s11356-015-5386-6
20. Hama Aziz KH, Miessner H, Mueller S, Kalass D, Moeller D, Khorshid I, et al. Degradation of Pharmaceutical Diclofenac and Ibuprofen in Aqueous Solution, a Direct Comparison of Ozonation, Photocatalysis, and Non-Thermal Plasma. Chem Eng J (2017) 313:1033–41. doi:10.1016/j.cej.2016.10.137
21. Lesage O, Falk L, Tatoulian M, Mantovani D, Ognier S. Treatment of 4-Chlorobenzoic Acid by Plasma-Based Advanced Oxidation Processes. Chem Eng Process Process Intensification (2013) 72:82–9. doi:10.1016/j.cep.2013.06.008
22. Abdel-Fattah E. Atmospheric Pressure Helium Plasma Jet and its Applications to Methylene Blue Degradation. J Electrostatics (2019) 101:103360. doi:10.1016/j.elstat.2019.103360
23. Hijosa-Valsero M, Molina R, Montràs A, Müller M, Bayona JM. Decontamination of Waterborne Chemical Pollutants by Using Atmospheric Pressure Nonthermal Plasma: A Review. Environ Technol Rev (2014) 3:71–91. doi:10.1080/21622515.2014.990935
24. Jiang B, Zheng J, Qiu S, Wu M, Zhang Q, Yan Z, et al. Review on Electrical Discharge Plasma Technology for Wastewater Remediation. Chem Eng J (2014) 236:348–68. doi:10.1016/j.cej.2013.09.090
25. Sarangapani C, Dixit Y, Milosavljevic V, Bourke P, Sullivan C, Cullen PJ. Optimization of Atmospheric Air Plasma for Degradation of Organic Dyes in Wastewater. Water Sci Technol (2017) 75:207–19. doi:10.2166/wst.2016.471
26. Škoro N, Puač N, Živković S, Krstić-Milošević D, Cvelbar U, Malović G, et al. Destruction of Chemical Warfare Surrogates Using a Portable Atmospheric Pressure Plasma Jet. Eur Phys J D (2018) 72:1–8. doi:10.1140/epjd/e2017-80329-9
27. Tomić S, Petrović A, Puač N, Škoro N, Bekić M, Petrović ZL, et al. Plasma-Activated Medium Potentiates the Immunogenicity of Tumor Cell Lysates for Dendritic Cell-Based Cancer Vaccines. Cancers (2021) 13:1626–13. doi:10.3390/cancers13071626
28. Fridman A. Plasma Chemistry. 1st ed. Cambridge: Cambridge University Press (2008). doi:10.1017/CBO9780511546075
29. Bruggeman P, Brandenburg R. Atmospheric Pressure Discharge Filaments and Microplasmas: Physics, Chemistry and Diagnostics. J Phys D: Appl Phys (2013) 46:464001. doi:10.1088/0022-3727/46/46/464001
30. Chen FF. Introduction to Plasma Physics and Controlled Fusion. 3rd ed. Cham: Springer International Publishing (2016). doi:10.1007/978-3-319-22309-4
31. Jaiswal AK, Ananthanarasimhan J, Shivapuji AM, Dasappa S, Rao L. Experimental Investigation of a Non-catalytic Cold Plasma Water-Gas Shift Reaction. J Phys D: Appl Phys (2020) 53:465205. doi:10.1088/1361-6463/aba92d
32. Puač N, Gherardi M, Shiratani M. Plasma Agriculture: A Rapidly Emerging Field. Plasma Process Polym (2018) 15:1700174. doi:10.1002/ppap.201700174
33. Dobslaw C, Glocker B. Plasma Technology and its Relevance in Waste Air and Waste Gas Treatment. Sustainability (2020) 12:8981–39. doi:10.3390/su12218981
34. López M, Calvo T, Prieto M, Múgica-Vidal R, Muro-Fraguas I, Alba-Elías F, et al. A Review on Non-Thermal Atmospheric Plasma for Food Preservation: Mode of Action, Determinants of Effectiveness, and Applications. Front Microbiol (2019) 10:622. doi:10.3389/fmicb.2019.00622
35. Bornholdt S, Wolter M, Kersten H. Characterization of an Atmospheric Pressure Plasma Jet for Surface Modification and Thin Film Deposition. Eur Phys J D (2010) 60:653–60. doi:10.1140/epjd/e2010-00245-x
36. Sun B, Aye NN, Gao Z, Lv D, Zhu X, Sato M. Characteristics of Gas-Liquid Pulsed Discharge Plasma Reactor and Dye Decoloration Efficiency. J Environ Sci (2012) 24:840–5. doi:10.1016/S1001-0742(11)60837-1
37. Tichonovas M, Krugly E, Racys V, Hippler R, Kauneliene V, Stasiulaitiene I, et al. Degradation of Various Textile Dyes as Wastewater Pollutants under Dielectric Barrier Discharge Plasma Treatment. Chem Eng J (2013) 229:9–19. doi:10.1016/j.cej.2013.05.095
38. Magureanu M, Piroi D, Mandache NB, David V, Medvedovici A, Bradu C, et al. Degradation of Antibiotics in Water by Non-Thermal Plasma Treatment. Water Res (2011) 45:3407–16. doi:10.1016/j.watres.2011.03.057
39. Sarangapani C, Misra NN, Milosavljevic V, Bourke P, O’Regan F, Cullen PJ. Pesticide Degradation in Water Using Atmospheric Air Cold Plasma. J Water Process Eng (2016) 9:225–32. doi:10.1016/j.jwpe.2016.01.003
40. Vanraes P, Ghodbane H, Davister D, Wardenier N, Nikiforov A, Verheust YP, et al. Removal of Several Pesticides in a Falling Water Film DBD Reactor with Activated Carbon Textile: Energy Efficiency. Water Res (2017) 116:1–12. doi:10.1016/j.watres.2017.03.004
41. Locke BR, Sato M, Sunka P, Hoffmann MR, Chang J-S. Electrohydraulic Discharge and Nonthermal Plasma for Water Treatment. Ind Eng Chem Res (2006) 45:882–905. doi:10.1021/ie050981u
42. Bradu C, Kutasi K, Magureanu M, Puač N, Živković S. Reactive Nitrogen Species in Plasma-Activated Water: Generation, Chemistry and Application in Agriculture. J Phys D: Appl Phys (2020) 53:223001. doi:10.1088/1361-6463/ab795a
43. Kumar A, Škoro N, Gernjak W, Puač N. Cold Atmospheric Plasma Technology for Removal of Organic Micropollutants from Wastewater-A Review. Eur Phys J D (2021) 75:1–26. doi:10.1140/epjd/s10053-021-00283-5
44. Jaiswal S, Aguirre EM. Comparison of Atmospheric Pressure Argon Producing O(1S) and Helium Plasma Jet on Methylene Blue Degradation. AIP Adv (2021) 11:045311. doi:10.1063/5.0046948
45. Shutov DA, Bogdanov PV, Pleskunov PL. Destruction of Organic Dyes in Aqueous Solution by Low-Temperature Plasma Jet Treatment. High Energ Chem (2016) 50:77–81. doi:10.1134/S0018143915050124
46. Cadorin BM, Tralli VD, Ceriani E, Benetoli LOd. B, Marotta E, Ceretta C, et al. Treatment of Methyl orange by Nitrogen Non-thermal Plasma in a corona Reactor: The Role of Reactive Nitrogen Species. J Hazard Mater (2015) 300:754–64. doi:10.1016/j.jhazmat.2015.08.009
47. Moussa D, Doubla A, Kamgang-Youbi G, Brisset J-L. Postdischarge Long Life Reactive Intermediates Involved in the Plasma Chemical Degradation of an Azoic Dye. IEEE Trans Plasma Sci (2007) 35:444–53. doi:10.1109/TPS.2007.892578
48. Zhou R, Zhou R, Prasad K, Fang Z, Speight R, Bazaka K, et al. Cold Atmospheric Plasma Activated Water as a Prospective Disinfectant: The Crucial Role of Peroxynitrite. Green Chem (2018) 20:5276–84. doi:10.1039/c8gc02800a
49. Liu ZC, Liu DX, Chen C, Li D, Yang AJ, Rong MZ, et al. Physicochemical Processes in the Indirect Interaction between Surface Air Plasma and Deionized Water. J Phys D: Appl Phys (2015) 48:495201. doi:10.1088/0022-3727/48/49/495201
50. Piskarev IM, Ivanova IP. Comparison of Chemistry Induced by Direct and Indirect Plasma Treatment of Water to the Effect of UV Radiation. Plasma Chem Plasma Process (2021) 41:447–75. doi:10.1007/s11090-020-10127-6
51. Ghodbane H, Hamdaoui O. Decolorization of Antraquinonic Dye, C.I. Acid Blue 25, in Aqueous Solution by Direct UV Irradiation, UV/H2O2 and UV/Fe(II) Processes. Chem Eng J (2010) 160:226–31. doi:10.1016/j.cej.2010.03.049
52. Kooh MRR, Dahri MK, Lim L, Hoon LL. Removal of Acid Blue 25 from Aqueous Solution by Using Common Salts and Seawater to Induce the Salting Out Effect. Sci Bruneiana (2018) 16:5–11. doi:10.46537/scibru.v16i2.61
53. Routoula E, Patwardhan SV. Degradation of Anthraquinone Dyes from Effluents: A Review Focusing on Enzymatic Dye Degradation with Industrial Potential. Environ Sci Technol (2020) 54:647–64. doi:10.1021/acs.est.9b03737
54. Fanchiang J-M, Tseng D-H. Degradation of Anthraquinone Dye C.I. Reactive Blue 19 in Aqueous Solution by Ozonation. Chemosphere (2009) 77:214–21. doi:10.1016/j.chemosphere.2009.07.038
55. Lihong H-H, Wangtao Y-T, Wang Y, Wangxia H-X, Sunkai K-K, Lumei Z-M. Bacterial Degradation of Anthraquinone Dyes. J Zhejiang Univ Sci B (2019) 20:528–40. doi:10.1631/jzus.B1900165
56. Ghodbane H, Hamdaoui O, Vandamme J, Van Durme J, Vanraes P, Leys C, et al. Degradation of AB25 Dye in Liquid Medium by Atmospheric Pressure Non-Thermal Plasma and Plasma Combination with Photocatalyst TiO2. Open Chem (2014) 13:325–31. doi:10.1515/chem-2015-0040
57. Ghimire B, Szili EJ, Patenall BL, Lamichhane P, Gaur N, Robson AJ, et al. Enhancement of Hydrogen Peroxide Production from an Atmospheric Pressure Argon Plasma Jet and Implications to the Antibacterial Activity of Plasma Activated Water. Plasma Sourc Sci. Technol. (2021) 30:035009. doi:10.1088/1361-6595/abe0c9
58. Barkhordari A, Ganjovi A, Mirzaei I, Falahat A, Rostami Ravari MN. A Pulsed Plasma Jet with the Various Ar/N2 Mixtures. J Theor Appl Phys (2017) 11:301–12. doi:10.1007/s40094-017-0271-y
59. Sremački I, Jurov A, Modic M, Cvelbar U, Wang L, Leys C, et al. On Diagnostics of Annular-Shape Radio-Frequency Plasma Jet Operating in Argon in Atmospheric Conditions. Plasma Sourc Sci. Technol. (2020) 29:035027. doi:10.1088/1361-6595/ab71f7
60. Liu J, He B, Chen Q, Li J, Xiong Q, Yue G, et al. Direct Synthesis of Hydrogen Peroxide from Plasma-Water Interactions. Sci Rep (2016) 6:1–7. doi:10.1038/srep38454
61. Schiorlin M, Paradisi C, Brandenburg R, Schmidt M, Marotta E, Giardina A, et al. Pollutant Degradation in Gas Streams by Means of Non-Thermal Plasmas. In: Current Air Quality Issues. InTechOpen (2015). doi:10.5772/60049
62. Sornsakdanuphap J, Suanpoot P, Hong YJ, Ghimire B, Cho G, Uhm HS, et al. Electron Temperature and Density of Non-Thermal Atmospheric Pressure Argon Plasma Jet by Convective Wave Packet Model. J Korean Phys Soc (2017) 70:979–89. doi:10.3938/jkps.70.979
63. Hansen L, Schmidt-Bleker A, Bansemer R, Kersten H, Weltmann K-D, Reuter S. Influence of a Liquid Surface on the NO X Production of a Cold Atmospheric Pressure Plasma Jet. J Phys D: Appl Phys (2018) 51:474002. doi:10.1088/1361-6463/aad6f0
64. Liu Y, Sun D, Askari S, Patel J, Macias-Montero M, Mitra S, et al. Enhanced Dispersion of TiO2 Nanoparticles in a TiO2/PEDOT:PSS Hybrid Nanocomposite via Plasma-Liquid Interactions. Sci Rep (2015) 5:1–11. doi:10.1038/srep15765
65. Stancampiano A, Selaković N, Gherardi M, Puač N, Petrović ZL, Colombo V. Characterisation of a Multijet Plasma Device by Means of Mass Spectrometric Detection and iCCD Imaging. J Phys D: Appl Phys (2018) 51:484004. doi:10.1088/1361-6463/aae2f2
66. Maletić D, Puač N, Lazović S, Malović G, Gans T, Schulz-Von Der Gathen V, et al. Detection of Atomic Oxygen and Nitrogen Created in a Radio-Frequency-Driven Micro-scale Atmospheric Pressure Plasma Jet Using Mass Spectrometry. Plasma Phys Control Fusion (2012) 54:124046. doi:10.1088/0741-3335/54/12/124046
67. Malović G, Puač N, Lazović S, Petrović Z. Mass Analysis of an Atmospheric Pressure Plasma Needle Discharge. Plasma Sourc Sci. Technol. (2010) 19:034014. doi:10.1088/0963-0252/19/3/034014
68. Selaković N. Mass Spectrometry of Plasma Jet and Application of Electrical Discharches Operating at Atmoshperic Pressure in Biomedicine. PhD Thesis. Beograd: University of Belgrade (2021).
69. Azerrad SP, Kurzbaum E. Chemical Decolorization of Textile Wastewater via Advanced Oxidation Processes: Case Study of Key Parameters with Acid Blue 25. Water Air Soil Pollut (2021) 232:1–14. doi:10.1007/s11270-021-04997-5
70. El-Tayeb A, El-Dein AZ, Elnaggar AY, Hussein EE. Influence of Temperature in Degradation of Organic Pollution Using corona Discharge Plasma. Sustainability (2021) 13:12971. doi:10.3390/su132312971
71. Vlad I-E, Anghel SD. Time Stability of Water Activated by Different On-Liquid Atmospheric Pressure Plasmas. J Electrostatics (2017) 87:284–92. doi:10.1016/j.elstat.2017.06.002
72. Adhikari B, Adhikari M, Ghimire B, Park G, Choi EH. Cold Atmospheric Plasma-Activated Water Irrigation Induces Defense Hormone and Gene Expression in Tomato Seedlings. Sci Rep (2019) 9:1–15. doi:10.1038/s41598-019-52646-z
73. Thirumdas R, Kothakota A, Annapure U, Siliveru K, Blundell R, Gatt R, et al. Plasma Activated Water (PAW): Chemistry, Physico-Chemical Properties, Applications in Food and Agriculture. Trends Food Sci Technol (2018) 77:21–31. doi:10.1016/j.tifs.2018.05.007
75. Li J, Zhou Z, Wang H, Li G, Wu Y. Research on Decoloration of Dye Wastewater by Combination of Pulsed Discharge Plasma and TiO2 Nanoparticles. Desalination (2007) 212:123–8. doi:10.1016/j.desal.2006.10.006
76. Tang Q, Jiang W, Zhang Y, Wei W, Lim TM. Degradation of Azo Dye Acid Red 88 by Gas Phase Dielectric Barrier Discharges. Plasma Chem Plasma Process (2009) 29:291–305. doi:10.1007/s11090-009-9181-3
77. Jin YS, Cho C, Kim D, Sohn CH, Ha C-S, Han S-T. Mass Production of Plasma Activated Water by an Atmospheric Pressure Plasma. Jpn J Appl Phys (2020) 59:SHHF05. doi:10.35848/1347-4065/ab7e13
78. Pawłat J, Terebun P, Kwiatkowski M, Tarabová B, Kovaľová Z, Kučerová K, et al. Evaluation of Oxidative Species in Gaseous and Liquid Phase Generated by Mini-Gliding Arc Discharge. Plasma Chem Plasma Process (2019) 39:627–42. doi:10.1007/s11090-019-09974-9
Keywords: atmospheric pressure plasma jet, acid blue 25, plasma treatment, plasma diagnostics, plasma-activated water
Citation: Kumar A, Škoro N, Gernjak W, Povrenović D and Puač N (2022) Direct and Indirect Treatment of Organic Dye (Acid Blue 25) Solutions by Using Cold Atmospheric Plasma Jet. Front. Phys. 10:835635. doi: 10.3389/fphy.2022.835635
Received: 14 December 2021; Accepted: 24 January 2022;
Published: 15 February 2022.
Edited by:
Pankaj Attri, Kyushu University, JapanReviewed by:
Dheerawan Boonyawan, Chiang Mai University, ThailandCopyright © 2022 Kumar, Škoro, Gernjak, Povrenović and Puač. This is an open-access article distributed under the terms of the Creative Commons Attribution License (CC BY). The use, distribution or reproduction in other forums is permitted, provided the original author(s) and the copyright owner(s) are credited and that the original publication in this journal is cited, in accordance with accepted academic practice. No use, distribution or reproduction is permitted which does not comply with these terms.
*Correspondence: Amit Kumar, YW1pdEBpcGIuYWMucnM=; Nevena Puač, bmV2ZW5hQGlwYi5hYy5ycw==
Disclaimer: All claims expressed in this article are solely those of the authors and do not necessarily represent those of their affiliated organizations, or those of the publisher, the editors and the reviewers. Any product that may be evaluated in this article or claim that may be made by its manufacturer is not guaranteed or endorsed by the publisher.
Research integrity at Frontiers
Learn more about the work of our research integrity team to safeguard the quality of each article we publish.