- 1School of Earth Sciences and Engineering, Xi’an Shiyou University, Xi’an, China
- 2Shaanxi Key Lab of Petroleum Accumulation Geology, Xi’an, China
- 3Research Institute of Exploration and Development, PetroChina Changqing Oilfield Company, Xi’an, China
- 4No.3 Gas Production Plant, PetroChina Changqing Oilfield Company, Wushenqi, China
- 5No.3 Oil Production Plant, PetroChina Changqing Oilfield Company, Yinchuan, China
Gas saturation (Sg) is an important parameter for studying the gas-bearing properties of tight sandstone; however, there has been limited research on gas-bearing properties based on sealing coring. This study determines the controlling factors of the gas-bearing properties of tight sandstone in the Permian He8 Member of the Sulige Gas Field, Ordos Basin, Northern China, based on sealing coring, logging, drilling, gas testing, and laboratory analysis. The He8 Member Sg distribution is 17.9–63.8% (main range: 30–45%) and shows a downward trend from bottom to top. The Ro and hydrocarbon generation intensity of the source rock, reservoir porosity, and permeability tend to control the Sg in stages. When these parameters are less than 1.8%, 17 × 108 m3/km2, 10%, and 0.5 × 10⁻³ μm2, respectively, Sg increases significantly. When each parameter is greater than the aove boundary value, the change in Sg is not obvious. Four types of gas-bearing patterns of tight sandstone can be observed according to the distribution of reservoir and source rock conditions: “upper and lower constant,” “upper low–lower high,” “upper high–medium low–lower high,” and “upper high–lower low”; these patterns are mainly controlled by high maturity source rocks, reservoir physical properties, reservoir physical properties and structure, and structure, respectively. The corresponding gas test results reveal the existence of pure gas, pure gas and gas–water, gas–water, and gas-bearing water and pure water layers, respectively.
Introduction
Tight sandstone gas is the accumulated natural gas in low-permeability sandstone reservoirs within non-source rocks, with air permeabilities of less than 1 × 10⁻³ μm2 and porosities lower than 12% [1]. Inspired by the great success of tight gas exploration in North America, many great exploration breakthroughs have taken place in Ordos, Sichuan, Bohai Bay, Tarim, and other petroliferous basins of China [1–4]. Thirteen gas fields with proven reserves of 1,000 × 108 m3 have been discovered so far in the Ordos Basin, which is the largest tight gas-producing area in China [4–6], forming the Upper Paleozoic tight sandstone gas field group represented by the Sulige Gas Field (SGF).
With the continuous development of tight gas exploration, gas-bearing properties in different areas of the Upper Paleozoic tight sandstone gas reservoir in the SGF are easily differentiated [7–9]. The majority of pure gas layers and lower ratios of water–gas layers are distributed in the central and southeast areas of the SGF; the gas saturation (Sg) can reach 75%. In the western gas field, water-bearing wells account for 56% of the total number of wells, and the Sg of some wells is less than 45%. Therefore, the study of the controlling factors of tight sandstone gas-bearing properties is an urgent problem that requires investigation. Previous studies have discussed the controlling factors of gas-bearing distribution in tight sandstone gas reservoirs from the testing results and have made significant progress. The Sg is also an important parameter for studying tight sandstone gas-bearing properties, but little progress has been made. The Archie formula is the main method for calculating gas saturation systematically [10]. However, that equation has mostly been used for conventional reservoirs and has limitations in the interpretation of tight sandstone gas saturation [11–13]. The sealing coring technique is an accurate method to obtain Sg, which provides data for the systematic study of tight sand gas-bearing properties. Furthermore, previous studies have mainly focused on the macroscopic analysis of controlling factors of gas content distribution in tight sandstone of the SGF, whereas there have been no studies published on the vertical gas content of single sand bodies. Therefore, this paper summarizes previous research and establishes the distribution patterns of tight sandstone gas-bearing properties and its controlling factors in different patterns of the He8 Member in the SGF based on sealing coring data, combined with logging, gas test, and laboratory data. Our aim here is to enrich the accumulation theories of tight gas and improve the efficiency of future exploration and development.
Geological Background
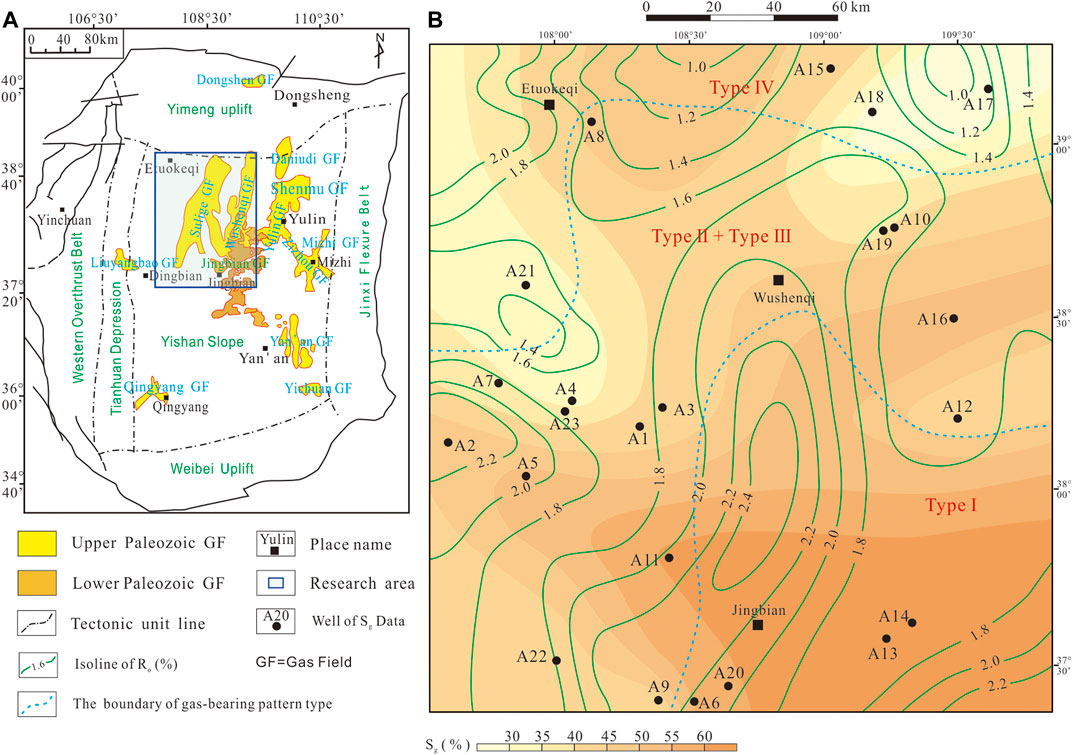
The Ordos Basin, located in northern China, is structurally divided into six first-order structural zones (Figure 1A), covering an area of approximately 2.5 × 10⁴ km2. The SGF is located northwest of the Yishan slope in the central Ordos Basin region (Figure 1A), and its primary gas-producing stratum are the He8 Member of the Lower Shihezi Formation and the Shan1 Member of the Shanxi Formation, with a reserve area of approximately 4 × 10⁴ km2 (Figure 1B). The SGF generally has a stable structure, with an east-dipping slope structure and a complete stratum set because of the stable sedimentary period from the Carboniferous to Cretaceous geological periods. The present west-dipping monoclinal structure is caused by the differential uplift of Yanshanian and Himalayan movement, with the absence of Paleogene and Neogene periods and the thinness of the Quaternary period.

FIGURE 1. (A) Location of SGF (blue box), with tectonic units of Ordos Basin shown. Yellow areas mark Upper Paleozoic gas fields, and brown marks Lower Paleozoic gas fields. (B) Contour map of well maximum sandstone gas saturation of Permian He8 Member, where green line is isoline of Ro (%) and blue is boundary of gas-bearing pattern type as shown in Table 1.
The He8 Member of the Permian Lower Shihezi Formation is the primary subject of this research. Its thickness ranges from 55 to 73 m, and it is subdivided into an upper (He8u) and a lower section (He8l), from bottom to top. Large areas of lenticular sand bodies in the He8 Member are superimposed on each other, mainly consisting of fluvial facies, channel framework sandstone, delta facies plain distributary channel sandstone, and underwater distributary channel sandstones of front sub-facies [14]. The reservoir lithology is gray-green medium-coarse lithic quartz sandstone, lithic sandstone, and quartz sandstone. The reservoir is a tight sandstone reservoir with a porosity of 8.8% and permeability of 0.38 × 10⁻³ μm2. Specifically, the He8 Member gas reservoir is a lenticular tight sandstone type with quasi-continuous distribution characteristics, including horizontal contiguous and vertical multilayer superposition [1, 9, 15]. There is no obvious edge or bottom water in the gas reservoir, and formation water is mostly stored and produced together with natural gas or distributed as an isolated lens body.
Databases
Gas saturation (Sg), porosity (Φ), and permeability (K) based on sealing corings from 10,252 samples of 23 wells were obtained. Core observations were recorded at 284.1 m from 15 wells. Thin sections and scanning electron microscopy data were collected from 152 images of 19 wells. The content of total organic carbon (TOC) of the source rocks from 25 wells was obtained. The vitrinite reflectance (Ro) of the source rocks was obtained from 46 samples in 16 wells. Gas test results were collected from 75 layers of 50 wells, whereas logging and well drillings were obtained from 50 wells. All of the collected data discussed earlier were obtained from the Research Institute of Exploration and Development of the Changqing Oilfield Company, PetroChina. The hydrocarbon generation intensity (HGI) of source rocks was calculated using previously established equations [15].
Results and Discussion
Distribution of Sg in the He8 Member
Longitudinal Distribution
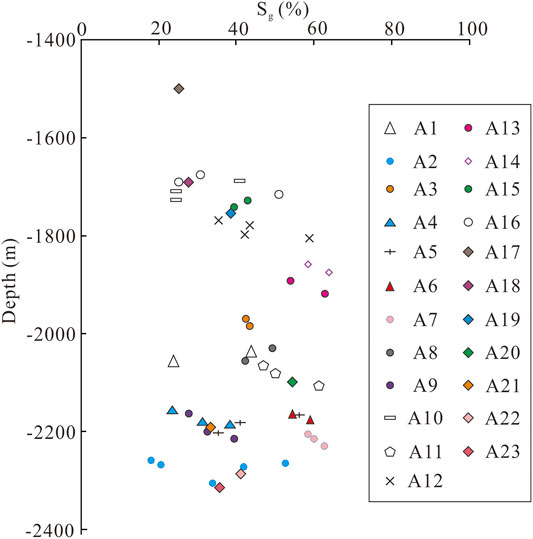
The Sg in the single sand body (N = 52) ranges from 17.9 to 63.8%, with an average of 41.9%. The main range is 30–45%, accounting for 45.1% of the total number of Sg (Figure 2). The Sg of the sand body gradually decreases from bottom to top (N = 52). The Sg in the lower section of the He8 Member ranges from 17.9 to 63.8% (N = 32), with an average of 42.4%. For the upper section, the Sg ranges from 27.8 to 58% (N = 20), with an average of 41.7%. Through the analysis vertically of single well (Figure 2), Sg data from two sets of sand body cores were obtained for 16 of the 23 wells, and the remaining seven wells were tested using single sand body cores. Of these 16 wells, 62.5% of them have sand bodies in which Sg increases as depth increases, whereas 25% have sand bodies in which Sg decreases as depth increases. The final 12.5% have sand bodies in which Sg does not change with depth.
Planar Distribution
The Sg of the He8 Member gradually decreases from southeast to west and north (Figure 1B). The Sg in the southeast, near wells A13 and A14, is the largest at more than 60%. Meanwhile, in the southwest, near Well A22, the Sg is less than 45%. In the northern area, near wells A4, A21, A17, and A18, the Sg is less than 35%.
Controlling Factors of Sg Distribution in the He8 Member
The Ro and HGI of the source rock, reservoir porosity, and permeability all control the Sg in stages. When the Ro, HGI, reservoir porosity, and permeability are less than 1.8%, 17 × 108 m3/km2, 10%, and 0.5 × 10⁻³ μm2, respectively, Sg increases significantly. When each parameter is greater than the above boundary value, the increase of Sg is not obvious.
Source Rocks Conditions
The lithology of the source rocks in the SGF is coal seams and dark mudstones from the Carboniferous Benxi Formation, the Permian Taiyuan Formation, to the Shan2 Member of the Shanxi Formation [9, 16, 17]. The cumulative thickness of the coal seams ranges from 0.4 to 27 m, with an average thickness of 8.8 m. The content of TOC ranges from 32.7 to 92.6%, with an average of 62.4%. The cumulative thickness of the dark mudstone is 5.2–99.4 m, with an average thickness of 34.9 m, and the content of TOC ranges from 0.85 to 12.68%, with an average of 3.69%. The macerals of the source rocks are mainly vitrinite, and the organic matter type belongs to type Ⅲ kerogen. The Ro ranges from 0.8 to 2.7%, with the main range of 1.1–2.2%. In the plane, it has the characteristics of high evolution degree in the east and south (over 2.2%) and low evolution degree in the north and west (less than 1.4%) (Figure 1B). The HGI of the source rocks ranges from 2 to 47 × 108 m3/km2, with an average of 16 × 108 m3/km2, with the primary distribution between 10×108 and 26 × 108 m3/km2.
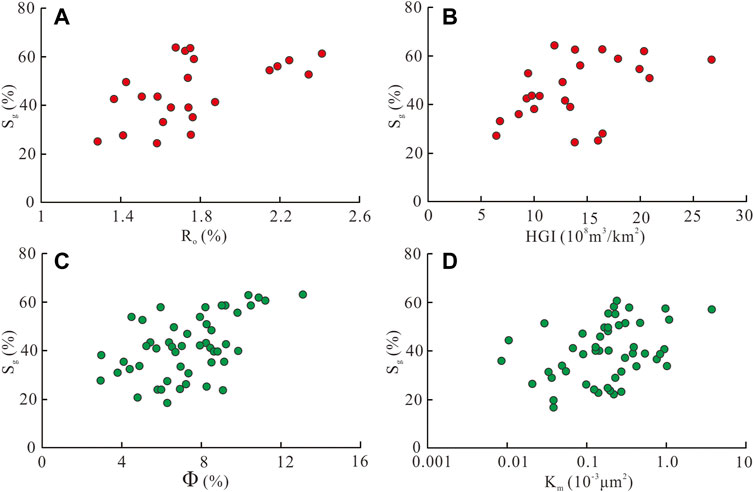
According to the relationships between the maximum Sg and Ro (Figure 3A), the Sg of the sand body increases as Ro increases, indicating that the Ro of the source rock controls the Sg. However, the controlling effect of the Ro is staged. The Sg increases significantly when Ro is less than 1.8%, and the controlling effect is significantly weakened when Ro is greater than 1.8%. According to the relationships between the maximum Sg and HGI (Figure 3B), the Sg of the sand body shows an increasing trend as the HGI increases, indicating that the HGI of the source rock controls the sandstone Sg. The Sg increases obviously when Ro is less than 17 × 108 m3/km2, and the controlling effect is obviously weakened when Ro is greater than 17 × 108 m3/km2.

FIGURE 3. Cross-plots of Sg and (A) Ro, (B) HGI of source rocks, (C) porosity, and (D) permeability of reservoir of He8 Member in SGF.
Reservoir Conditions
The reservoir porosity of the He8 Member ranges from 2.9 to 12.96%, with an average porosity of 7.3%. The median permeability of the sand bodies ranges from 0.01 × 10⁻³ to 13.05 × 10⁻³ μm2, with an average of 0.86 × 10⁻³ μm2. According to the relationships between sand body porosity and Sg (Figure 3C), the Sg increases as porosity increases. The controlling effect of the porosity is staged. The Sg increases significantly when the porosity is less than 10%; meanwhile, the Sg decreases as the porosity increases when the porosity is greater than 10%. According to the relationships between permeability and the Sg of the sand body (Figure 3D), the Sg increases significantly when the permeability is less than 0.5 × 10⁻³ μm2.
Gas-Bearing Distribution Patterns of Gas Reservoir in the He8 Member
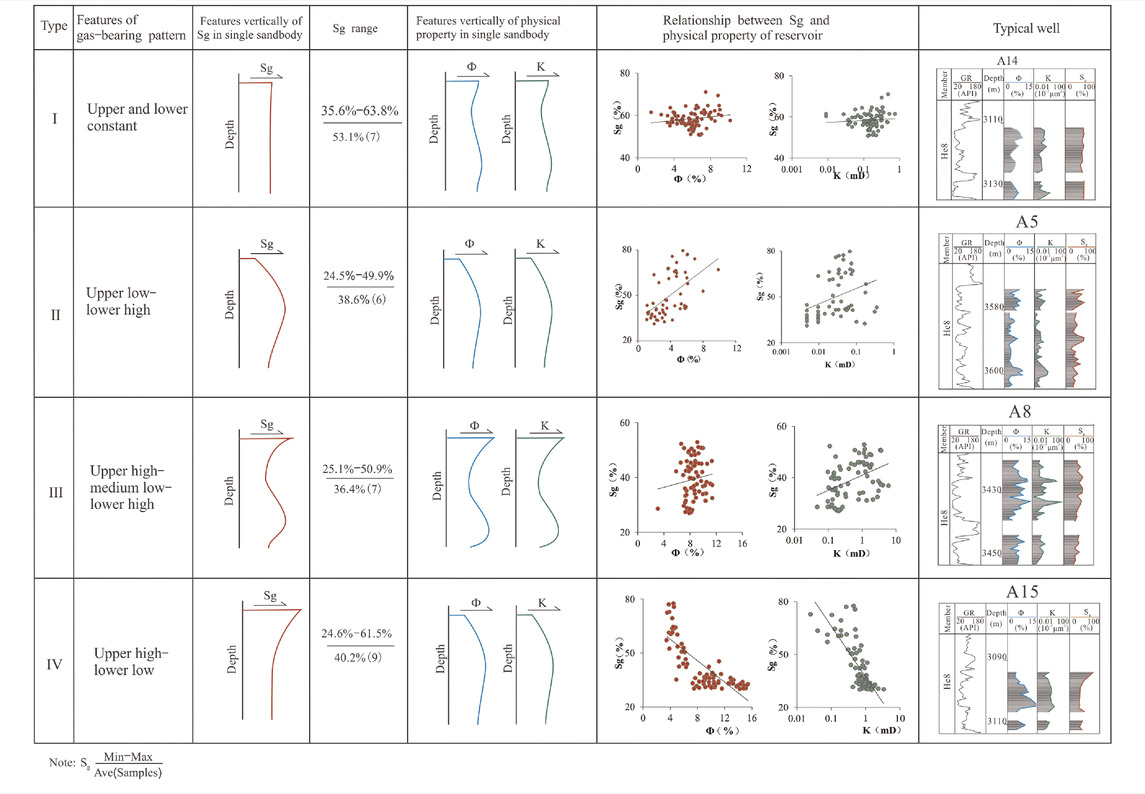
Four types of gas-bearing patterns can be established according to the distribution of Sg, reservoir porosity, and permeability of 29 series of sandstone from the 23 wells: “upper and lower constant,” “upper low–lower high,” “upper high–medium low–lower high,” and “upper high–lower low” (Table 1). The selected sandstone data contain over 30 points.
Upper and Lower Constant Type (Type Ⅰ)
The upper and lower constant type gas-bearing pattern indicates that a sand bodies' Sg is basically vertically constant and does not change with depth, porosity, or permeability (Table 1-I). This pattern is distributed in the southeast part of the SGF (Figure 1B), and its Sg is relatively high, with a distribution range of 35.6–63.8% (accounting for 24.1% of the total number of Sg) and an average of 53.1%. This pattern is primarily affected by the gas source charge intensity. Gas generated from high Ro and HGI of the source rocks is strongly charged in the tight sandstone. The formation water in the sandstone is displaced or evaporated under the temperature and pressure conditions, leaving only bound water, which results in a near-constant Sg. The gas layers corresponding to this gas-bearing pattern were mostly pure gas-producing layers. For example, the gas test of Well A14 is a pure gas-producing layer (Table 1A); the same is true for wells A13, A20, and A6.
Upper Low–Lower High Type (Type Ⅱ)
The upper low–lower high type gas-bearing pattern indicates that the Sg at the top of a sand body is low and gradually increases with depth (Table 1-II). This pattern is distributed in the central and southern regions of the SGF (Figure 1B), where the Sg ranges from 24.5 to 49.9%, accounting for 20.7% of the total, with an average of 38.6%. It is primarily affected by reservoir porosity and permeability. The Sg, porosity, and permeability all show the same amount of change, indicating that physical characteristics have a positive correlation to control the Sg. The HGI and Ro of the source rocks are moderate, which could displace free-flowing water. The formation water is mostly capillary water (Wang et al., 2012). The gas tests are mostly the gas–water layer and pure gas-producing layer. This can be seen in wells A5 (Table 1-II), A9, and A16.
Upper High–Medium Low–Lower High Type (Type Ⅲ)
The upper high–medium low–lower high type gas-bearing pattern indicates a high Sg at the top of a sand body. It first decreases, then increases as depth increases (Table 1-III). This pattern is also distributed in the southern and western regions of the SGF (Figure 1B), with Sg ranging from 25.1 to 50.9%, averaging 36.4%, and accounting for 24.1% of the total sand bodies. It should be noted that the boundary of the distribution area for this type is not clear in relation to type II. The variation trend of porosity and permeability is similar to that of Sg, and has a positive correlation control effect on Sg. The high Sg at the top of the pattern may be related to free water migration affected by the tectonic position. The HGI and Ro of the source rocks are moderate, which can help to displace some of the free water. The formation water type is mainly capillary water and free water, and the gas tests are mostly of the gas–water co-producing layer. This can be seen in wells A8 (Table 1-III) and A11.
Upper High–Lower Low Type (Type Ⅳ)
The upper high–lower low type gas-bearing pattern indicates that the Sg at the top of a sand body is high and gradually decreases (Table 1-IV). This pattern is distributed sporadically in the northern regions of the SGF (Figure 1B). The Sg ranges from 24.6 to 61.5%, averages 40.4%, and accounts for 31% of the total. Porosity and permeability both increase as depth increases, which is contrary to the trend of the Sg, indicating that porosity and permeability have negative correlations with Sg. The weaker HGI and Ro of the source rocks result in a lower gas charging power, thus displacing only a small amount of the free water. Under the buoyancy of free water in relatively good physical properties, the natural gas will migrate to the top, forming gas at the top and water at the bottom. The formation water type is mainly free water, and the gas tests are mostly water and gas-bearing water layers. For example, the Sg of the He8 Member from well A15 shows a significant downward trend from the top to bottom (Table 1-IV), whereas the sand bodies have good homogeneity, the porosity is between 4 and 16%, the permeability is between 0.05 × 10⁻³ and 3 × 10⁻³ μm2, and the Ro is approximately 1.45%. The perforated gas test in the middle of the sand body is the pure water layer.
Conclusion
The conclusions of this study are as follows:
1) The Sg increases with increasing Ro and HGI of the source rocks, reservoir porosity, and permeability. Moreover, the Ro and HGI of the source rocks, reservoir porosity, and permeability all control the Sg in stages. When Ro, HGI, reservoir porosity, and permeability are less than 1.8%, 17 × 108 m3/km2, 10%, and 0.5 × 10⁻³ μm2, respectively, Sg increases significantly. When each parameter is greater than the above boundary value, the change of Sg is not obvious.
2) Four types of gas-bearing patterns of tight sandstone can be observed according to the distribution of reservoir and source rock conditions: “upper and lower constant,” “upper low–lower high,” “upper high–medium low–lower low,” and “upper high–lower low.” The first type is mainly controlled by high maturity source rocks, the second by reservoir physical properties, the third by reservoir physical properties and structure, and the last by structure only. The corresponding gas test results are the pure gas, pure gas and gas–water, gas–water, and gas-bearing water and pure water layers, respectively.
Data Availability Statement
The original contributions presented in the study are included in the article/Supplementary Material, further inquiries can be directed to the corresponding author.
Author Contributions
WW: conceptualization, methodology, writing—original draft, writing—review and editing, and formal analysis. XW: supervision, validation, and conception. XZ: investigation, data statistics, and formal analysis. NL: data statistics and methodology. XL: conceptualization and software. JC: Software.
Funding
This study received support from the National Science and Technology Major Project of China (grant number 2016ZX05050), the Natural Science Foundation of Shaanxi Province (project number 2020JQ-767), and the Scientific Research Program funded by Shaanxi Provincial Education Department (program number 20JS128). The funders were not involved in the study design, the collection, analysis, or interpretation of data, the writing of this article, or the decision to submit it for publication.
Conflict of Interest
Authors XW and XZ were employed by Research Institute of Exploration and Development, PetroChina Changqing Oilfield Company. Author NL was employed by No.3 Gas Production Plant, PetroChina Changqing Oilfield Company. Authors XL and JC were employed by No.3 Oil Production Plant, PetroChina Changqing Oilfield Company.
The remaining authors declare that the research was conducted in the absence of any commercial or financial relationships that could be construed as a potential conflict of interest.
Publisher’s Note
All claims expressed in this article are solely those of the authors and do not necessarily represent those of their affiliated organizations or those of the publisher, the editors, and the reviewers. Any product that may be evaluated in this article, or claim that may be made by its manufacturer, is not guaranteed or endorsed by the publisher.
References
1. Zhao J, Li J, Cao Q, Bai Y, Wu W, Ma Y. Quasi-continuous Hydrocarbon Accumulation: an Alternative Model for the Formation of Large Tight Oil and Gas Accumulations. J Pet Sci Eng (2019) 174:25–39. doi:10.1016/j.petrol.2018.10.076
2. Zou C, Zhai G, Zhang G, Wang H, Zhang G, Li J, et al. Formation, Distribution, Potential and Prediction of Global Conventional and Unconventional Hydrocarbon Resources. Pet Exploration Dev (2015) 42(1):14–28. doi:10.1016/s1876-3804(15)60002-7
3. Sun LD, Zou CN, Jia AL, Wei YS, Zhu RK, Wu ST, et al. Development Characteristics and Orientation of Tight Oil and Gas in China. Pet Explor Dev (2019) 46(6):1015–26. doi:10.1016/s1876-3804(19)60264-8
4. Dai JX, Qin SX, Hu GY, Ni YY, Gan LD, Huang SP, et al. Major Progress in the Natural Gas Exploration and Development in since 1947 in China. Pet Explor Dev (2019) 45(6):1–10.
5. He JC, Yu HJ, He GH, Zhang J, Li Y. Natural Gas Development prospect in Changqing Gas Province of the Ordos Basin. Nat Gas Ind.B (2021) 41(8):23–33.
6. Du J, Zhu GH, Wu LF, Zhang ZH, Gao JX, Yu YJ, et al. “Multi-series and Quasi-Continuous” Tight Gas Accumulation Pattern and Giant Gas Field Exploration Practice in Linxing Area. Nat Gas Ind.B (2021) 41(3):58–71.
7. Dai JY, Li JT, Wang BG, Pan R. Distribution Regularity and Formation Mechanism of Gas and Water in the Western Area of Sulige Gas Field, NW China. Pet Explor Dev (2012) 39(5):524–9. doi:10.1016/s1876-3804(12)60076-7
8. Wang XM, Zhao JZ, Liu XS, Fan LY. Distribution of Formation Water in Tight sandstone Reservoirs of Western Sulige Gas Field, Ordos Basin. Oil Gas Geol (2012) 33(5):802–10. In Chinese.
9. Wu WT, Zhao JZ, Wei XS, Wang Y, Zhang J, Wu HY, et al. Evaluation of Gas-Rich “Sweet-spot” and Controlling Factors of Gas-Water Distribution in Tight sandstone Gas Provinces. In: An Example from the Permian He8 Member in Sulige Gas Province, central Ordos Basin. Northern China: Journal of Asian Earth Sciences (2022). doi:10.1016/j.jseaes.2022.105098
10. Archie GE. The Electrical Resistivity Log as an Aid in Determining Some Reservoir Characteristics. AMIE (1942) 146(1):54–62. doi:10.2118/942054-g
11. Sun JM, Wang KW, Li W. Development and Analysis of Logging Saturation Interpretation Models. Pet Explor Dev (2008) 35(1):101–7. in Chinese.
12. Zhang J, luo J, Xia Y, Hu WL, Zhang GD, He YC, et al. Limitation and Analysis and Modification of Archie Equation. Chinese J. Geophys. (2018) 61(1):311–22. in Chinese.
13. Zhang LH, Pan BZ, Li ZB, Mo XW, Xia ZL, Xu WL. New Three-Water Conduction Model and its Application in Evaluation of Low Porosity and Low Permeability Reservoir. Petrol Geophys Explor (2010) 45(3):431–5. in Chinese.
14. Yang H, Xi SL, Wei XS, Chen YC. Accumulation Theories of Large Tight sandstone Gas of Ordos Basin. Beijing: Sci. Press (2016). In Chinese.
15. Wu W, Chen M, Li N, Wang Y, Zhao J, Wei X. Characteristics of Coal-Measure Source Rock and its Controlling Effect on Gas-Water Distribution of Tight sandstone of He8 Member in Sulige Gas Province, Ordos Basin. Energy Exploration & Exploitation (2021) 39(5):1727–46. doi:10.1177/01445987211022440
16. Zhao J, Zhang W, Li J, Cao Q, Fan Y. Genesis of Tight Sand Gas in the Ordos Basin, China. Org Geochem (2014) 74:76–84. doi:10.1016/j.orggeochem.2014.03.006
Keywords: gas-bearing pattern, tight sandstone gas, gas saturation, Sulige Gas Field, ordos basin
Citation: Wu W, Wei X, Zhao X, Li N, Lu X and Chen J (2022) Controlling Factors of Gas-Bearing Properties in Permian Tight Sandstone Based on Sealing Corings, Sulige Gas Field, Ordos Basin, Northern China. Front. Phys. 10:833691. doi: 10.3389/fphy.2022.833691
Received: 12 December 2021; Accepted: 14 February 2022;
Published: 07 April 2022.
Edited by:
Wanqing Shen, Université de Lille, FranceReviewed by:
Lisong Zhang, China University of Petroleum, ChinaCongjun Feng, Northwest University, China
Copyright © 2022 Wu, Wei, Zhao, Li, Lu and Chen. This is an open-access article distributed under the terms of the Creative Commons Attribution License (CC BY). The use, distribution or reproduction in other forums is permitted, provided the original author(s) and the copyright owner(s) are credited and that the original publication in this journal is cited, in accordance with accepted academic practice. No use, distribution or reproduction is permitted which does not comply with these terms.
*Correspondence: Weitao Wu, d3R3dUB4c3l1LmVkdS5jbg==
 Weitao Wu
 Xinshan Wei3
