 Jinlei Huang1,2
 Bin Luo
 Bin Li
95% of researchers rate our articles as excellent or good
Learn more about the work of our research integrity team to safeguard the quality of each article we publish.
Find out more
ORIGINAL RESEARCH article
Front. Phys. , 25 May 2022
Sec. Optics and Photonics
Volume 10 - 2022 | https://doi.org/10.3389/fphy.2022.833278
This article is part of the Research Topic Application of Terahertz Frequency in Substance Detection and Recognition View all 9 articles
As an essential index to evaluate feed quality, feed moisture content which is too high or too low will impose an adverse impact on feed nutritional value. Therefore, the quantitative analysis of feed moisture content is significant. In this paper, the detection of feed moisture content based on terahertz (THz) and near-infrared (NIR) spectroscopy and data fusion technology of THz and NIR (THz-NIR) was investigated. First, feed samples with different water content (29.46%–49.46%) were prepared, and THz (50–3000 μm) and NIR (900–1700 nm) spectral data of samples was collected and preprocessed, and the feed samples were divided into correction set and verification set by 2:1. Second, the spectral data was fused through the head-to-tail splicing, and the feed moisture content prediction model was established combined with partial least squares regression (PLSR). Third, competitive adaptive reweighting sampling (CARS) was applied to extract spectral characteristic variables for feature layer fusion, and the feed moisture content prediction model in feature level was constructed combined with PLSR. Finally, the evaluation parameters validation set correlation coefficient (Rp), the root mean square error of prediction (RMSEP), and the residual predictive deviation (RPD) were employed to evaluate the prediction effect of the model. The results indicated that THz, NIR spectra, and data fusion technology could quickly and effectively predict feed moisture content. Among them, the characteristic layer spectral data fusion model achieved the optimal prediction effect while Rp, RMSEP, and RPD reached 0.9933, 0.0069, and 8.7386 respectively. In conclusion, compared with the prediction model established by single THz and NIR spectrum, THz-NIR spectrum data fusion could more accurately predict feed moisture content and provide certain theoretical and technical support for inspirations and methods for quantitative analysis of feed moisture content of livestock and poultry.
Moisture content is an essential index to evaluate feed quality, which is closely related to the calculation of various nutritional indexes[1]. On the one hand, the dry matter content could be obtained by detecting the moisture content. On the other hand, it is convenient to analyze other nutrients, which is of vital guiding significance to preventing the mildew and deterioration of the nutrients during the process of feed processing, transportation, and storage. According to GB/T 6435-2014 (China Standard), the standard method for feed moisture content is the dry method, which has high reliability but high energy consumption and low efficiency[2]. Modern detection of feed moisture methods includes Karl Fischer, moisture detector, and spectral technology. The spectral technology has the advantages of rapid detection, extensive applicability, and high sensitivity. Therefore, terahertz time-domain spectroscopy (THz-TDS), near-infrared (NIR) spectroscopy, and other spectral detection technologies have been developed rapidly.
THz-TDS acting as an emerging technology has the characteristic of fringerprint and sensitive to moisture content, and it can be applied to sense the moisture content of food and agricultural products. And they are applied to food production, safety inspection, materials science, military communications, biological medicine, and agricultural inspection products[3–6]. However, the cost is still high and difficult to assess real samples. Most samples are made into tablets. Compared with THz-TDS, NIRS is relatively mature and detection of real samples without any process for practical application. The feed assessment may carried out at an online or in situ mode.
Nowadays, limited studies have been conducted to detect feed moisture content utilizing spectral technology. In terms of quantitative analysis of moisture content of agricultural products, Zhang et al. collected NIR spectroscopy data of corn DDGS and combined it with partial least squares (PLS) to construct a quantitative analysis model of corn DDGS moisture content [7]. Zhang et al. applied Fourier transform infrared spectrometer to collect spectral data of corn samples and established a prediction model of moisture content of single corn seed based on random forest (RF)[8]. Lu et al. collected the NIR spectroscopy data of rice and established the PLS model of rice moisture content[9]. Wu et al. scanned the terahertz (THz) time-domain spectra of corn seed samples through attenuated total reflection (ATR) attachment and constructed a nonlinear model for efficient quantitative analysis of corn seed moisture by utilizing a support vector machine based on RBF kernel function and grid search method [10].
Some scholars have employed spectral data fusion technology to improve the accuracy of rapid detection. Generally, data fusion includes data-level fusion, feature-level fusion, and decision-level fusion[11–13]. Due to its ability to analyze complex system samples, data fusion technology is extensively applied to numerous fields. Li et al. investigated the feasibility of X-ray fluorescence (XRF), NIR, and mid-infrared (MIR) spectra data fusion to detect metal elements in the soil[14]. Among them, XRF-MIR spectral data fusion exhibited the optimal prediction effect (R2 = 0.98). The results demonstrated that XRF-MIR spectral data fusion could improve detection accuracy. Li et al. investigated the effective components of the deltamethrin formula utilizing spectral data fusion strategy[15]. Compared with feature-level fusion and single spectrum, data-level fusion possesses a better prediction ability (RMSEP = 0.0645%, R2 = 0.9978). This study provides a feasible method for pesticide quality control and field monitoring. Chen et al. fused ultraviolet (UV) and NIR spectrum data to build a quantitative prediction model of chemical oxygen demand (COD) concentration[16]. The results indicated that the feature level fusion model displayed the most accurate prediction performance (R2 = 0.9947, RMSEP = 0.976), implying that the spectral data fusion could reflect more chemical information of water samples and provide certain technical support for on-line monitoring of COD concentration in water. However, the fusion of THz and NIR spectral data (THz-NIR) has not been investigated.
In this paper, THz-NIR spectroscopy and two kinds of spectral data fusion were applied as the detection methods of feed moisture content. The main research contents are presented in Figure 1. First, the samples were prepared and their terahertz and near-infrared spectra were collected. Afterward, derivative Savitzky-Golay (SG) smoothing and normalization were applied to preprocess the original spectral data. Competitive adaptive reweighted sampling (CARS) was used to extract characteristic variables from spectral data. Data level fusion (LLDF) and feature level fusion (MLDF) were applied to fuse the preprocessed spectral data. Finally, based on the PLSR algorithm, a feed water content prediction model was established.
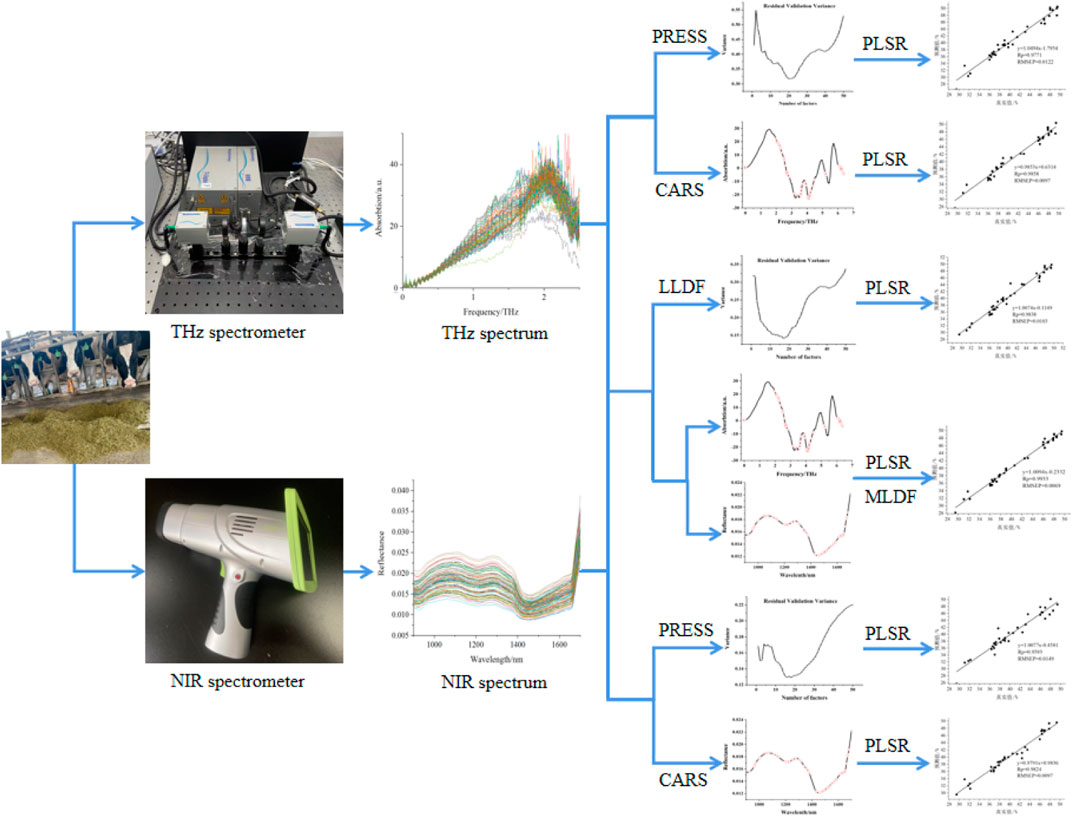
FIGURE 1. Flowchart of the experimental process.
In this experiment, the THz time-domain spectrometer (TERAK15, Menlo systems company, Germany) was utilized for THz spectrum measurement. The handheld NIR instrument (BIO_JHWGPY, independently developed by the Intelligent Equipment Technology Research Center of Beijing Academy of Agricultural and Forestry Sciences) was utilized for NIR spectrum measurement. Manual tablet press (Specac GS15011, United Kingdom) was employed for tablet pressing. Precision electronic balance (FA2004N, Shanghai Jinghai Instrument Co., Ltd., China) was used for weighing. The planetary mill (XQM-0.4L, Changsha Tianchuang Powder Technology Co., Ltd., China) was utilized for grinding. Electric blast drying oven (XMA-2000, Shanghai Jinmao Industrial Technology Co., Ltd., China) was applied to drying. The feed particle size was screened by a standard inspection sieve (60 and 100 mesh, Xiaojin Standard Sieve Factory, Shangyu City, Zhejiang Province, China).
The feed applied in this experiment was provided by a professional breeding cooperative in Beijing while Polyethylene powder (CAS 9002-88-4, particle size 40–48 μm) was purchased from Sigma Aldrich (Shanghai) Trading Co., Ltd. (United States).
The total sample preparation process proceeds as follows. First, the feed sample was fully ground. Second, the samples were screened until the particle size range was 0.154–0.280 mm. Third, 108 samples were humidified to different gradient moisture contents (29.46%–49.46%) and stored in sealed bags for subsequent use. Fourth, each sample was divided into three groups, i.e., 5 g, 5 g, and 100 mg weighed using a precision electronic balance for chemical value determination, THz spectrum (tableting required), and NIR spectrum collection respectively. Finally, the samples were mixed with polyethylene in equal amounts and pressed into flakes (4.0t external force and 4 min pressing time). The compressed samples had a diameter of 13 mm and a thickness of 1–2 mm. Sample manipulation is presented in Figure 2.
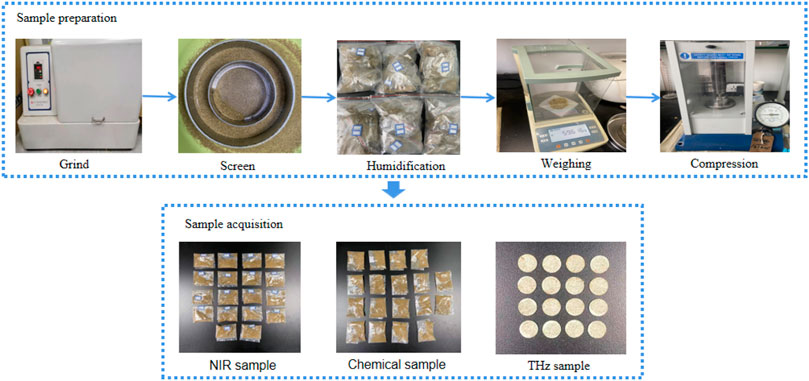
FIGURE 2. Sample manipulation.
According to GB/T 6435-2014 (China) determination of moisture in feed, the chemical value was obtained through the drying method.2 The statistical information of the chemical value of moisture content of 108 samples is presented in Table 1.

TABLE 1. Statistical information of moisture content of samples.
The THz spectrum data acquisition experiment was conducted in the transmission mode. Nitrogen needed to be added for drying to keep the relative humidity of the test environment below 3%. 108 tablet pressing samples were scanned and collected 3 times respectively. Each sample was taken out and reloaded each time. The spectrum and absorption coefficient of the sample was calculated via the built-in software TeraMat_v10.vi (Menlo systems company, Germany). THz spectrum acquisition is presented in Figure 3.
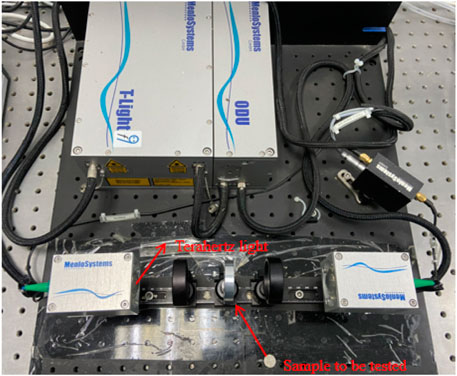
FIGURE 3. THz spectrum acquisition.
The NIR spectrometer number of scans is 32 times, the wavelength range is 900–1700 nm, and the working mode is diffuse reflection scanning. 108 samples were scanned and each sample was measured 3 times. Reload the sample for each measurement. The reflectance is determined by the instrument’s software Nirscan Nano GUI_boxed-shortcut (Beijing Academy of Agricultural and Forestry Sciences, China). NIR spectrum acquisition is presented in Figure 4.
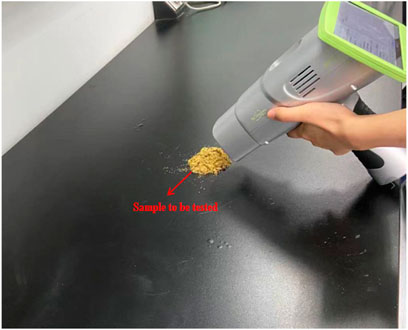
FIGURE 4. NIR spectrum acquisition.
In this experiment, MATLAB 2016a software (The MathWorks, America) was utilized for data processing while Origin 2018 software (OriginLab, America) was for drawing. First, derivative and SG smoothing was applied to preprocess the spectral data, thereby eliminating the spectral baseline drift and noise interference. Afterward, the spectral data was normalized to eliminate the influence caused by the different orders of magnitude between the two spectral data during fusion[17]. The sample set partitioning based on joint x-y distance (SPXY) was applied to divide the samples into correction set and verification set by 2:1 [18]. Finally, the spectral characteristic variables were selected by CARS algorithm.
In this experiment, to improve the effect of the feed moisture content prediction, a feed moisture content prediction model based on THz and NIR spectral data fusion was proposed. Figure 5 shows two different data fusion methods based on the THz-NIR spectrum.
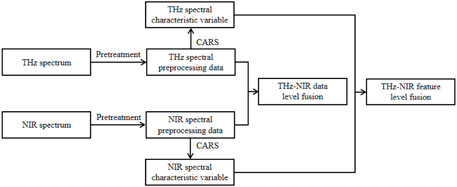
FIGURE 5. Fusion method.
In this study, PLSR was applied to establish a prediction model of feed moisture content. PLSR could realize multiple linear regression and principal component analysis simultaneously under one algorithm system. During the modeling process, PLSR considered the mutual influence of decomposition of the independent variable and dependent variable. Therefore, the use of PLSR for model construction could ensure the correlation between independent and dependent variables, thereby improving the predictive performance of the model.
To evaluate the performance of the prediction model, the root mean square error estimated by calibration (RMSEC), prediction (RMSEP), and correlation coefficient of calibration (Rc), prediction (Rp), and residual predictive deviation (RPD) were employed as evaluation indicators. A good model should have high Rc, Rp, and RPD values and low RMSEC and RMSEP values.
The THz and NIR spectra of 108 feed samples are presented in Figure 6. The abscissa is the frequency while the ordinate is the THz absorption in Figure 6A, and each spectrum has 1,023 values. As presented in Figure 6A, the absorption value increases first and then decreases with no obvious absorption peak. With the increase of frequency, the spectral lines begin to fluctuate, hence it is difficult to analyze the regular changes of the spectrum. To reflect the spectral characteristics of absorption, preprocessing is needed to eliminate noises and improve the spectral signal-to-noise ratio. The abscissa is the wavelength while the ordinate is NIR reflectance in Figure 6B, and each spectrum has 228 values. As presented in Figure 6B, the reflectance spectrum of the sample is smooth within the range of 900-1,700 nm with weak absorption peaks near 1,200 nm and 1,425 nm.
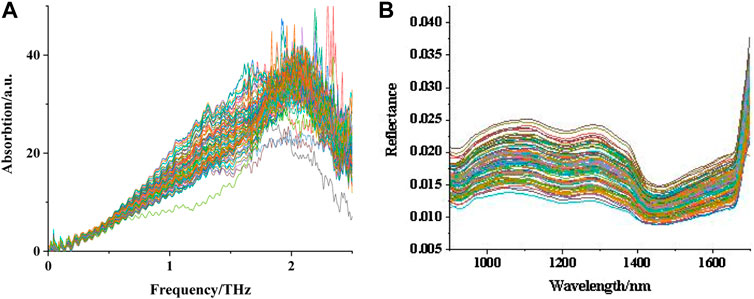
FIGURE 6. Spectrum information (A) THz Absorption spectrum; (B) NIR Reflectance spectrum.
The number of principal factors is closely related to the prediction accuracy of the model. If it is too small, the essential information of water content might not be reflected in the model, thus resulting in lower prediction accuracy. If it is too large, the noise of the model will become larger during the modeling process. In the present study, the result of the correction set is suitable, but the prediction accuracy of the model is poor due to the inclusion of more information in the prediction set. Therefore, it is essential to apply a reasonable number of principal factors to the modeling. Nowadays, the most extensively applied method to determine the number of principal factors is Prediction Residual Error Sum of Squares (PRESS). After the spectral data is preprocessed, the optimal number of factors is selected by comparing the sum of squares of prediction residuals obtained by interactive verification. The results are presented in Figure 7.
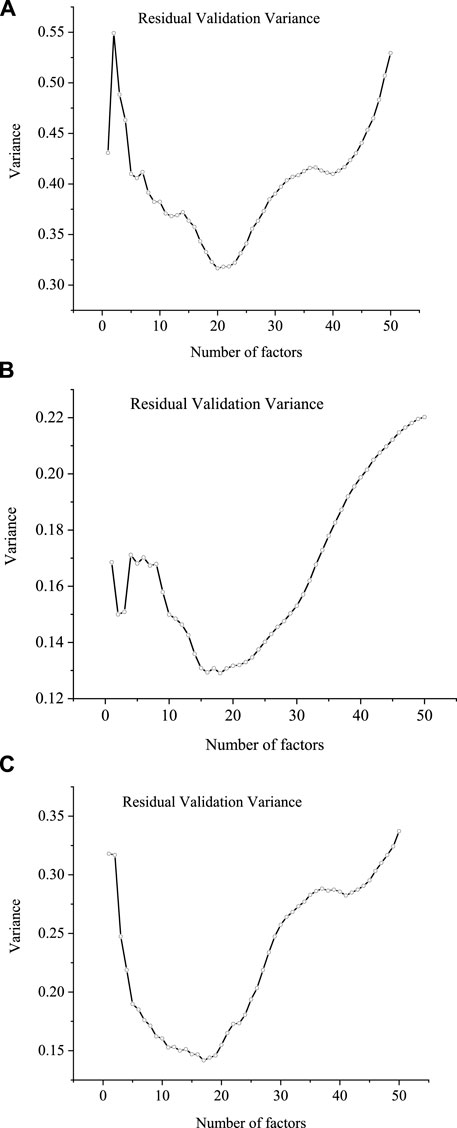
FIGURE 7. (A) THz principal factor; (B) NIR principal factor; (C) THz NIR principal factor.
As presented in Figure 7, when the number of principal factors of THz, NIR, and THz-NIR is 20, 18, and 17 respectively, the sum of squares of prediction residuals obtained from interactive verification is the lowest. Therefore, the respective optimal number of principal factors is selected for the construction of the model. The comparison of the results of PLSR model establishment is presented in Table 2.
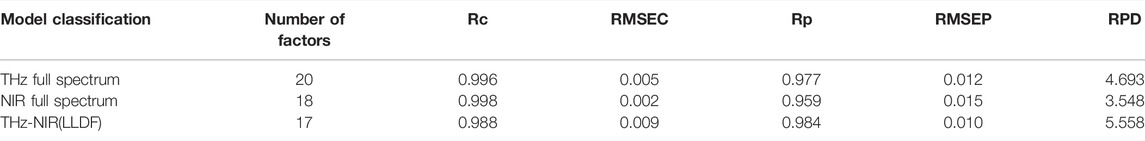
TABLE 2. Results of PLS model establishment.
It could be seen from Table 2 that RMSEC and RMSEP of the single spectrum prediction model are quite different. The prediction results of both THz and NIR full spectrum models are not accurate. The Rc of THz and NIR full spectrum models is 0.996 and 0.998 respectively while the RMSEC of them is sufficiently low, which is 0.005 and 0.002 respectively. However, the prediction accuracy of the single spectrum data model is not high with Rp being 0.977 and 0.959 respectively, and the difference between single spectrum prediction model RMSEC and RMSEP is large, implying that the prediction accuracy is not high enough and the model is unstable. Compared with the single spectral model, the Rc and Rp of the THz-NIR data layer fusion model reach 0.988 and 0.984 respectively, and its RMSEC and RMSEP being 0.009 and 0.010 respectively are relatively low, between which the difference is small. The prediction accuracy of the THz-NIR data-level fusion model is high and the model is relatively stable, implying that the prediction accuracy of the data-level fusion model is remarkably improved compared with the single spectral prediction model. Its prediction accuracy is verified by the verification set experiment, as presented in Figures 8A,B, in Figure 8C, the overall samples of models a and b are evenly distributed and concentrated near the centerline, which indicates that the predicted value of the model approaches the real value and the model is also relatively stable.
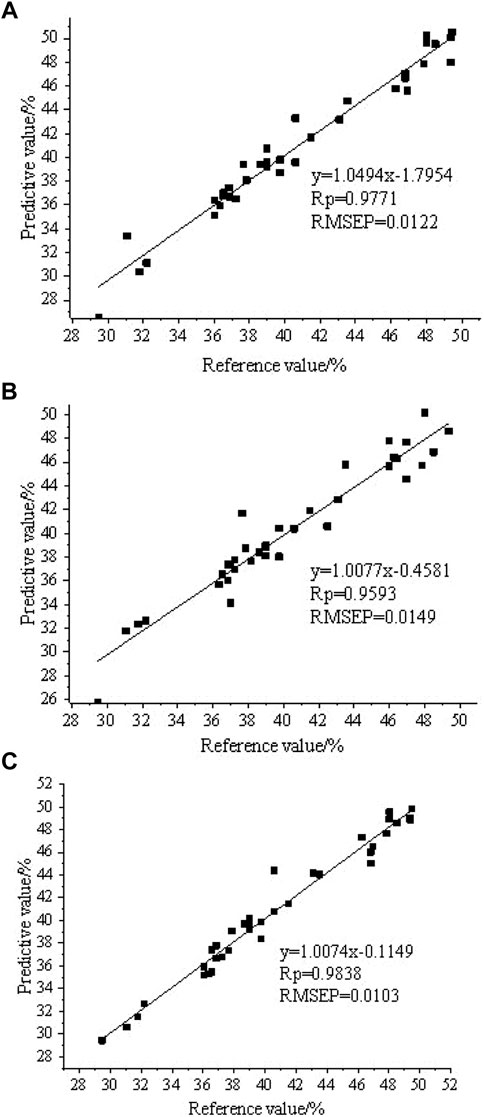
FIGURE 8. (A) THz fitting; (B) NIR fitting; (C) THz-NIR fitting.
Based on the importance level of each wavelength, CARS selects n wavelength subsets from N Monte Carlo (MC) samples iteratively and competitively. In each sampling, a fixed proportion of samples is randomly selected to establish the calibration model. Afterward, based on the regression coefficient, two steps of forced wavelength selection based on exponentially decreasing function (EDF) and competitive wavelength selection based on adaptive reweighting sampling (ARS) are conducted to select the key wavelength. Finally, cross-validation (CV) is applied to select the subset with the smallest CV root mean square error (RMSECV). The flow chart of the CARS algorithm is presented in Figure 9.
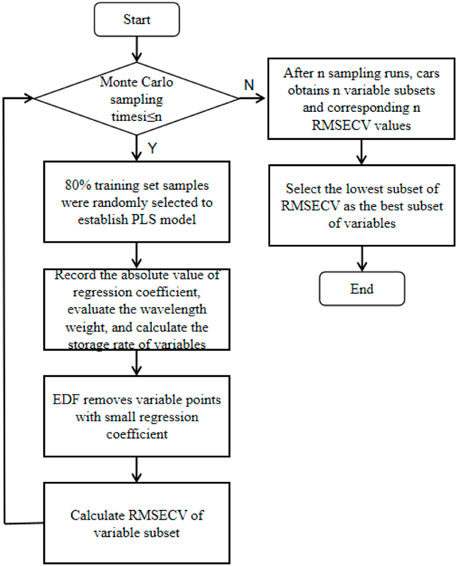
FIGURE 9. CARS algorithm process.
Through 50 MC iterations sampling, 80% of the samples in the correction set are randomly selected each time to establish the PLSR model. ARS is applied to screen the wavelength variables, and the lowest subset of RMSECV of the model is selected by a 10-fold interactive test. The process of selecting the optimal variables for THz spectrum and NIR spectrum data is presented in Figures 10, 11 respectively.

FIGURE 10. (A) Number of THz sampling variables; (B) THz RMSECV; (C) THz regression coefficient.
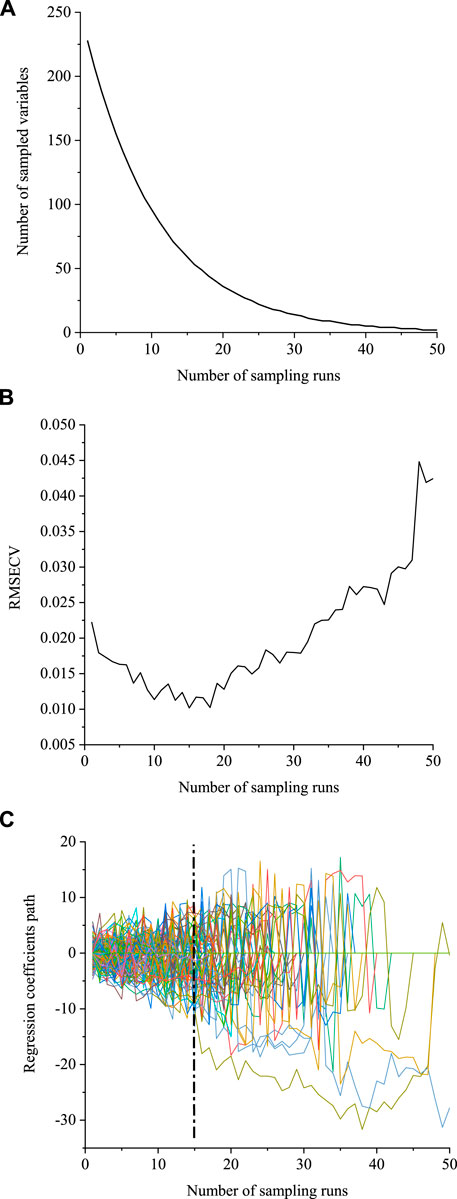
FIGURE 11. (A) Number of NIR sampling variables; (B) NIR RMSECV; (C) NIR regression coefficient.
Figure 10 presents the trend of the number of sampling variables (Figure 10A), RMSECV value (Figure 10B), and regression coefficient path of each variable (Figure 10C) with the increase of sampling times. As the number of runs increases, the number of optimized wavelength variables gradually decreases (Figure 10A). The number of sampling variables decreases rapidly at the first stage of EDF while at the second stage of EDF, it decreases very slowly, which indicates that the proposed two-stage selection, i.e., fast selection and fine selection, is realized in CARS. During the process of 1–24 sampling, the RMSECV value continuously decreases, implying that the variables removed during the screening process are not related to the water content. After 24 samplings, the RMSECV value shows an upward trend, which implies that the essential variables related to the water content are removed, thus resulting in the rise of the RMSECV value (Figure 10B). As presented in Figure 10C, when the number of samples is small, the absolute value of the regression coefficient of each wavelength is small. With the increase of the number of samples, the coefficients of some wavelengths become larger while those of other wavelengths become smaller. In particular, when the corresponding wavelengths are eliminated by CARS, the coefficient will drop to zero because they are not selected. Therefore, the larger the absolute coefficient, the greater the possibility of survival of the corresponding wavelength. The selection mechanism of CARS resembles “the survival of the fittest” in Darwin’s theory of evolution. Each wavelength could be regarded as an individual, and all the other wavelengths are naturally regarded as its “environment”. Based on this, the CARS algorithm uses adaptive reweighted sampling technology to realize the most suitable individual selection process. In general, in Figure 10, when the number of samples reaches 24, the RMSECV value reaches the minimum and the corresponding subset of spectral variables is the optimal (the position corresponding to the dotted line in Figure 10C), which contains 55 spectral variables. In Figure 11, as the number of runs increases, the number of optimized wavelength variables gradually decreases (Figure 11A). When the number of samples is 15, the RMSECV value reaches the minimum (Figure 11B), and the corresponding subset of spectral variables is the optimal (the position corresponding to the dotted line in Figure 11C), which contains 53 spectral variables. After the CARS wavelength optimization, the number of variables screened by THz is 55 frequency points, as presented in Figure 12A. The number of variables screened by NIR is 53 wavelength points, as shown in Figure 12B.
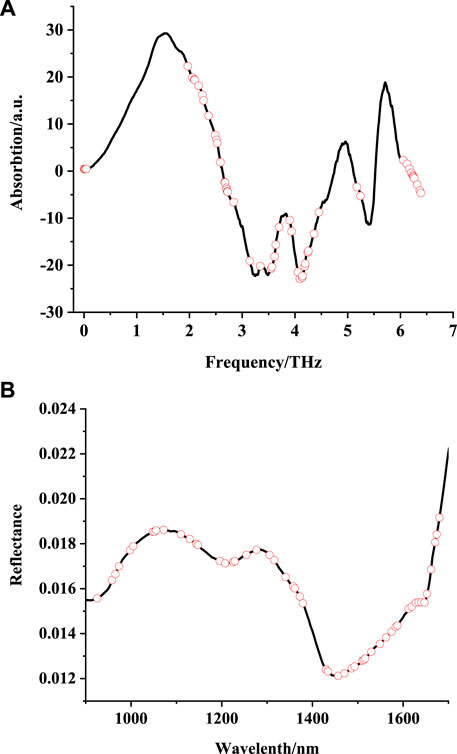
FIGURE 12. (A) THz characteristic variable distribution; (B) NIR characteristic variable distribution.
Among them, the spectral variable of the THz spectrum optimized by CARS is only 5.4% of the full spectrum, implying that CARS wavelength optimization could simplify the model. The THz and NIR characteristic variables optimized by CARS are fused as the independent variables while the real value of feed moisture content is the dependent variable of the model. The feed moisture content prediction model is established by PLSR. The Rc and RMSEC of the correction set are 0.994 and 0.006 respectively while the Rp and RMSEP of the verification set are 0.993 and 0.007 respectively. In comparison, the PLSR model (short for THz characteristic variable model and NIR characteristic variable model) is established with the respective characteristic variables of THz and NIR optimized by CARS as independent variables and the real value of feed moisture content as the dependent variable. The comparison of model evaluation indexes of the correction set and the prediction set is presented in Table 3.
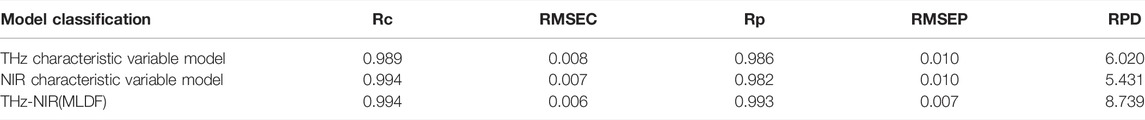
TABLE 3. Comparison of model evaluation indexes.
As indicated in Table 3, the Rp, RMSEP, and RPD of THz characteristic variable model established through CARS characteristic variable optimization are 0.986, 0.010, and 6.020 respectively while the RP, RMSEP, and RPD of THz full spectrum prediction model are 0.977, 0.012 and 4.693 respectively. The RPD values of the full spectrum model and characteristic variable model exceed 3, implying that both of them could better quantitatively predict feed moisture content. However, the THz characteristic variable model uses only 5.4% of the full spectrum variables to achieve better prediction results than the full spectrum model, and the difference between RMSEC and RMSEP is smaller, implying that the THz characteristic variable model is more stable than the full spectrum model. After the optimization of CARS characteristic variables, the values of Rp, RMSEP, and RPD of the NIR characteristic variable model are also higher than those of the NIR full spectrum model. This demonstrates that the full spectrum model contains a large amount of redundant information, which will exert a negative impact on the prediction ability of the feed moisture content model, and the CARS characteristic variable optimization will select the characteristic variables related to feed moisture to optimize the model. The Rp, RMSEP, and RPD scores of the THz-NIR feature level data model reach 0.993, 0.007, and 8.739. The prediction effect is not only better than the model established using single spectral feature data, but also has higher prediction accuracy and stability than the data-level fusion model. The Rp, RMSEP, and RPD of the feature layer fusion model are 0.96%, 49.28%, and 36.40% higher than those of the data layer fusion model. This indicates that the THz-NIR model based on feature level data fusion could achieve the optimal prediction effect in the detection of feed moisture content in this experiment. The prediction results of the model established by the preferred characteristic variables of the CARS algorithm are presented in Figures 13A,B, in Figure 13C, the overall samples in models a and b are evenly distributed and concentrated near the centerline, implying that the predicted value of the model approaches the measured value, and the model is relatively stable.
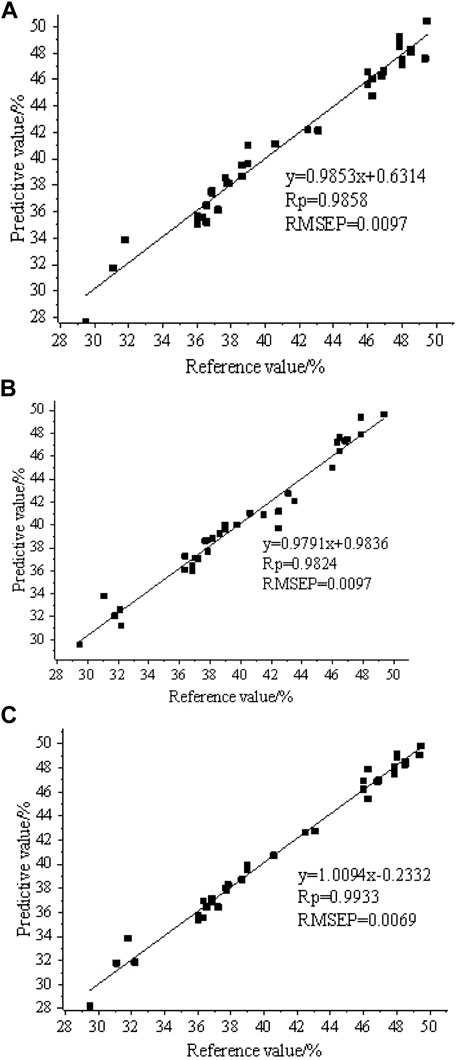
FIGURE 13. (A) THz characteristic variable fitting; (B) NIR characteristic variable fitting; (C) THz NIR characteristic variable fitting.
In this paper, the moisture content of the feed was quantitatively analyzed based on THz and NIR spectroscopy. On this basis, the prediction effects of single spectral modeling (THz and NIR) and two fusion strategy modeling (LLDF and MLDF) were analyzed step by step. The characteristic variables were selected by the CARS algorithm, and the prediction model was established by PLSR. The major conclusions are as follows.
1) The prediction model of feed moisture content was established by THz and NIR spectroscopy combined with PLSR, and the prediction effect of THz and NIR spectroscopy on feed moisture content was analyzed. The results indicate that the Rp, RMSEP, and RPD of the THz optimal prediction model are 0.986, 0.010, and 6.020 respectively, and the Rp, RMSEP, and RPD of the NIR optimal prediction model are 0.982, 0.010, and 5.431 respectively. It is demonstrated that THz and NIR spectroscopy could quickly and effectively predict feed moisture content.
2) CARS optimal selection of characteristic variables could improve the prediction ability of the model. Compared with the full spectrum model, the Rp, RMSEP, and RPD of THz spectral characteristic variables prediction model increase by 0.88%, 25.77%, and 22.05% respectively, and those of the NIR spectral characteristic variable prediction model increase by 2.35%, 53.61%, and 34.67% respectively.
3) THz and NIR spectral data was fused by data level fusion technology, and the feed moisture content prediction model was established. The prediction effects of THz, NIR, and data layer fusion technology on feed moisture content were analyzed and compared. The results indicate that the Rp, RMSEP, and RPD of the data level fusion prediction model are 0.984, 0.010, and 5.558 respectively, and the prediction ability is better than THz and NIR full spectrum prediction models.
4) THz and NIR spectral characteristic variables were fused by feature level fusion technology, and the feed moisture content prediction model was constructed. The prediction effects of THz, NIR, and feature level fusion technology on feed moisture content were analyzed and compared. The results indicate that the Rp, RMSEP, and RPD of the feature-level fusion prediction model are 0.993, 0.007, and 8.739 respectively. The prediction effect is better than not only the THz and NIR feature variable prediction model but also the data-level fusion prediction model.
The results indicate that feature-level data fusion is the most effective method to establish a quantitative analysis model of feed moisture content. In general, the spectral data fusion combined with the CARS algorithm to select characteristic variables is a feasible and effective quantitative analysis method for feed moisture content. This method provides the theoretical basis and technical support for the quantitative analysis of feed moisture content, which could be used as a reference for the establishment of new methods for online or in situ practical detection applications.
The raw data supporting the conclusion of this article will be made available by the authors, without undue reservation.
All authors listed have made a substantial, direct, and intellectual contribution to the work and approved it for publication.
The authors declare that the research was conducted in the absence of any commercial or financial relationships that could be construed as a potential conflict of interest.
All claims expressed in this article are solely those of the authors and do not necessarily represent those of their affiliated organizations, or those of the publisher, the editors and the reviewers. Any product that may be evaluated in this article, or claim that may be made by its manufacturer, is not guaranteed or endorsed by the publisher.
1. Huang Z. X., Wang J. E. Study on Rapid Determination Method of Moisture Content in Feed. Heilongjiang Anim Sci Vet Med (2018)(9) 219–21.
2. Pomeranz Y, Meloan C. E., Gb/T 6435, 2014, Determination of Moisture in Feeds[S], Springer: Boston, MA.doi:10.1007/978-1-4615-6998-5_34
3. Melinger JS, Laman N, Grischkowsky D. The Underlying Terahertz Vibrational Spectrum of Explosives Solids[J]. Appl Phys Lett (2008) 93(1):11102–11102. doi:10.1063/1.2949068
4. Ferguson B., Zhang X. C. Materials for Terahertz Science and Technology. Nat Mater (2002) 1(1):26–33. doi:10.1038/nmat708
5. Federici J., Moeller L. Review of Terahertz and Subterahertz Wireless Communications[J]. J Appl Phys, 2010, 107(11):6–323.doi:10.1063/1.3386413
6. Yuefang Hua Y., Hongjian Zhang H., Hongliang Zhou H. Quantitative Determination of Cyfluthrin in N-Hexane by Terahertz Time-Domain Spectroscopy with Chemometrics Methods. IEEE Trans Instrum Meas (2010) 59(5):1414–23. doi:10.1109/tim.2010.2041020
7. Zhang S, Song T, Zheng YH, Guo LJ, Zhang FP. A Study on Fast Assessment of Corn DDGS Nutrient Composition by Fourier Transform Near Infrared Spectroscopy[J]. China Feed (2021)(3) 71–7.
8. Zhang L, Wu JZ, Li JB, Liu CL, Sun XR, Yu L. Rapid and Non-destructive Determination of Moisture Content of Single Maize Seed by Near Infrared Spectroscopy Based on Random Forest[J/OL]. J Chin Cereals Oils Assoc 1-12. 2021.
9. Lu H, Peng BQ, Feng XY, Shen XF. Model Optimization for Determination of Amylose,Protein,Fat and Moisture Content in Rice by Near-Infrared Spectroscopy[J]. China Rice (2020) 26(6):55–9+63.
10. Wu JZ, Li XQ, Sun LJ, Liu CL, Sun XR, Sun M, et al. Study on the Optimization Method of Maize Seed Moisture Quantification Model Based on THz-ATR Spectroscopy[J]. Spectrosc Spectral Anal (2021) 41(7):2005–11.
11. Li Y, Zhang JY, Wang YZ. FT-MIR and NIR Spectral Data Fusion: a Synergetic Strategy for the Geographical Traceability of Panax Notoginseng. Anal Bioanal Chem (2017) 410(1):91–103. doi:10.1007/s00216-017-0692-0
12. Jiang C., Liu Y., Qu H. Data Fusion Strategy Based on Near Infrared Spectra and Ultraviolet Spectra for Simultaneous Determination of Ginsenosides and Saccharides in Chinese Herbal Injection. Anal Methods (2013) 5:4467–75. doi:10.1039/c3ay26540d
13. Silvestri M., Bertacchini L., Durante C., Marchetti A., Salvatore E., Cocchi M. Application of Data Fusion Techniques to Direct Geographical Traceability Indicators. Analytica Chim Acta (2013) 769:1–9. doi:10.1016/j.aca.2013.01.024
14. Li F, Xu L, You TY, Lu AX. Measurement of Potentially Toxic Elements in the Soil through NIR, MIR, and XRF Spectral Data Fusion[J]. Comput Electro Agric (2021) 187.106257 doi:10.1016/j.compag.2021.106257
15. Li Q., Huang Y., Zhang J., Min S. A Fast Determination of Insecticide Deltamethrin by Spectral Data Fusion of UV-Vis and NIR Based on Extreme Learning Machine. Spectrochim Acta A Mol Biomol Spectrosc (2020) 247:119119. doi:10.1016/j.saa.2020.119119
16. Chen Y, Xu YM, Di YJ, Cui XN, Zhang J, Zhou XD, et al. COD Concentration Prediction Model Based on Multi-Spectral Data Fusion and GANs Algorithm[J]. Spectrosc Spectral Anal (2021) 41(1):188–93.
17. He W. M., Hu H. R. Rapid Prediction of Different Wood Species Extractives and Lignin Content Using Near Infrared Spectroscopy[J]. J Wood Chem Tech (2013) 33:51-64. doi:10.1080/02773813.2012.731463
Keywords: terahertz, near-infrared, spectral fusion, detection technology, moisture content
Citation: Huang J, Luo B, Cao Y, Li B, Qian M, Jia N and Zhao W (2022) Fusion of THz-TDS and NIRS Based Detection of Moisture Content for Cattle Feed. Front. Phys. 10:833278. doi: 10.3389/fphy.2022.833278
Received: 11 December 2021; Accepted: 25 April 2022;
Published: 25 May 2022.
Edited by:
Mohamed Swillam, American University in Cairo, EgyptReviewed by:
Xudong Sun, East China Jiaotong University, ChinaCopyright © 2022 Huang, Luo, Cao, Li, Qian, Jia and Zhao. This is an open-access article distributed under the terms of the Creative Commons Attribution License (CC BY). The use, distribution or reproduction in other forums is permitted, provided the original author(s) and the copyright owner(s) are credited and that the original publication in this journal is cited, in accordance with accepted academic practice. No use, distribution or reproduction is permitted which does not comply with these terms.
*Correspondence: Bin Li, TGliQG5lcmNpdGEub3JnLmNu; Mengbo Qian, cWlhbm1lbmdib0B6YWZ1LmVkdS5jbg==
Disclaimer: All claims expressed in this article are solely those of the authors and do not necessarily represent those of their affiliated organizations, or those of the publisher, the editors and the reviewers. Any product that may be evaluated in this article or claim that may be made by its manufacturer is not guaranteed or endorsed by the publisher.
Research integrity at Frontiers
Learn more about the work of our research integrity team to safeguard the quality of each article we publish.