 Esteban Vazquez-Hidalgo1
 Carly M. Farris
 Amy C. Rowat
 Parag Katira
95% of researchers rate our articles as excellent or good
Learn more about the work of our research integrity team to safeguard the quality of each article we publish.
Find out more
ORIGINAL RESEARCH article
Front. Phys. , 18 February 2022
Sec. Biophysics
Volume 10 - 2022 | https://doi.org/10.3389/fphy.2022.831776
This article is part of the Research Topic Multiscale Soft Tissue Biomechanics and Cell Mechanobiology: Towards Coupling Extracellular Biophysical Cues and Cellular Function View all 6 articles
Cellular traction forces that are dependent on actin-myosin activity are necessary for numerous developmental and physiological processes. As traction force emerges as a promising cancer biomarker there is a growing need to understand force generation in response to chemical and mechanical cues. Our goal is to present a unified modeling framework that integrates actin-myosin activity, substrate stiffness, integrin bond type, and adhesion complex dynamics to explain how force develops under specific conditions. Our simulation results show that substrate stiffness and number of myosin motors contribute to the maximum actin-myosin forces that can be generated but do not solely control the force transmitted by the cells to the surface, i.e., the traction force. The kinetics of the bonds between the cell and the substrate plays an equally important role. Overall, we find that while the cell can generate large actin-myosin forces in individual stress fibers (
Cellular traction forces that are dependent on actin-myosin activity are necessary for numerous developmental and physiological processes [1]. Traction forces also contribute to undesired pathological states such as cancer metastasis [2–4]. Metastatic cancer cells generate larger traction forces, are more motile, and more invasive relative to their non-metastatic counterparts [3]. As traction force emerges as a promising cancer biomarker [5], there is a further need to understand force generation in response to chemical and mechanical cues. Here, with the help of computational, physics based models we aim to understand how much force a cell can really generate and what are the factors that limit this force. We are interested in the effects of four key components in traction force generation: number of active myosin motors, substrate stiffness, cell substrate adhesion dynamics, and mechanical reinforcement at adhesion complex.
The number of active motors can be controlled by biochemical signals that activate myosin light chain 2 (MLC2) phosphorylation. Number of active motors has been shown to alter force-velocity relationship [6–9]. While force generation is myosin dependent, force magnitude depends on other factors. Substrate stiffness has been shown to be an important parameter in cellular force generation. Stiffer substrates increase traction force [10–13]. Substrate stiffness also regulates the degree of cell-substrate adhesion and the size of the adhesion complex [14, 15]. Cells anchor to the substrate with adhesions ranging from 200 nm2 to
We show stall force magnitude, the maximum force an actin-myosin contractile unit can generate and sustain without slipping, increases with actin-myosin activity and substrate stiffness. We also show that this max force is rarely achieved in contracting epithelial cells as the integrin bonds coupling actin-myosin to substrate break at far lower forces. Integrins with catch-slip bonds generate greater forces than slip bonds. Bond lifetimes for both slip and catch-slip integrins decrease with increasing actin-myosin activity and substrate stiffness. For these results, we focus on integrins attached so single actin-myosin filaments. Next, we probe how talin-mediated dynamics alter cellular force generation. Force dependent unravelling of talin can add additional actin-myosin filaments (recruitment) or cause talin branching to bind additional integrins (branching). Traction stress for catch-slip bonds with and without recruitment and branching exhibit biphasic or sigmoidal behavior that is dependent on the combination of myosin activity and substrate stiffness. Adhesion size, defined by the number of integrins actively contributing to traction stress, decreases with actin-myosin activity and substrate stiffness, however this is not a limiting factor in traction stress generation.
To understand how much force a cell can generate, we assume that traction stress, the force per unit area, is generated by actin-myosin filaments attached to integrin receptors [32–34]. We simulate a predefined adhesion plaque with a density of 100 integrins per 1 μm2 [35, 36]. The adhesion plaque is a 10 × 10 grid representing 100 integrins precomplexed with talin and vinculin [37]. Talin is necessary to activate integrin [38–41] and does so by binding to integrin’s cytosolic domain [42]. Furthermore, talin’s force dependent unfolding is used to attach more filaments or integrins (Figure 1A). There are 100 actin-myosin filaments that are 3 μm [43] long, each containing 60 myosin motors [44–47]. Filaments bind to talin via vinculin [48–50].
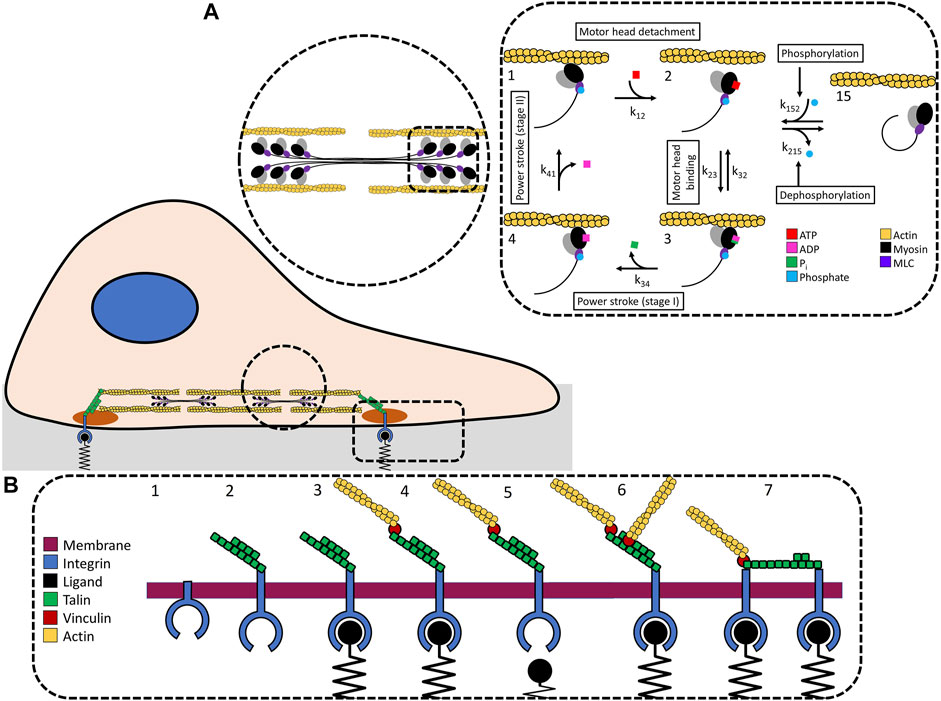
FIGURE 1. (A) We use a stochastic model of the actin-myosin crossbridge cycle. The force generated by myosin motors interacting and stepping along actin filaments. Force is transmitted to the integrins attached to the adhesion plaque. (B) Integrin dynamics: 1) Deactivated integrin. 2) Integrin activates when talin binds to integrins intracellular domain. 3) This activates the extracellular domain and allows it to bind to substrate ligands. 4) Once attached to the substrate, vinculin and actin-myosin filaments attach to talin. The force is transmitted to integrin. 5) If the force is too great, the integrin-substrate bond will break. If the applied force does not break the integrin-substrate bond it is possible for talin to 6) recruit additional actin-myosin filaments via vinculin binding, or 7) branch to a neighboring integrin.
The forces we are investigating originate from myosin binding and pulling along the actin filaments. We use a stochastic model of the myosin crossbridge cycle [51–53] modified with non-muscle myosin II transition rate parameters [54] to capture ATP hydrolysis, actin-myosin binding, conformational changes, and detachment (Figure 1B) [55, 56]. Simulations are performed using a timestep (Δt) of 1 ms. We model individual myosin motor head state changes stochastically, limiting individual motors to a single state change per timestep. Myosin binding sites on actin filaments are spaced by a fixed distance, bsd. Actin-myosin binding occurs when a myosin head is aligned to a binding site. Myosin undergoes thermal fluctuations that affects its ability to reach available binding sites. The distance is calculate based on the assumption that the potential energy of the myosin head is equal to the average unidirectional translational kinetic energy from the Boltzmann distribution, PE = ⟨KE⟩ where
and
The thermal fluctuation distance, d, that myosin can extend from its current position is
where, km is the stiffness of the myosin motor stalk, defined below, kB is the Boltzmann constant, and T is the temperature. Thus, a free ADP bound myosin head can bind to its respective actin filament if there is a binding site within this distance bsd ± d from myosin’s equilibrium position. The distance the myosin head has traveled away from it’s equilibrium unbound position to bind to the actin filament sets the initial strain, ϵ, in the myosin stalk, the coil-coiled region of the myosin tail that is not part of the thick filament [57]. The strain in the motor stalk, ϵ, is positive when strained in the direction that actin filament is actively sliding in along the myosin fibers. However, this strain in the myosin stalk/tail segment generates a force that opposes the sliding (Supplementary Figure S7).
Myosin state changes are calculated from the transition rates. The forward transition rates are k12, k23, k34, and k41 with k23 representing ATP hydrolysis and myosin head binding to actin. ATP hydrolysis and myosin binding to actin is a reversible process dependent on the ATP and ADP with k32 representing the reverse transition rate from state 3 to state 2. The crossbridge model consists of 4 states (state 1 through state 4) with respective transition rates from the current state, i, to the next state, j. Each motor state is independently updated during each time step. State transition rates follow the form kij.
Myosin dependent forces are regulated in part by the number of active myosin. We assume that only myosin with phosphorylated MLC2 can enter the crossbridge cycle and interact with the actin. Myosin that is not phosphorylated or that is dephosphorylated–phosphorylation being reversible–do not participate in the crossbridge cycle. Inactive myosins transition to state 15 from state 2 [58], modifying the 4-state cycle to a 5-state cycle [59]. Phosphorylation and dephosphorylation rates, k215 and k152 respectively, represent the transition rates from phosphorylated to dephosphorylated states. We define the ratio of phosphorylated MLC2 (ppMLC2) to non-phosphorylated MLC2 (MLC2) as
where the phosphorylation ratio is the input parameter that modifies MLC2 phosphorylation.
Transition rates where the motor is bound to actin (states 1 and 3) are modified by strain in the motor’s stalk. The strain-dependent transition rate modifications are
and
where km is the stiffness in the current motor’s stalk, ϵ is the strain on the motor’s stalk, kB is Boltzmann’s constant, T is the absolute temperature, δ is the characteristic bond length of the myosin bond [7],
Each motor’s state is independently updated. The probability, Pij, that a motor will transition from state i to state j within a particular time step Δt is given by
yielding
for transition rates that are not modified by strain, and
for transition rates modified by strain. This relationship can also be arrived to by assuming the state transition reaction to be a binomial process with a fixed probability of success and a large number of trials.
States with only one transition rate (states 1, 15, and 4) transition to the next state (state 2, 2, and 1, respectively) when Pij > rand, where rand is a uniformly distributed random number between 0 and 1. If Pij ≤ rand, the motor stays in its current state. For states with two transition rates (states 2 and 3), states are updated based on joint probabilities. State 2 transitions as follows:
if P23 + P215 ≤ 1
rand < P23 2 → 3
P23 < rand and rand < (P23 + P215) 2 → 15
rand > (P23 + P215) 2 → 2
if P23 + P215 > 1
and state 3 transitions as follows:
if P34 + P32 ≤ 1
rand > (P34 + P32) 3 → 3
P34 < rand and rand < (P34 + P32) 3 → 2
rand < P34 3 → 4
if P34 + P32 > 1
Adhesion plaques form in a hierarchical process (Figure 1B [61], Zaidel-bar et al. [62]. The first step in forming an adhesion plaque requires integrin activation. Integrin activates by complexing with talin at a rate kact. Activated integrins attach to the substrate ligand at a rate katt. Once attached to the substrate, actin-myosin filaments bind to talin. These dynamics are temporally regulated. Integrin activation, integrin attachment, and actin-myosin attachment occur at independent time steps. The force generated in a single actin-myosin ensemble due to myosin activity is calculated by
where N1 and N4 are the number of motors in the ensemble in states 1 and 4 and y is the motor step size. The force in the actin-myosin filament is myosin-dependent. The first term represents the number of motors actively generating force by pulling on actin while the second term is the contribution of passive force from the strain of all actin-bound myosin in the ensemble. Negative strain in the motor stalk applies a force on the actin filament in the direction of active sliding between the actin filament and myosin bundles, while positive strain opposes active sliding (contraction). Motors that are not bound to actin do not contribute to the passive force.
Conversion of endogenous actin-myosin force to traction force requires a physical pathway. Integrins provide the physical link that determines if the endogenous force is converted to traction force. The force experienced at integrin-substrate bond is dependent on the displacement from pulling on integrin by the actin-myosin filament. We solve for the displacement
where x is the displacement, kspring is the effective spring constant between substrate and integrin, and γ is the drag on the actin-myosin filament [63]. Integrin-substrate bond lifetimes have force-independent association rates and force dependent dissociation rates. Two integrin dissociation rates are reported: slip bonds and catch-slip bonds [64, 65]. Slip bond lifetimes continuously decrease with increasing force whereas catch-slip bonds have a force range that strengthens the bond and increases the bond lifetime [65, 66]. Catch-slip integrins experience an increase in bond lifetime up to an optimum applied force before reverting to a slip bond. Slip bond force-dependent dissociation rates are modeled by
where k0 is the unloaded off rate, Fi is the force at the integrin-substrate interface, and Fb is the characteristic bond rupture force. Integrins with catch-slip dynamics are modeled by [67].
where A, B, and C are constants, ξ is the unbinding length, and Fi is the load on the integrin. We use the dissociate rate, koff, to calculate the dissociation probability
Simulation for slip and catch-slip bond dynamics require talin-mediated integrin activation before integrin-substrate binding. The probability of integrin activating is
where kact is the integrin activation rate. Activated integrins are then available to bind to the substrate. The probability for an integrin to bind to the substrate is
where katt it the rate at which activated integrin attach to the substrate. Activated and substrate-bound integrins are available for an actin-myosin contractile unit to attach. The probability that an actin-myosin filament attaches to integrin is
where ksfatt is the actin-myosin filament binding rate. We track integrin activation, integrin-substrate binding, actin-myosin filament attachment, and talin-mediated actin-myosin filament recruitment (more than one actin-myosin filament per integrin) or talin-integrin branching (more than one integrin per actin-myosin filament). We use talin-mediated dynamics to create a more realistic model. A complete physical pathway from actin-myosin to substrate enables transmission of endogenous forces to the cell’s immediate surrounding via integrin-substrate attachment. We calculate the force on individual integrin-substrate bonds by the actin-myosin filament activity as
where kspring is the spring constant of the substrate and xi is the displacement of the filament. We use this force in Eq. 9 to update the attachment status of integrins. In the case that the force does not rupture the integrin-substrate bond, the force is successfully transmitted to the substrate. Non-ruptured bonds allow myosin to continue to increase the displacement of the filament, increasing the forces experienced at the integrin-substrate bond. As force increases linearly with displacement there will be a max force at which the bond will break, ending its attachment period. Individual integrins experience force generated by actin-myosin. We use the individual forces at the integrins to determine the traction stress, or the collective force of all filaments actively generating and transmitting force. Traction stress is sensitive to bond lifetimes of individual integrins in the adhesion plaque. Traction stress is
Similarly, adhesion size, which we define as only those integrins bound to the substrate actively transmitting actin-myosin force, is
For simulations where talin is permitted to recruit filaments or branch to integrins, we calculate the probability of talin unfolding and allow up to eight actin filaments to attach to a single integrin-talin complex or branching to two integrins. Talin unfolding probabilities are
and
with krec representing the talin unfolding rate for recruiting filaments and kbranch representing the talin unfolding rate for branching. We represent the adhesion plaque and the proteins required to establish a physical link from actin-myosin to substrate with matrices that are n × m where n is the number of integrins/filaments/attachment status, etc., and m is time in ms. Each matrix tracks motor state changes, integrin activation, integrin attachment, filament displacement, force, recruitment, and branching. For talin recruiting filaments, the displacement of the filaments is calculated by
where R is the number of recruited stress fibers. The force on the integrin is calculated using Eq. 14. Similarly the displacement of branched filaments attached to multiple integrins is calculated by
where b is the number of branches. The force on the integrins is calculated using Eq. 14. Single filament average bond lifetimes are calculated by determining the time intact mechanical pathways are bound to the substrate
where n is the number of intact pathways and Lt is the duration in ms of the binding event.
The stall force for the actin-myosin fibers is calculated by fitting the force generated over time with
The stall force reported is the average stall force over 100 actin-myosin filaments. When integrins bonds break in a force dependent manner, we obtain the maximum force generated by the actin-myosin filament during any attachment event. We report the average of the maximum force as
where FAM is the vector n elements long that contains the maximum force generated in all binding events of filament j. Similarly, the average non-zero force generated is
where N is the number of filaments and Fnz is the non-zero average of the filament. We report the maximum traction force per μm2 by fitting
All model parameters and their values are given in Table 1.
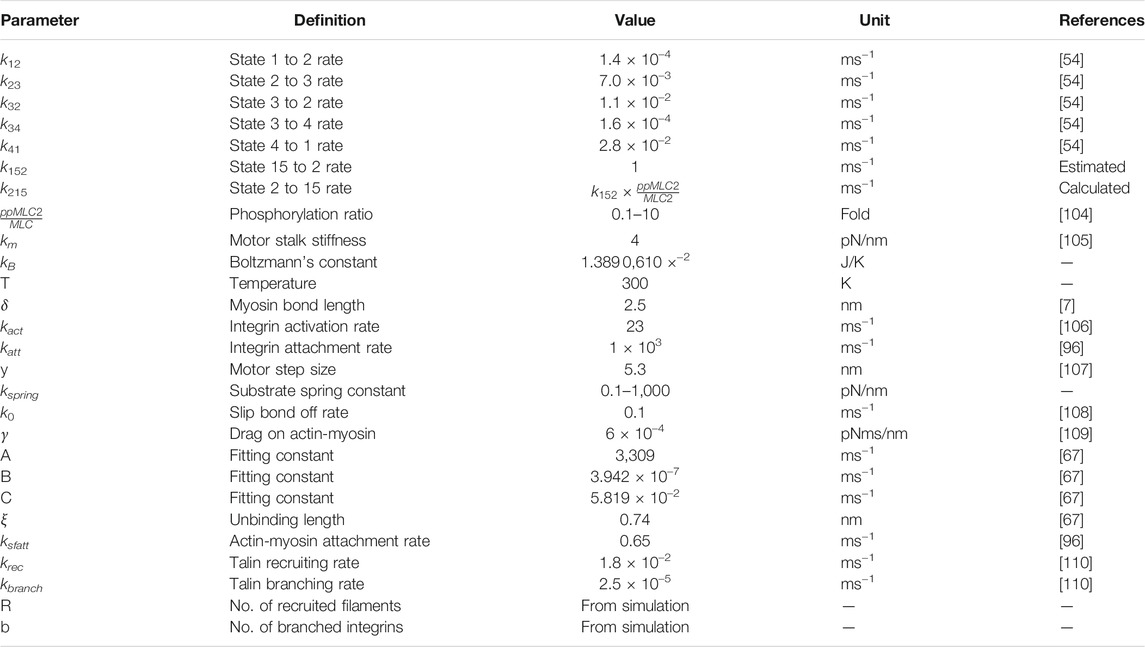
TABLE 1. Model parameters.
The model described above explicitly simulates force and ATP dependent cycling of individual myosin motors as the enter and exit the crossbridge cycle and bind to and pull on the actin fibers. This allows us to exclude making any implicit assumptions regarding the force velocity dependence of myosin motors. The model also explicitly calculates the forces that these individual motors apply on actin fibers at each time point, how these forces are transmitted to the surface when the filament is bound to it via an elastic bond, and the dynamics of the individual bonds forming and breaking. In addition, the model simulates force dependent recruitment or branching of additional actin-myosin fibers at these bonds in order to simulate some of the mechanosensitive features of cell-substrate adhesion. We explore how nascent force develops in single filaments by varying integrin bond type, number of active motors, substrate stiffness, and talin-mediated actin-myosin filament recruiting or talin branching. Furthermore, we show how these factors influence traction stress transmitted by the actin-myosin fibers to the substrate.
The force at which the sliding velocity of the actin filament along the myosin bundles approaches zero is the stall force, or the isometric force as defined by Huxley and others, for which the length of the actin-myosin bundle stays constant (the fibers do not contract). Simulations on single actin-myosin filaments pulling against a constant load using the model described above, where kspringx term is replaced by a constant force, gives a hyperbolic force-velocity relationship (Supplementary Figures S9, S10). This matches the force velocity relationship of muscle actin-myosin bundles described by [68] and more recently observed by [69]. The low force actin filament speeds from our simulations (Supplementary Figure S10) also match the observed free actin filament sliding speed driven by non-muscle myosin 2B motors.
Increasing ppMLC2:MLC2 and substrate stiffness increases stall force (Figure 2A). An obvious factor that controls the stall force of an actin-myosin filament has to be the number of active motors generating forces. However, the nature of relationship between biochemical activation-deactivation rates of motors, the number of active motors at any given instant and the total force generated in each actin-myosin filament is not well characterized. We explore these relationships by changing the number of active motors in the crossbridge cycle by increasing the ratio of ppMLC2:MLC2. Stall force is dependent on the number of motor proteins actively generating force per actin-myosin filament. Stall force increases linearly with the number of motors in force-generating states [44] (Supplementary Figure S1). Interestingly, the stall force is not linear with the total number of active motors for low number of active motors, and the rate of stall force increase as more active motors are added to the system depends on the substrate stiffness (Supplementary Figure S11). Additionally, the stall forces show a saturating relationship with the motor phosphorylation (activation)/dephosphorylation (deactivation) rate ratios (Supplementary Figure S12).
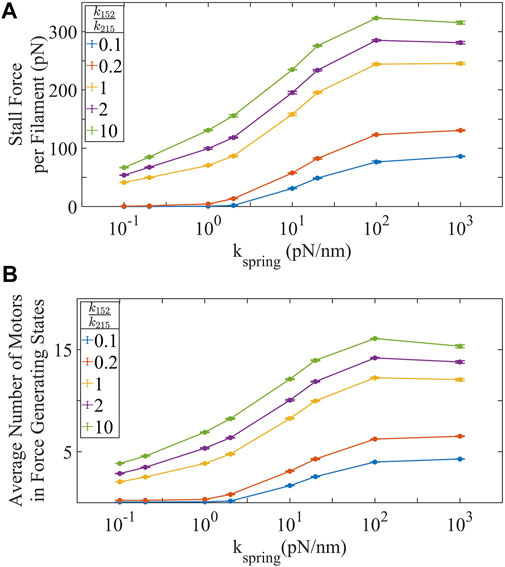
FIGURE 2. (A) Stall force, the maximum force an actin-myosin fiber can generate increases with ppMLC2:MLC2 and substrate stiffness. (B) The number of motors actively generating force increases with ppMLC2:MLC2 and substrate stiffness. Our simulations show that approximately one quarter or less of available motors are actively in the force generating state at any given instant, even for large stall forces. Error bars represent ±SEM for 100 filaments over three independent simulations.
A less obvious factor that controls the stall force of an actin-myosin filament is the stiffness of the substrate against which the actin-myosin filament is pulling. We observe that in the absence of unbinding/breaking of the actin-integrin-substrate connection, the stall force generated in a single actin-myosin filament strongly depends on the stiffness of the substrate, kspring, it is pulling against (Eq. 14). This result matches the prediction by Stam et al. [7], and is extremely relevant to other models describing cell traction force generation and migration [70]. Most models assume a constant isometric force for actin-myosin filaments, dictated by the stall force of individual motors and the number of active motors available to interact with the actin filament. However, our results suggest that there is not one fixed isometric force when the filament is contracting against a spring element as opposed to a constant force. Instead, the spring stiffness dictates the maximum stall force that can be generated in the actin-myosin filament, and this can exceed the stall force observed using a constant force application. This dependence of the stall force on substrate stiffness arises because pulling against a stiffer substrate synchronizes myosin cross-bridge cycling and recruits more myosin into the actin bound, force generating states (Figure 2B). The results show that the forces transmitted by individual actin-myosin filaments (and consequently the traction stress) is not limited by the stall forces of the filaments, as these stall forces are far greater than observed forces transmitted across individual actin-integrin-substrate bonds.
Stall force shows us how much force is possible in the absence of integrin-substrate unbinding. Clearly, one would expect that a higher stall force for an actin-myosin filament would result in a higher overall traction force generated by the cell. Integrins, however, do break their attachment with the substrate in a force-dependent fashion. If we allow integrin bond to break, then the stall force in an actin-myosin filament does not limit the forces transmitted across the cell-substrate bond. Instead, bond lifetime emerges as a critical limiting factor. The bond lifetime can limit the force being transmitted from the cell to the substrate in two ways—1) by restricting the maximum forces possible in individual actin-integrin-substrate adhesions can ramp up to before the individual integrin-substrate bond breaks, and 2) by affecting how many actin-integrin-substrate adhesions are actively transmitting cellular forces to the substrate at any given instance. We test the contributions of both these mechanisms under slip as well as catch-slip integrin-substrate binding detachment kinetics. We observe that the maximum force increases with ppMLC2:MLC2 and substrate stiffness in both bond types (Figures 3A,C). Both bond types have monotonically increasing maximum forces with catch-slip bonds generating larger forces than slip bonds. The maximum force captures the force at which the integrin-substrate bond ruptures. Slip bonds generate forces
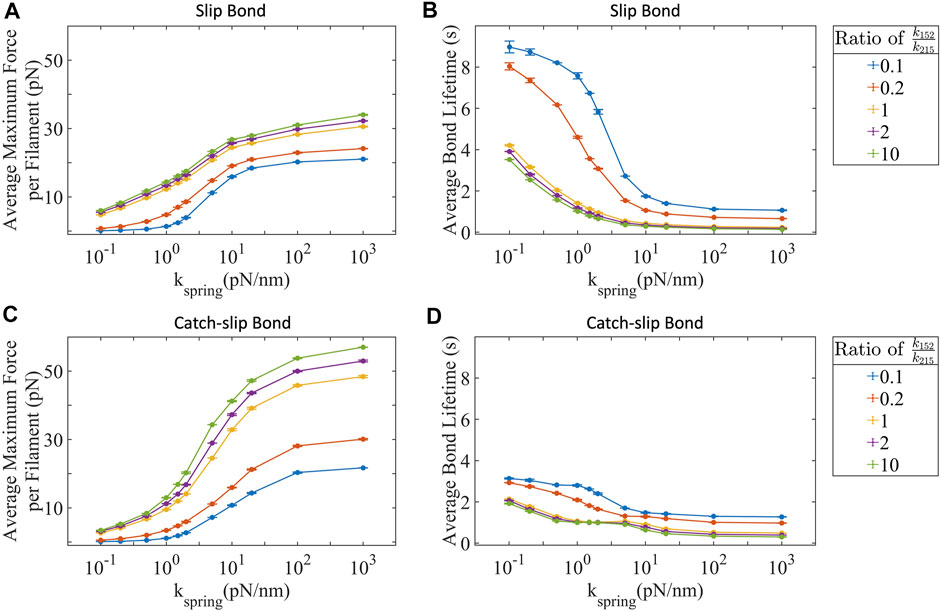
FIGURE 3. Maximum force transmitted to the substrate is bond type dependent and limited by the bond adhesion lifetime. Both slip bonds and catch-slip bond integrins transmit increasing forces with increased ppMLC2:MLC2 and substrate stiffness with slip bonds (A) transmitting lower forces than (C) catch-slip bonds. Both slip (B) and catch-slip (D) integrins experience decreased bond lifetimes with increased ppMLC2:MLC2 and substrate stiffness. Error bars represent ±SEM for 100 filaments over three independent simulations.
In the above sections, we focused on individual actin-myosin fibers interacting with individual cell-substrate adhesions. Next, we describe the collective effect of multiple actin-myosin fibers binding to, pulling against, and breaking cell-substrate adhesion bonds. Here we study two different scenarios—1) when actin-myosin fibers act independently of each other, and 2) when there is force dependent, talin mediated recruitment of additional actin-myosin fibers to existing integrin-attached fibers (Eq. 19), or if there is a force dependent recruitment of additional integrins at already stressed adhesion sites (Eq. 20). We estimate the traction force, defined as the sum of the forces transmitted by all the adhesion sites within a region of the cell [73] for both of these scenarios. We report this as the traction stress, which is the force generated over a unit area 1 μm2. Only those actin-myosin filaments with an intact mechanical pathway contribute to traction stress. We test whether talin-mediated recruitment of actin-myosin fibers and integrin branching have any effect on traction stress. Talin contains four domains that unfold with applied force as low as 2 pN [27, 28]. Three of these domains (I, II, and IV) have vinculin binding sites and one domain (III) has an integrin binding site. Regions II-IV have force-dependent unfolding rates
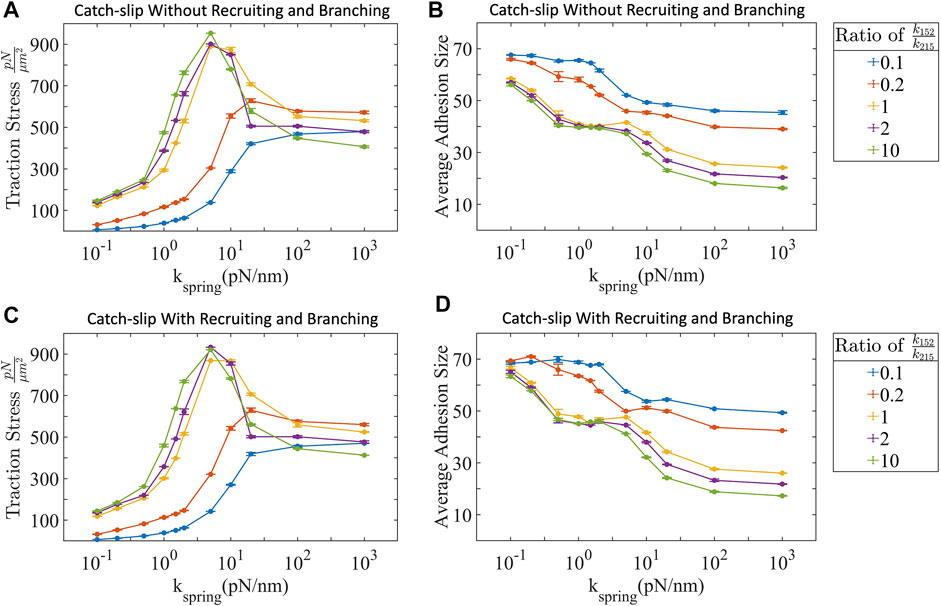
FIGURE 4. (A) Traction stress without and (C) with talin-mediated adhesion reinforcement demonstrate similar profiles. Both conditions show biphasic trends at high ppMLC2:MLC2 and high substrate stiffness. (B) Adhesion size without and (D) with talin-mediated reinforcement decrease with increased ppMLC2:MLC2 and substrate stiffness. Error bars represent ±SEM for 100 filaments over three independent simulations.
We have identified how force develops in single filaments and how both ppMLC2:MLC2 and substrate stiffness are sufficient to increase force. These observations of force generation in individual actin-myosin filaments does not scale up to traction stress per μm2. Instead, if we consider the impulse transmitted by individual actin-myosin filaments during each active binding event, a trend emerges (Figure 5B). Impulse is calculated by
where τ1 to τ2 is the time window when an actin-myosin filament is actively transmitting force to the substrate via an integrin bond. Impulse then uniquely predicts traction force.
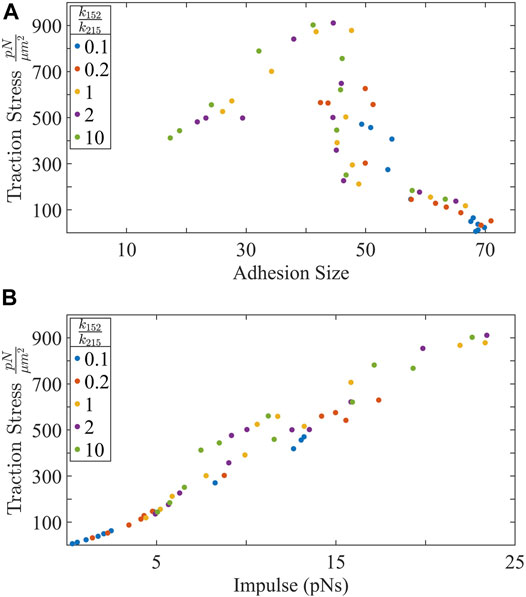
FIGURE 5. (A) Traction stress is biphasic with adhesion size. There is an initial increase in traction stress with adhesion growth, followed by a regime where traction stress is decouple from the adhesion size. Interestingly, largest adhesion sizes correspond to lowest traction forces generated. (B) Traction force increases almost linearly with the impulse transmitted by individual actin-myosin filaments to the substrate.
The maximum force a single actin-myosin unit can generate is context-dependent and can be modulated by either one or more of the following conditions: integrin bond type, ppMLC2:MLC2, and substrate stiffness. Traction stress, the contribution of all force generating filaments in an adhesion complex, and force per filament have drastically different profiles even though traction stress is entirely dependent on single filament forces. Forces generated by actin-myosin filaments are modulated by two independent mechanisms: the number of motors and substrate stiffness. For example, simulations with integrin bonds that do not break show that if we hold ppMLC2:MLC2 constant, traction force increases with substrate stiffness. Likewise, if we keep substrate stiffness constant, stall force increases with ppMLC2:MLC2. Furthermore, force generation has a positive effect on myosin as myosin is mechanosensitive [74]. Myosin duty ratio shifts in a force-dependent manner [7]. The duty ratio increases with load which increases the number of attached motors as substrate stiffness increases in a ppMLC2:MLC2 independent mechanism. The increase in motors is not a response to stiffer substrates but a response to increased force. Stall force then is a response to both the number of activated motors and substrate stiffness. Our simulations with catch-slip bonds with and without talin-mediated actin-filament recruitment or integrin branching agree with experimental results showing that single integrin bonds withstand forces ranging from 10–30 pN [75, 76], up to
However, adhesion size seems to be a poor predictor for traction stress. Contrary to reports that use adhesions to predict traction force [17] there is a large range of traction stress at adhesions containing approximately 50 bound integrins (Figure 5A). Additionally, We see that traction stress is biphasic with adhesion size. There is an optimal adhesion size that maximizes traction force, past which, the traction force decreases. These results could explain how highly motile cells exhibit inverse correlation between adhesion size, migration speed, and increased invasiveness [3, 67, 77]. Increasing forces increases the likelihood that integrins will rupture their bond with the substrate and decreases the bond lifetime. Decreasing bond lifetimes affect adhesion size. We can make a generalization that large adhesion have integrins that experience longer bond lifetimes but transmit lower forces than small adhesions whose integrins experience shorter bond lifetimes but transmit greater forces. In this respect, our results agree with trends that relatively small adhesions transmit greater forces than large adhesions [78] and that adhesions
Overall, the model presented here is an extension of, or borrows from, a number of prior actin-myosin force generation and filament sliding models [51, 57, 95]. It also borrows from other traction force, actin-integrin-substrate adhesion models [13, 36, 96]. Specific features new to this model are—1) The model describes five stages to allow for myosin activation via phosphorylation, as compared to the one [51]. This allows the future possibility of integrating it with systems biology models focused on upstream signals that can promote or inhibit myosin phosphorylation. Additionally, it incorporates mechanical regulation of cross-bridge cycling rates as a function of individual motor strains, fluctuations in myosin distributions along the actin-myosin fibers, and the ability to track activity at the level of individual motors. Beyond the detailed incorporation of actin-myosin cross-bridge cycling, the model also incorporates differences in cell-substrate adhesion bond kinetics, substrate mechanical stiffness, mechanochemical regulation of focal adhesion formation via Talin binding and mechanosensitive recruiting or branching of actin stress-fibers, along the lines of the model described by [63]. These allow for easy extension of the model to probe biochemical signaling downstream of mechanosensitive focal adhesions. While we limit the use of the model to focus on factors that govern instantaneous traction force generation in cells, there are many other potential applications of this model, especially when coupled with biochemical signaling models. A limitation of this model is that it tracks the generation of traction forces only on the order of minutes. Thus, cell scale events such as cytoskeletal remodeling ([97], actin fiber depolymerization and reorganization [98], adhesion remodeling occurring over longer time-scales [99, 100], as well as changes to protein expression levels within the cell cannot be accounted for. These phenomena could transiently alter traction stress which might differ from the short timescale steady state predictions made here. The bridging of phenomena across times scales and observing transient changes to traction stress generation is a challenge that we look to addressing in the future iterations and applications of this model.
Different cell types generate different levels of traction stress. The forces themselves are not exclusive to a cell type. Rather, forces are dependent on actin-myosin organization, myosin contractility, cell-substrate adhesion and coupling between the cell cytoskeleton and the cell-substrate adhesions. These factors are in-turn governed by intra-cellular and extra-cellular chemical and mechanical signals such as hypoxia, adrenergic signaling, growth factor signaling, substrate viscoelasticity and so on. [82, 101, 102]. In this work, we focused on the immediate regulators of cell traction force generation—myosin motor activity (primarily non-muscle myosin 2 interactions with actin filaments), actin-myosin filament coupling to cell-substrate adhesions, and substrate elastic response. We find that stall forces are not the limiting factor for the traction force that cells can generate. Instead, as substrate stiffness increases the number of active motors in the force generating states increase, consequently increasing the stall force for individual actin-myosin filaments. Investigating the actin-integrin-substrate adhesion dynamics, we find that traction stress is limited by the integrin-substrate bond lifetime, which decreases with increasing substrate stiffness and myosin activity. Ultimately, we show that traction stress is proportional to the impulse transmitted by individual actin-myosin filaments to the substrate via focal adhesions. Our model integrates the nanoscale, microsecond activity of individual myosin motors interacting with actin filaments with nanoscale cell substrate adhesion mechanics to estimate traction forces generated by cells over microscale adhesion regions over a timescale of minutes. It also allows for ways to integrate biochemical signals that alter myosin phosphorylation states, actin organization, focal adhesion protein concentrations and activity, as well as mechanochemical feedback between these elements to provide a detailed cell traction force generation model. The results of this model can further be integrated with systems biology models focusing on intra-cellular chemical signaling to include the effects of mechanical force generation on certain mechanically activated reaction pathways such as talin-vinculin binding and focal adhesion kinase (FAK) activation and signaling [103].
The original contributions presented in the study are included in the article/Supplementary Material, further inquiries can be directed to the corresponding author.
EV-H, ACR, and PK conceptualized the research. EV-H and CMF developed the model. EV-H tested the model, ran the simulations and analyzed the results. EV-H, ACR, and PK wrote and edited the manuscript.
This work was supported by grants from the National Science Foundation (BMMB-1906 165 to ACR and BMMB-1905 390 to PK).
The authors declare that the research was conducted in the absence of any commercial or financial relationships that could be construed as a potential conflict of interest.
All claims expressed in this article are solely those of the authors and do not necessarily represent those of their affiliated organizations, or those of the publisher, the editors and the reviewers. Any product that may be evaluated in this article, or claim that may be made by its manufacturer, is not guaranteed or endorsed by the publisher.
The Supplementary Material for this article can be found online at: https://www.frontiersin.org/articles/10.3389/fphy.2022.831776/full#supplementary-material
1. Polacheck WJ, Chen CS Measuring Cell-Generated Forces: a Guide to the Available Tools. Nat Methods (2016) 13:415–23. doi:10.1038/nmeth.3834
2. Peschetola V, Laurent VM, Duperray A, Michel R, Ambrosi D, Preziosi L, et al. Time-Dependent Traction Force Microscopy for Cancer Cells as a Measure of Invasiveness. Cytoskeleton (2013) 70:201–14. doi:10.1002/cm.21100
3. Kraning-Rush CM, Califano JP, Reinhart-King CA Cellular Traction Stresses Increase with Increasing Metastatic Potential. PLoS ONE (2012) 7:e32572. doi:10.1371/journal.pone.0032572
4. Koch TM, Münster S, Bonakdar N, Butler JP, Fabry B 3D Traction Forces in Cancer Cell Invasion. PLoS ONE (2017) 7:e33476–1669. doi:10.1371/journal.pone.0033476
5. Li Z, Persson H, Adolfsson K, Abariute L, Borgström MT, Hessman D, et al. Cellular Traction Forces: a Useful Parameter in Cancer Research. Nanoscale (2017) 9:19039–44. doi:10.1039/c7nr06284b
6. Linari M, Brunello E, Reconditi M, Fusi L, Caremani M, Narayanan T, et al. Force Generation by Skeletal Muscle Is Controlled by Mechanosensing in Myosin Filaments. Nature (2015) 528:276–9. doi:10.1038/nature15727
7. Stam S, Alberts J, Gardel ML, Munro E Isoforms Confer Characteristic Force Generation and Mechanosensation by Myosin II Filaments. Biophysical J (2015) 108:1997–2006. doi:10.1016/j.bpj.2015.03.030
8. Hilbert L, Cumarasamy S, Zitouni NB, Mackey MC, Lauzon A-M The Kinetics of Mechanically Coupled Myosins Exhibit Group Size-dependent Regimes. Biophysical J (2013) 105:1466–74. doi:10.1016/j.bpj.2013.07.054
9. Doss BL, Pan M, Gupta M, Grenci G, Mège R-m., Lim CT, et al. Cell Response to Substrate Rigidity Is Regulated by Active and Passive Cytoskeletal Stress. Proc Natl Acad Sci USA (2020) 117:12817–25. doi:10.1073/pnas.1917555117
10. Discher DE, Janmey P, Wang Y Tissue Cells Feel and Respond to the Stiffness of Their Substrate. Science (2005) 310:1139–43. doi:10.1126/science.1116995
11. Zhou DW, Lee TT, Weng S, Fu J, García AJ, Weaver VM Effects of Substrate Stiffness and Actomyosin Contractility on Coupling between Force Transmission and Vinculin-Paxillin Recruitment at Single Focal Adhesions. MBoC (2017) 28:1901–11. doi:10.1091/mbc.E17-02-0116
12. Wells RG The Role of Matrix Stiffness in Regulating Cell Behavior. Hepatology (2008) 47:1394–400. doi:10.1002/hep.22193
13. Vargas DA, Gonçalves IG, Heck T, Smeets B, Lafuente-Gracia L, Ramon H, et al. Modeling of Mechanosensing Mechanisms Reveals Distinct Cell Migration Modes to Emerge from Combinations of Substrate Stiffness and Adhesion Receptor-Ligand Affinity. Front Bioeng Biotechnol (2020) 8:1–19. doi:10.3389/fbioe.2020.00459
14. Pelham RJ, Wang Y-l Cell Locomotion and Focal Adhesions Are Regulated by Substrate Flexibility. Proc Natl Acad Sci (1997) 94:13661–5. doi:10.1073/pnas.94.25.13661
15. Wang H-b., Dembo M, Wang Y-l., Dembo M, Wang Y Substrate Flexibility Regulates Growth and Apoptosis of normal but Not Transformed Cells. Am J Physiology-Cell Physiol (2000) 279:C1345–C1350. doi:10.1152/ajpcell.2000.279.5.c1345
16. Kanchanawong P, Shtengel G, Pasapera AM, Ramko EB, Davidson MW, Hess HF, et al. Nanoscale Architecture of Integrin-Based Cell Adhesions. Nature (2010) 468:580–4. doi:10.1038/nature09621
17. Kim DH, Wirtz D Focal Adhesion Size Uniquely Predicts Cell Migration. FASEB j. (2013) 27:1351–61. doi:10.1096/fj.12-220160
18. Zaidel-bar R, Itzkovitz S, Ma'ayan A, Iyengar R, Geiger B Functional Atlas of the Integrin Adhesome. Nat Cel Biol (2007) 9:858–67. doi:10.1038/ncb0807-858
19. Horton ER, Byron A, Askari JA, Ng DHJ, Millon-Frémillon A, Robertson J, et al. Definition of a Consensus Integrin Adhesome and its Dynamics during Adhesion Complex Assembly and Disassembly. Nat Cel Biol (2015) 17:1577–87. doi:10.1038/ncb3257
20. Horton ER, Humphries JD, James J, Jones MC, Askari JA, Humphries MJ The Integrin Adhesome Network at a Glance. J Cel Sci (2016) 129:4159–63. doi:10.1242/jcs.192054
21. Kechagia JZ, Ivaska J, Roca-Cusachs P Integrins as Biomechanical Sensors of the Microenvironment. Nat Rev Mol Cel Biol (2019) 20:457–73. doi:10.1038/s41580-019-0134-2
22. Huttenlocher A, Horwitz AR Integrins in Cell Migration. Cold Spring Harbor Perspect Biol (2011) 3:a005074. doi:10.1101/cshperspect.a005074
23. Zamir E, Geiger B Focal Adhesions and Related Integrin Contacts. 2 edn. Amsterdam, Netherlands: Elsevier (2013). p. 318–23. doi:10.1016/B978-0-12-378630-2.00473-4
24. Bershadsky A, Kozlov M, Geiger B Adhesion-mediated Mechanosensitivity: a Time to experiment, and a Time to Theorize. Curr Opin Cel Biol (2006) 18:472–81. doi:10.1016/j.ceb.2006.08.012
25. Geiger B, Bershadsky A Assembly and Mechanosensory Function of Focal Contacts. Curr Opin Cel Biol (2001) 13:584–92. doi:10.1016/S0955-0674(00)00255-6
26. Geiger B, Spatz JP, Bershadsky AD Environmental Sensing through Focal Adhesions. Nat Rev Mol Cel Biol (2009) 10:21–33. doi:10.1038/nrm2593
27. Yao M, Goult BT, Klapholz B, Hu X, Toseland CP, Guo Y, et al. The Mechanical Response of Talin. Nat Commun (2016) 7:1–11. doi:10.1038/ncomms11966
28. Chakraborty S, Banerjee S, Raina M, Haldar S Force-Directed "Mechanointeractome" of Talin-Integrin. Biochemistry (2019) 58:4677–95. doi:10.1021/acs.biochem.9b00442
29. Critchley DR. Smurf1 Zaps the Talin Head. Nat Cel Biol (2009) 11:538–40. doi:10.1038/ncb0509-538
30. Fillingham I, Gingras AR, Papagrigoriou E, Patel B, Emsley J, Critchley DR, et al. A Vinculin Binding Domain from the Talin Rod Unfolds to Form a Complex with the Vinculin Head. Structure (2005) 13:65–74. doi:10.1016/j.str.2004.11.006
31. Elliott PR, Goult BT, Kopp PM, Bate N, Grossmann JG, Roberts GCK, et al. The Structure of the Talin Head Reveals a Novel Extended Conformation of the FERM Domain. Structure (2010) 18:1289–99. doi:10.1016/j.str.2010.07.011
32. Lazarides E Actin, Alpha-Actinin, and Tropomyosin Interaction in the Structural Organization of Actin Filaments in Nonmuscle Cells. J Cel Biol (1976) 68:202–19. doi:10.1083/jcb.68.2.202
33. Chrzanowska-wodnicka M, Burridge K Rho-stimulated Contractility Drives the Formation of Stress Fibers and Focal Adhesions. J Cel Biol (1996) 133:1403–15. doi:10.1083/jcb.133.6.1403
34. Burridge K, Guilluy C Focal Adhesions, Stress Fibers and Mechanical Tension. Exp Cel Res (2016) 343:14–20. doi:10.1016/j.yexcr.2015.10.029
35. Oakes PW, Bidone TC, Beckham Y, Skeeters AV, Ramirez-San Juan GR, Winter SP, et al. Lamellipodium Is a Myosin-independent Mechanosensor. Proc Natl Acad Sci USA (2018) 115:2646–51. doi:10.1073/pnas.1715869115
36. Bidone TC, Skeeters AV, Oakes PW, Voth GA Multiscale Model of Integrin Adhesion Assembly. Plos Comput Biol (2019) 15:e1007077–20. doi:10.1371/journal.pcbi.1007077
37. Han SJ, Azarova EV, Whitewood AJ, Bachir A, Guttierrez E, Groisman A, et al. Pre-complexation of Talin and Vinculin without Tension Is Required for Efficient Nascent Adhesion Maturation. eLife (2021) 10:1–29. doi:10.7554/eLife.66151
38. Goult BT, Bouaouina M, Elliott PR, Bate N, Patel B, Gingras AR, et al. Structure of a Double Ubiquitin-like Domain in the Talin Head: A Role in Integrin Activation. Embo J (2010) 29:1069–80. doi:10.1038/emboj.2010.4
39. Goksoy E, Ma Y-q., Wang X, Kong X, Perera D, Plow EF, et al. Structural Basis for the Autoinhibition of Talin in Regulating Integrin Activation. Mol Cel (2008) 31:124–33. doi:10.1016/j.molcel.2008.06.011
40. Nayal A, Webb DJ, Horwitz AF Talin: an Emerging Focal point of Adhesion Dynamics. Curr Opin Cel Biol (2004) 16:94–8. doi:10.1016/j.ceb.2003.11.007
41. Burridge K, Connell L Talin: A Cytoskeletal Component Concentrated in Adhesion Plaques and Other Sites of Actin-Membrane Interaction. Cel Motil (1983) 3:405–17. doi:10.1002/cm.970030509
42. Wang J-h Pull and Push: Talin Activation for Integrin Signaling. Cell Res (2012) 22:1512–4. doi:10.1038/cr.2012.103
43. Tojkander S, Gateva G, Husain A, Krishnan R, Lappalainen P Generation of Contractile Actomyosin Bundles Depends on Mechanosensitive Actin Filament Assembly and Disassembly. eLife (2015) 4:1–28. doi:10.7554/elife.06126
44. Thoresen T, Lenz M, Gardel ML Thick Filament Length and Isoform Composition Determine Self-Organized Contractile Units in Actomyosin Bundles. Biophysical J (2013) 104:655–65. doi:10.1016/j.bpj.2012.12.042
45. Mak M, Zaman MH, Kamm RD, Kim T Interplay of Active Processes Modulates Tension and Drives Phase Transition in Self-Renewing, Motor-Driven Cytoskeletal Networks. Nat Commun (2016) 7. doi:10.1038/ncomms10323
46. Billington N, Wang A, Mao J, Adelstein RS, Sellers JR Characterization of Three Full-Length Human Nonmuscle Myosin II Paralogs. J Biol Chem (2013) 288:33398–410. doi:10.1074/jbc.M113.499848
47. Verkhovsky AB, Borisy GG Non-Sarcomeric Mode of Myosin II Organization in the Fibroblast Lamellum. J Cel Biol (1993) 123:637–52. doi:10.1083/jcb.123.3.637
48. Opazo Saez A, Zhang W, Wu Y, Turner CE, Tang DD, Gunst SJ, et al. Tension Development during Contractile Stimulation of Smooth Muscle Requires Recruitment of Paxillin and Vinculin to the Membrane. Am J Physiology-Cell Physiol (2004) 286:C433–C447. doi:10.1152/ajpcell.00030.2003
49. Golji J, Mofrad MRK The Interaction of Vinculin with Actin. Plos Comput Biol (2013) 9:e1002995. doi:10.1371/journal.pcbi.1002995
50. Elosegui-Artola A, Jorge-Peñas A, Moreno-Arotzena O, Oregi A, Lasa M, García-Aznar JM, et al. Image Analysis for the Quantitative Comparison of Stress Fibers and Focal Adhesions. PLoS ONE (2014) 9:e107393. doi:10.1371/journal.pone.0107393
51. Walcott S, Warshaw DM, Debold EP Mechanical Coupling between Myosin Molecules Causes Differences between Ensemble and Single-Molecule Measurements. Biophysical J (2012) 103:501–10. doi:10.1016/j.bpj.2012.06.031
52. Spudich JA The Myosin Swinging Cross-Bridge Model. Nat Rev Mol Cel Biol (2001) 2:387–92. doi:10.1038/35073086
53. Williams CD, Regnier M, Daniel TL Axial and Radial Forces of Cross-Bridges Depend on Lattice Spacing. Plos Comput Biol (2010) 6:e1001018. doi:10.1371/journal.pcbi.1001018
54. Kovács M, Wang F, Hu A, Zhang Y, Sellers JR Functional Divergence of Human Cytoplasmic Myosin II. J Biol Chem (2003) 278:38132–40. doi:10.1074/jbc.M305453200
55. Rice JJ, Stolovitzky G, Tu Y, de Tombe PP Ising Model of Cardiac Thin Filament Activation with Nearest-Neighbor Cooperative Interactions. Biophysical J (2003) 84:897–909. doi:10.1016/s0006-3495(03)74907-8
56. Marcucci L, Reggiani C Mechanosensing in Myosin Filament Solves a 60 Years Old Conflict in Skeletal Muscle Modeling between High Power Output and Slow Rise in Tension. Front Physiol (2016) 7:1–9. doi:10.3389/fphys.2016.00427
57. Lan G, Sun SX Dynamics of Myosin-Driven Skeletal Muscle Contraction: I. Steady-State Force Generation. Biophysical J (2005) 88:4107–17. doi:10.1529/biophysj.104.056846
58. Sheikh F, Ouyang K, Campbell SG, Lyon RC, Chuang J, Fitzsimons D, et al. Mouse and Computational Models Link Mlc2v Dephosphorylation to Altered Myosin Kinetics in Early Cardiac Disease. J Clin Invest (2012) 122:1209–21. doi:10.1172/JCI61134DS1
59. Farris C The Role of Myosin Head State and Binding Site Availability in Calcium-dependent Regulation of a Muscle Mimetic System. Masters Abstr Int (2017) 57.
60. Veigel C, Molloy JE, Schmitz S, Kendrick-Jones J Load-dependent Kinetics of Force Production by Smooth Muscle Myosin Measured with Optical Tweezers. Nat Cel Biol (2003) 5:980–6. doi:10.1038/ncb1060
61. Sun Z, Lambacher A, Fässler R Nascent Adhesions: From Fluctuations to a Hierarchical Organization. Curr Biol (2014) 24:R801–R803. doi:10.1016/j.cub.2014.07.061
62. Zaidel-bar R, Cohen M, Addadi L, Geiger B Hierarchical Assembly of Cell-Matrix Adhesion Complexes. Biochem Soc Trans (2004) 32:416–20. doi:10.1042/bst0320416
63. Colombelli J, Besser A, Kress H, Reynaud EG, Girard P, Caussinus E, et al. Mechanosensing in Actin Stress Fibers Revealed by a Close Correlation between Force and Protein Localization. J Cel Sci (2009) 122:1665–79. doi:10.1242/jcs.042986
64. Boettiger D, Lynch L, Blystone S, Huber F Distinct Ligand-Binding Modes for Integrin αvβ3-Mediated Adhesion to Fibronectinversus Vitronectin. J Biol Chem (2001) 276:31684–90. doi:10.1074/jbc.M103997200
65. Novikova EA, Storm C Contractile Fibers and Catch-Bond Clusters: A Biological Force Sensor? Biophysical J (2013) 105:1336–45. doi:10.1016/j.bpj.2013.07.039
66. Rakshit S, Sivasankar S Biomechanics of Cell Adhesion: How Force Regulates the Lifetime of Adhesive Bonds at the Single Molecule Level. Phys Chem Chem Phys (2014) 16:2211–23. doi:10.1039/c3cp53963f
67. Yeoman B, Shatkin G, Beri P, Banisadr A, Katira P, Engler AJ Adhesion Strength and Contractility Enable Metastatic Cells to Become Adurotactic. Cel Rep (2021) 34:108816–9. doi:10.1016/j.celrep.2021.108816
68. Huxley AF Muscle Structure and Theories of Contraction. Prog Biophys Biophysical Chem (1957) 7:255–318. doi:10.1016/S0096-4174(18)30128-8
69. Norstrom MF, Smithback PA, Rock RS Unconventional Processive Mechanics of Non-muscle Myosin Iib. J Biol Chem (2010) 285:26326–34. doi:10.1074/jbc.m110.123851
70. Welf ES, Johnson HE, Haugh JM Bidirectional Coupling between Integrin-Mediated Signaling and Actomyosin Mechanics Explains Matrix-dependent Intermittency of Leading-Edge Motility. MBoC (2013) 24:3945–55. doi:10.1091/mbc.e13-06-0311
71. Tan SJ, Chang AC, Anderson SM, Miller CM, Prahl LS, Odde DJ, et al. Regulation and Dynamics of Force Transmission at Individual Cell-Matrix Adhesion Bonds. Sci Adv (2020) 6:1–12. doi:10.1126/sciadv.aax0317
72. Wang X, Sun J, Xu Q, Chowdhury F, Roein-peikar M, Wang Y, et al. Integrin Molecular Tension within Motile Focal Adhesions. Biophysical J (2015) 109:2259–67. doi:10.1016/j.bpj.2015.10.029
73. Zündel M, Ehret AE, Mazza E Factors Influencing the Determination of Cell Traction Forces. PLoS ONE (2017) 12:e0172927–18. doi:10.1371/journal.pone.0172927
74. Kovacs M, Thirumurugan K, Knight PJ, Sellers JR Load-dependent Mechanism of Nonmuscle Myosin 2. Proc Natl Acad Sci (2007) 104:9994–9. doi:10.1073/pnas.0701181104
75. Erickson HP Reversible Unfolding of Fibronectin Type III and Immunoglobulin Domains Provides the Structural Basis for Stretch and Elasticity of Titin and Fibronectin. Proc Natl Acad Sci (1994) 91:10114–8. doi:10.1073/pnas.91.21.10114
76. Thoumine O, Kocian P, Kottelat A, Meister J-J Short-term Binding of Fibroblasts to Fibronectin: Optical Tweezers Experiments and Probabilistic Analysis. Eur Biophys J (2000) 29:398–408. doi:10.1007/s002490000087
77. Lauffenburger DA, Horwitz AF Cell Migration: A Physically Integrated Molecular Process. Cell (1996) 84:359–69. doi:10.1016/s0092-8674(00)81280-5
78. Changede R, Sheetz M Integrin and Cadherin Clusters: A Robust Way to Organize Adhesions for Cell Mechanics. BioEssays (2016) 39:e201600123–12. doi:10.1002/bies.201600123
79. Tan JL, Tien J, Pirone DM, Gray DS, Bhadriraju K, Chen CS Cells Lying on a Bed of Microneedles: An Approach to Isolate Mechanical Force. Proc Natl Acad Sci (2003) 100:1484–9. doi:10.1073/pnas.0235407100
80. Stricker J, Aratyn-schaus Y, Oakes PW, Gardel ML Spatiotemporal Constraints on the Force-dependent Growth of Focal Adhesions. Biophysical J (2011) 100:2883–93. doi:10.1016/j.bpj.2011.05.023
81. Ghibaudo M, Saez A, Trichet L, Xayaphoummine A, Browaeys J, Silberzan P, et al. Traction Forces and Rigidity Sensing Regulate Cell Functions. Soft Matter (2008) 4:1836–43. doi:10.1039/b804103b
82. Polte TR, Eichler GS, Wang N, Ingber DE, Thomas R, Eichler GS, et al. Extracellular Matrix Controls Myosin Light Chain Phosphorylation and Cell Contractility through Modulation of Cell Shape and Cytoskeletal Prestress. Am J Physiology-Cell Physiol (2004) 286:C518–C528. doi:10.1152/ajpcell.00280.2003
83. Lo C-M, Wang H-B, Dembo M, Wang Y Cell Movement Is Guided by the Rigidity of the Substrate. Biophysical J (2000) 79:144–52. doi:10.1016/S0006-3495(00)76279-5
84. Ghosh K, Pan Z, Guan E, Ge S, Liu Y, Nakamura T, et al. Cell Adaptation to a Physiologically Relevant Ecm Mimic with Different Viscoelastic Properties. Biomaterials (2007) 28:671–9. doi:10.1016/j.biomaterials.2006.09.038
85. Paszek MJ, Zahir N, Johnson KR, Lakins JN, Rozenberg GI, Gefen A, et al. Tensional Homeostasis and the Malignant Phenotype. Cancer Cell (2005) 8:241–54. doi:10.1016/j.ccr.2005.08.010
86. Saez A, Buguin A, Silberzan P, Ladoux B Is the Mechanical Activity of Epithelial Cells Controlled by Deformations or Forces? Biophysical J (2005) 89:L52–L54. doi:10.1529/biophysj.105.071217
87. Califano JP, Reinhart-King CA Substrate Stiffness and Cell Area Predict Cellular Traction Stresses in Single Cells and Cells in Contact. Cel Mol Bioeng (2010) 3:68–75. doi:10.1007/s12195-010-0102-6
88. Hur SS, Jeong JH, Ban MJ, Park JH, Yoon JK, Hwang Y Traction Force Microscopy for Understanding Cellular Mechanotransduction. BMB Rep (2020) 53:74–081. doi:10.5483/BMBRep.2020.53.2.308
89. Mitrossilis D, Fouchard J, Guiroy A, Desprat N, Rodriguez N, Fabry B, et al. Single-cell Response to Stiffness Exhibits Muscle-like Behavior. Proc Natl Acad Sci (2009) 106:18243–8. doi:10.1073/pnas.0903994106
90. Müller C, Pompe T Distinct Impacts of Substrate Elasticity and Ligand Affinity on Traction Force Evolution. Soft Matter (2016) 12:272–80. doi:10.1039/C5SM01706H
91. Chan CE, Odde DJ Traction Dynamics of Filopodia on Compliant Substrates. Science (2008) 322:1687–91. doi:10.1126/science.1163595
92. Li Y, Bhimalapuram P, Dinner AR Model for How Retrograde Actin Flow Regulates Adhesion Traction Stresses. J Phys Condens Matter (2010) 22:194113. doi:10.1088/0953-8984/22/19/194113
93. Gardel ML, Sabass B, Ji L, Danuser G, Schwarz US, Waterman CM Traction Stress in Focal Adhesions Correlates Biphasically with Actin Retrograde Flow Speed. J Cel Biol (2008) 183:999–1005. doi:10.1083/jcb.200810060
94. Craig EM, Stricker J, Gardel M, Mogilner A Model for Adhesion Clutch Explains Biphasic Relationship between Actin Flow and Traction at the Cell Leading Edge. Phys Biol (2015) 12:035002. doi:10.1088/1478-3975/12/3/035002
95. Duke TAJ Molecular Model of Muscle Contraction. Proc Natl Acad Sci (1999) 96:2770–5. doi:10.1073/pnas.96.6.2770
96. Maraldi M, Valero C, Garikipati K A Computational Study of Stress Fiber-Focal Adhesion Dynamics Governing Cell Contractility. Biophysical J (2014) 106:1890–901. doi:10.1016/j.bpj.2014.03.027
97. McEvoy E, Deshpande VS, McGarry P Free Energy Analysis of Cell Spreading. J Mech Behav Biomed Mater (2017) 74:283–95. doi:10.1016/j.jmbbm.2017.06.006
98. McEvoy E, Deshpande VS, McGarry P Transient Active Force Generation and Stress Fibre Remodelling in Cells under Cyclic Loading. Biomech Model Mechanobiol (2019) 18:921–37. doi:10.1007/s10237-019-01121-9
99. Cao X, Lin Y, Driscoll TP, Franco-Barraza J, Cukierman E, Mauck RL, et al. A Chemomechanical Model of Matrix and Nuclear Rigidity Regulation of Focal Adhesion Size. Biophys J (2015) 109:1807–17. doi:10.1016/j.bpj.2015.08.048
100. Cao X, Ban E, Baker BM, Lin Y, Burdick JA, Chen CS, et al. Multiscale Model Predicts Increasing Focal Adhesion Size with Decreasing Stiffness in Fibrous Matrices. Proc Natl Acad Sci USA (2017) 114:E4549–E4555. doi:10.1073/pnas.1620486114
101. Gilkes DM, Xiang L, Lee SJ, Chaturvedi P, Hubbi ME, Wirtz D, et al. Hypoxia-inducible Factors Mediate Coordinated Rhoa-Rock1 Expression and Signaling in Breast Cancer Cells. Proc Natl Acad Sci (2014) 111:E384–E393. doi:10.1073/pnas.1321510111
102. Kim T-H, Vazquez-Hidalgo E, Abdou A, Tan XHM, Christodoulides A, Farris CM, et al. β-Adrenergic Signaling Modulates Cancer Cell Mechanotype through a RhoA-ROCK-Myosin II axis. bioRxiv (2019). doi:10.1101/777755
103. Chandra A, Butler MT, Bear JE, Haugh JM Modeling Cell Protrusion Predicts How Myosin Ii and Actin Turnover Affect Adhesion-Based Signaling. Biophysical J (2022) 121:102–18. doi:10.1016/j.bpj.2021.11.2889
104. Grahovac J, Becker D, Wells A Melanoma Cell Invasiveness Is Promoted at Least in Part by the Epidermal Growth Factor-like Repeats of Tenascin-C. J Invest Dermatol (2013) 133:210–20. doi:10.1038/jid.2012.263
105. Howard J Mechanics of Motor Proteins and the Cytoskeleton, Vol. 75. Berlin: Springer Berlin Heidelberg (2002). doi:10.1007/3-540-45701-1\\text{\\_}2
106. Cheng B, Wan W, Huang G, Li Y, Genin GM, Mofrad MRK, et al. Nanoscale Integrin Cluster Dynamics Controls Cellular Mechanosensing via FAKY397 Phosphorylation. Sci Adv (2020) 6:eaax1909. doi:10.1126/sciadv.aax1909
107. Kitamura K, Tokunaga M, Iwane AH, Yanagida T A Single Myosin Head Moves along an Actin Filament with Regular Steps of 5.3 Nanometres. Nature (1999) 397:129–34. doi:10.1038/16403
108. Kong F, García AJ, Mould AP, Humphries MJ, Zhu C Demonstration of Catch Bonds between an Integrin and its Ligand. J Cel Biol (2009) 185:1275–84. doi:10.1083/jcb.200810002
109. Carlier M-F, Romet-Lemonne G, Jégou A Actin Filament Dynamics Using Microfluidics. In: Methods in Enzymology, Vol. 540. Cambridge, MA, USA: Academic Press (2014). p. 3–17. chap. 1. doi:10.1016/b978-0-12-397924-7.00001-7
Keywords: cell mechanobiology, focal adhesions, traction forces, actin-myosin contractility, substrate stiffness
Citation: Vazquez-Hidalgo E, Farris CM, Rowat AC and Katira P (2022) Chemo-Mechanical Factors That Limit Cellular Force Generation. Front. Phys. 10:831776. doi: 10.3389/fphy.2022.831776
Received: 08 December 2021; Accepted: 26 January 2022;
Published: 18 February 2022.
Edited by:
Oleg V. Kim, University of Pennsylvania, United StatesReviewed by:
Alf Mansson, Linnaeus University, SwedenCopyright © 2022 Vazquez-Hidalgo, Farris, Rowat and Katira. This is an open-access article distributed under the terms of the Creative Commons Attribution License (CC BY). The use, distribution or reproduction in other forums is permitted, provided the original author(s) and the copyright owner(s) are credited and that the original publication in this journal is cited, in accordance with accepted academic practice. No use, distribution or reproduction is permitted which does not comply with these terms.
*Correspondence: Parag Katira, cGthdGlyYUBzZHN1LmVkdQ==
Disclaimer: All claims expressed in this article are solely those of the authors and do not necessarily represent those of their affiliated organizations, or those of the publisher, the editors and the reviewers. Any product that may be evaluated in this article or claim that may be made by its manufacturer is not guaranteed or endorsed by the publisher.
Research integrity at Frontiers
Learn more about the work of our research integrity team to safeguard the quality of each article we publish.