 Rajni Chahal
 Shubhojit Banerjee
 Stephen T. Lam
- Chemical Engineering, University of Massachusetts Lowell, Lowell, MA, United States
LiF–NaF–ZrF4 multicomponent molten salts are identified as promising candidates for coolant salts in molten salt reactors and advanced high-temperature reactors. This study focused on low-melting point salt compositions of interest: 38LiF–51NaF–11ZrF4, 42LiF–29NaF–29ZrF4, and 26LiF–37NaF–37ZrF4. Ab-initio molecular dynamics (AIMD) calculations were performed and compared with available experimental data to assess the ability of rigid ion models (RIM) to reproduce short- to intermediate-range structure, transport, and thermophysical properties of the LiF–NaF–ZrF4 salt mixtures. It is found that as ZrF4 mol% increases, the average cation–anion coordination number (CN) of monovalent cations (Li+, Na+) obtained from RIM calculations decreases, while multivalent Zr4+ CN varied from 15% to 19% in comparison to corresponding AIMD values. In addition, RIM is found to predict the existence of 7, 8, and 9 coordinated fluorozirconate complexes, while AIMD and the available experimental data showed an occurrence of 6, 7, and 8 coordinated complexes in the melt. The intermediate-range structure analysis revealed that while the RIM parameters are able to reproduce a local structure for lower ZrF4 mol% salts such as in 38LiF–51NaF–11ZrF4, an extensive fluorozirconate network formation is observed in RIM simulations for higher ZrF4 mol% compositions. The network generated by RIM parameters is found to be mainly connected by “corner-sharing” fluorozirconate complexes as opposed to both “edge-sharing” and “corner-sharing” connectively portrayed by AIMD. It is found that a close agreement between AIMD and the RIM salt structure for the 11-mol% ZrF4 salt resulted in good agreement in the calculated Zr diffusivities and the viscosity values. However, due to the inaccurate short- to intermediate-range structure prediction by RIM for higher ZrF4 mol% compositions, thermophysical properties such as densities and heat capacity differ by up to 26% and 27%, respectively, upon comparison with AIMD and experimental values. Also, the network-dominated properties such as diffusion coefficients and viscosities differed by up to two and three orders of magnitude, respectively. This study signifies the importance of accurate salt structure generation for an accurate prediction of transport and thermophysical properties of multicomponent molten salts.
1 Introduction
Molten salts are a promising class of ionic liquids for applications in advanced clean energy systems such as next-generation nuclear reactors and solar-thermal storage plants. Fluoride salts have been previously identified as good candidates for primary coolant applications in advanced high-temperature reactors (AHTR) [1] and molten salt reactors (MSR) [2]. Among them, ternary systems containing BeF2 and ZrF4 were recommended as coolant salts. While there has been significant interest in using BeF2-based salts due to their low neutron absorption, there remain substantial issues in using beryllium salts due to their toxicity and required processing facilities. As such, Zr salts present a compelling alternative due to their acceptable neutron economy, vapor pressures, thermal hydraulics, and lower costs [3]. In order to achieve low vapor pressure at higher temperatures (<1 mm Hg at 700°C–900°C), the ZrF4 mole fraction in the salt mixture should be maintained within ∼20%–45% [3]. Here, the eutectic compositions 26LiF–37NaF–37ZrF4 (mol%) and 42LiF–29NaF–29ZrF4 (mol%) with a freezing point around 436°C and 460°C, respectively, have been identified as promising candidates. The 38LiF–51NaF–11ZrF4 (mol%) salt composition is also considered in this study due to low ZrF4 mol%. Due to lack of data in thermophysical property databases [4], this salt composition has been recommended for further study [2]. The precise experimental interrogation of salt structure and properties is challenged by high-temperature conditions, cost, material handling, and difficulties in interpreting experimental data. Particularly, it is difficult to access the structure of multivalent cations using techniques such as Raman spectra and EXAFS alone due to their existence in multiple coordination states and intermediate-range ordering [5–7]. Therefore, ab-initio and classical molecular dynamics simulations can be used to interpret experimental data and predict temperature-dependent structures, transport, and thermophysical properties of LiF–NaF–ZrF4 molten salts.
AIMD simulations have been shown to accurately predict the salt structure and transport properties of binary and ternary fluoride salts [8, 9]. This provides further motivation for using AIMD to study the structure, transport, and thermophysical properties of LiF–NaF–ZrF4 molten salt. Despite the accurate salt structures and property prediction by AIMD, the computational cost of AIMD simulations limits their use in terms of system size (a few hundred atoms) and timescale (picosecond). Therefore, the classical molecular dynamics calculations using a well-fitted interatomic potential can be quite useful. In classical molecular dynamics modeling of ionic liquids involving multivalent charged species, accurately capturing the charge–dipole and dipole–dipole polarizability effects is essential for generating an accurate salt structure [10]. As the properties such as diffusion coefficients, conductivity, and viscosity of the salt melt are strongly influenced by the formation of coordination complexes, their lifetime, and the degree of their connectivity (network formation) [11], it is crucial to regenerate the correct short- to intermediate-range structure using the interatomic potential in classical molecular dynamics simulations. However, correctly accounting for all pair interactions in multivalent cations can be a tedious and challenging process as it depends on the quality of both force fitting and dipole fitting. Additionally, the quality of experimental and first-principle data used for parameter optimization further affects the accuracy of the developed rigid ion model force field.
In the past, the rigid ion model potential has shown great promise in the simulations of multicomponent molten salts involving multivalent cations [11, 12]. Efforts have been made to develop RIM parameters for the configurations LiF, NaF, KF, ZrF4, LiF-ZrF4, and NaF-ZrF4 using a force-fitting procedure [13]. While the fitted RIM parameters were used by Salanne et al. [14] to study electrical conductivities of molten LiF–NaF–ZrF4 mixtures, a detailed study on the salt structure and its effect on the properties such as heat capacity and viscosity is yet to be reported.
In this study, classical molecular dynamics using the rigid ion model [13] was used to first explore the salt structure of 38LiF-51NaF-11ZrF4, 42LiF-29NaF-29ZrF4, and 26LiF-37NaF-37ZrF4 at 750°C, 727°C, and 700°C, respectively. These predictions were evaluated against Born–Oppenheimer ab-initio molecular dynamics simulations. The first part of this study focuses on determining and comparing the short- to intermediate-range structure/network formation in the LiF-NaF-ZrF4 salt melt using both AIMD and RIM interatomic potential molecular dynamics (IPMD) simulations. In order to study the effect of structures on properties, diffusivity and thermophysical properties are evaluated. In doing so, the second part incorporates the evaluation of ionic diffusivity, diffusion coefficients, densities, viscosity, and heat capacity. The RIM-calculated values are compared with the calculated AIMD values and available experimental data. The effect of salt structure generated by RIM parameters on the calculated properties is discussed in each section.
2 Computational Methods
2.1 Ab-Initio Molecular Dynamics Simulations
Born–Oppenheimer AIMD simulations were performed using the Vienna Ab-Initio Simulation Package (VASP) with the projector-augmented wave (PAW) method, a plane-wave basis set, and the Perdew–Burke–Ernzerhof (PBE) generalized-gradient-approximation (GGA) exchange correlation functional [15, 16]. PAW-PBE potentials provided by VASP were used for Li_sv (1s22s1), Na_sv (2s22p63s1), Zr_sv (4s24p64d25s2), and F_s (2s22p5). A plane-wave basis set with an energy cutoff of 650 eV was used. The convergence criterion of 1E-5 eV was set for electronic self-consistent steps. A gamma-centered 1 × 1 × 1 k-point mesh was used for reciprocal space sampling. The parameters chosen yielded convergence within 2 meV/atom and is in agreement with previous studies [17]. Charges were calculated within the VASP code. The density functional theory (DFT)-D3 formulation proposed by Grimmes [18] was used to account for the effect of dispersion interactions. Three different compositions of LiF–NaF–ZrF4 mixtures are considered in this study. The salt systems were generated by randomizing the atom positions in a simulation box with periodic boundary conditions [19]. Simulation cells contained 17 Li, 23 Na, 5 Zr, and 60 F atoms (Composition A: 38LiF–51NaF–11ZrF4), 13 Li, 9 Na, 9 Zr, and 58 F atoms (Composition B: 42LiF–29NaF–29ZrF4), and 7 Li, 10 Na, 10 Zr, and 57 F atoms (Composition C: 26LiF-37NaF-37ZrF4). All calculations were performed allowing for spin polarization. The canonical ensemble (NVT) using a Nosé–Hoover thermostat [20] was employed. The integration time step of 2 fs was used for all the calculations. All simulations were run for 40–80 ps, and the system is allowed to equilibrate for at least 20 ps before the structure and property evaluation. Reported equilibrium densities were calculated based on the equation of state fit on 5-6 volumes, as described in [21]. The calculated equilibrated densities obtained from the AIMD are reported in Section 3.3.1.
2.2 Classical Molecular Dynamics Modeling Using Rigid Ion Model Potential
The rigid ion model potential is used to study the three compositions of interest and was performed using CP2K [22]. The simulation cell size for RIM-IPMD calculations for all three compositions was eight times that of the AIMD simulations. The interatomic interactions are defined using RIM potential developed in Ref. [13]. Formal charges were used for F (-1), Li (+1), Na (+1), and Zr (+4). For a direct comparison with the first-principle calculations, the simulations were conducted at densities estimated by both additive molar volume density and equilibrium AIMD calculations. These simulations were used for sampling from over 4-ns trajectories each. Additionally, for each composition, the equilibrium system densities were also obtained by equilibrating the salt in the NPT ensemble fixed at atmospheric pressure using a Nosé–Hoover thermostat and barostat [20].The equilibrated densities obtained from the RIM parameters are reported in Section 3.3.1. Ovito [23] and Vesta [24] were employed for visualization.
3 Results and Discussion
3.1 Salt Structure Analysis
The local coordination behavior in the salt was analyzed and compared using radial distribution function and cation–anion coordination numbers. The Zr–Zr RDFs were examined to observe the presence of fluorozirconate network formation. Further, the angle distribution function was introduced to discuss the fluorozirconate complex connectivity. The intermediate-range structure was examined by snapshots from both RIM and AIMD trajectories, and the fluorozirconate chains were quantified to evaluate the percentage of Zr involved in them. As the ionic charges were not estimated from AIMD, the specified charges while discussing AIMD results only refer to the formal charge on ions for convenience such as that used in [8, 25, 26].
3.1.1 Local Coordination Behavior
The local coordination behavior of cation–anion is depicted using the partial radial distribution function (RDF) and cation–anion coordination numbers. Figure 1 compares the cation–anion partial RDFs as obtained from AIMD and IPMD simulations for each composition. In all cases, the RDF peak for the F–Zr pair is more intense and has a smaller width, which suggests a strong association between F and Zr in the melt. Much broader peaks for F–Na and F–Li suggest comparatively weak interactions among the respective cation–anion pairs. A very low minimum in the F-Zr RDF plot indicates strong solvation with limited exchange of fluorine from the Zr first solvation shell. However, a much higher minimum in the F–Na and F–Li plot suggests weak solvation allowing a rapid exchange of “free” and coordinated fluoride ions. Also, a smaller value of the first peak radius, ravg,F-Zr = 2.04 Å, further supports a stronger association between F and Zr in the molten salt mixture. Similar observations have been made by Salanne et al. for a different LiF–NaF–ZrF4 salt composition studied using RIM potential parameters [14].
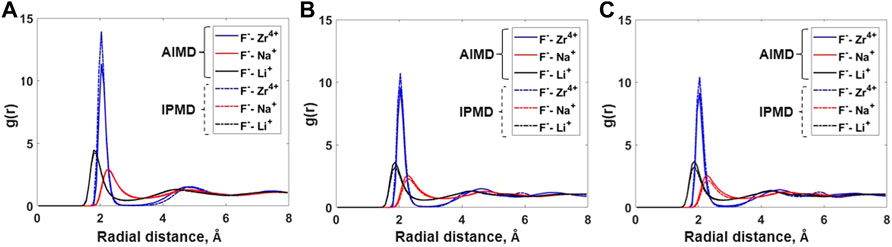
FIGURE 1. Comparison of cation–anion radial distribution functions for (A) Composition A at 750°C, (B) Composition B at 727°C, and (C) Composition C at 700°C between AIMD and RIM IPMD calculations.
Overall, the peak positions in the cation–anion RDFs are similar for both AIMD and IPMD calculations. However, the F–Zr peak heights for IPMD calculations are higher than those of AIMD, resulting in higher F–Zr coordination numbers as reported in Table 1, which is discussed in the upcoming section.
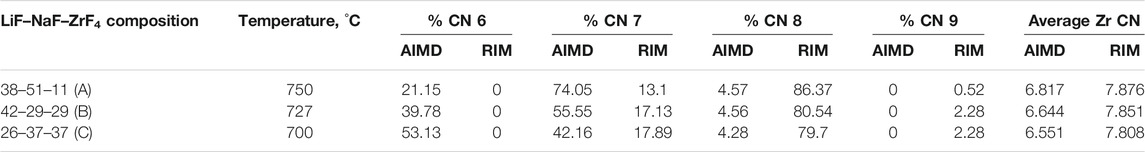
TABLE 1. Zr Coordination number as calculated by AIMD and RIM-IPMD.
Table 1 reports and compares the average F–Zr coordination numbers (CN) and the % of individual complexes in the AIMD- and RIM-IPMD-simulated structure. CN calculation is based on rcut,F-Zr = 2.84 Å, which is the first minimum in the F-Zr RDF curve. The coordination number was averaged over all Zr atoms over equilibrated trajectories. Supplementary Figure S1 can be referred to for the %CN complexes plotted over the equilibrated trajectory from AIMD for composition C. In AIMD calculations, the Zr coordinations of 5, 6, 7, and 8 were observed as [ZrF5]- [ZrF6]2- [ZrF7]3-, and [ZrF8]4-, respectively, during the 60-ps simulation trajectory. The 5-coordinated species are short-lived (<200 fs) and may have occurred due to thermal vibrations considering the higher simulation temperatures. It is in agreement with the Zr coordination values of 6, 7, and 8 obtained from the Raman spectrum measurements of LiF–NaF–ZrF4 melt with ZrF4 mol% varying from 14% to 40% [27]. On the other hand, Zr coordination numbers of 7, 8, and 9 were observed in RIM-IPMD calculations with [ZrF7]3-, and [ZrF8]4- occurring as dominating species. Overall, the AIMD melt consists of 6 (octahedral), 7, and 8 coordination zirconium fluoride complexes (Figure 2A), while RIM simulated trajectories comprised 7, 8, and 9 coordination zirconium fluoride complexes (Figure 2B).
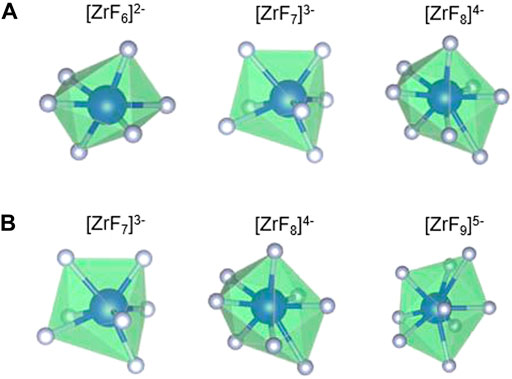
FIGURE 2. Fluorine zirconium complexes observed in (A) AIMD-simulated and (B) RIM-IPMD-simulated LiF–NaF–ZrF4 salt compositions.
The average Zr–F coordination number is decreasing as the ZrF4 mol% increases, which is observed from both AIMD and RIM IPMD calculations. This is caused by the decreasing F/Zr ratios with the increase in Zr mol%. As ZrF4 is more fluoroacidic, it binds more readily to the “free” fluorines, resulting in higher values of average Zr coordination number [28]. With the increase in number of Zr in the melt, fewer F per Zr are available to form a higher coordinated complex, while when the Zr concentration in the mix is less, more F atoms are available per Zr atom which leads to formation of a higher coordinated complex as observed in composition A in both AIMD and RIM IPMD calculation. This is also evidenced by an increase in the percentage of higher coordinated complexes as ZrF4 mol% goes down (Table 1). However, this trend is similar in AIMD and RIM calculations, the average Zr–F coordination number predicted by RIM is consistently higher than that calculated in AIMD for all three compositions. It can be noted that deviation in RIM and AIMD-calculated Zr CN grows from 15% to 19% going from compositions A to C (increasing ZrF4 mol%). The occurrence of higher Zr–F coordination numbers in RIM simulations was also previously pointed out based on the F–Zr cation–anion RDF discussion.
Some inconsistencies in the coordination number of Li and Na are also observed between AIMD and RIM-generated structures, which are reported in Table 2. The Li–F and Na–F cutoff distances were calculated based on the first minimum in their respective RDF curves, which are also reported in the same table. For both AIMD and RIM, the cutoff distances agree well and indicate a shift to the right going from compositions C to A. It should be noted that the shift could also be caused due to relatively higher temperatures considered for compositions A and B. The reported CN for both monovalent cations is calculated by averaging over equilibrated trajectories. For lower ZrF4 mol% as in composition A, the differences in the CN of both cations are less than 2%. For 37 ZrF4 mol% (composition C), the differences between RIM and AIMD values of Li and Na CN grow to 7%. This trend is similar to that observed for the Zr–F CN obtained from the AIMD and RIM study. Nevertheless, the deviation in CN of Zr (15%–19%) is higher compared to that observed for monovalent cations (up to 7%).
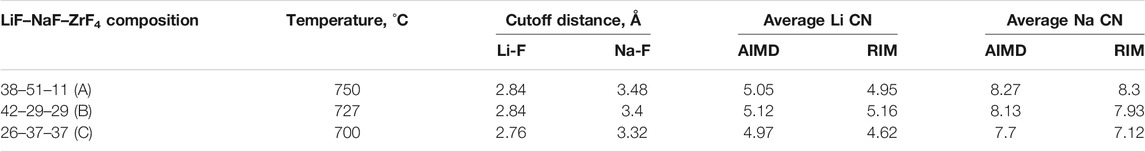
TABLE 2. Li and Na coordination number as calculated by AIMD and RIM-IPMD.
The differences in coordination behavior can be explained by examining the repulsion and columbic terms in the RIM potential. In general, the short-range structural properties are dominated by the competition between the overlapping repulsion and the Columbic interactions. Specifically, the electrostatic term has a role in inducing the ordering effects around an ion, which decides the cation-ion coordination number. As the RIM-calculated CNs disagree with the reference AIMD values, a refitting of the mentioned short-range terms could lead to better prediction of CNs [29]. However, such refitting would likely result in loss of generality of the RIM toward other compositions and mixtures of LiF–NaF–ZrF4. In our study, the higher deviation (between AIMD and RIM) in CN of Zr (15%–19%) compared to monovalent cations (up to 7%) indicates a comparatively poorly fitted short-range interaction terms for F–Zr interactions.
In addition to cation–anion RDFs, the Zr–Zr RDFs are also examined in order observe the occurrence of fluorozirconate network formation (Figure 3). The pre-peak between 3 and 5 Å in the Zr–Zr RDF plot occurred due to the bridging fluorine connecting the two Zr atoms from two adjacent [ZrFx4−x] polyhedrons. It should be noted that the pre-peak in Zr–Zr RDF grows stronger with the increase in ZrF4 mol% for both AIMD and RIM calculations. Overall, the Zr–Zr pre-peak observed in RIM calculations is quite sensitive to the ZrF4 mol% when compared to AIMD calculations. In the case of higher ZrF4 mol% as in compositions B and C, RIM-IPMD Zr–Zr pre-peak is quite prolific compared to that observed in the AIMD calculation, indicating an overprediction of network formation in the RIM simulations. To our knowledge, the intermediate-range salt structure and Zr–Zr RDF have not been reported in the literature when ZrF4 mol% is higher than 10% in this ternary salt system.
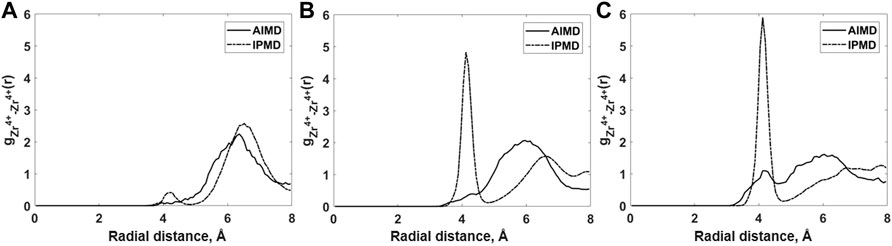
FIGURE 3. Comparison of Zr–Zr radial distribution functions for (A) Composition A at 750°C, (B) Composition B at 727°C, and (C) Composition C at 700°C between AIMD and RIM IPMD calculations.
The Zr–Zr pre-peak completely disappears for composition A in which the ZrF4 concentration is 11%, which suggests no chain formation in AIMD simulation. A similar behavior is observed in the RIM-IPMD Zr–Zr RDF plot. A much smaller pre-peak observed in our RIM simulations for lower ZrF4 is also in agreement with a study from Rollet et al. [30]. A close agreement between RIM and AIMD structure for composition A indicates that the RIM parameters are acceptably reproducing the salt structure in case of low Zr mol% in the salt melt, i.e., when polarizability effects are relatively mild. Both RIM-IPMD and AIMD simulations suggest that at lower concentrations of ZrF4 in this ternary salt mix, the mixture tends to behave as a well-dissociated ionic melt consisting of Li+, Na+ [ZrFx4−x], and F− ions.
Based on RDF and coordination analysis, the inclusion of ZrF4 in the salt melt forms the [ZrFx4−x] complexes in the melt. Thereafter, the increase in ZrF4 mol% leads to an increase in the connection formed by [ZrFx4−x] leading to the formation of larger [ZrFx4−x]n chains, as is realized in Figure 3. The occurrence of fluorozirconate chains in this study is in agreement with the chain formation reported from NMR spectra of LiF–ZrF4 melts [31].
3.1.2 Angular Distribution Function: Fluorozirconate Complexes Connectivity
The angular distribution functions for F–Zr–F and Zr–F–Zr provide information on the individual [ZrFx4−x] complexes and their connectivity in the [ZrFx4−x]n chain, respectively. Figures 4A,B shows and compares the F–Zr–F angle distribution between three compositions as obtained from AIMD and RIM-IPMD calculations. The first peak in the F–Zr–F angle distributions provides the angle formed by adjacent fluorines with the central Zr in a fluorozirconate complex. With the decrease in Zr concentration (increase in F/Zr ratio), the first peak in the F–Zr–F angle distribution plot shifts to the left from the peak value of 81.9°–76.5° between composition C and composition A as observed for AIMD calculations (Figure 4A). This shift points to a decrease in the mean value of the F–Zr–F angle due to increased average Zr coordination number. This observation is consistent with the Zr coordination values reported in Table 1. A similar behavior is observed in the plot obtained from RIM-IPMD calculations (Figure 4B). However, due to the higher average Zr CN reported by RIM, the first peak is located at angles lowered by up to 8° compared to the corresponding values obtained from AIMD for each composition. For RIM calculations, the first peak shift between composition C and composition A is negligible, which is also corroborated by a small change in average Zr coordination number between compositions C and A as obtained from RIM calculations (Table 1).
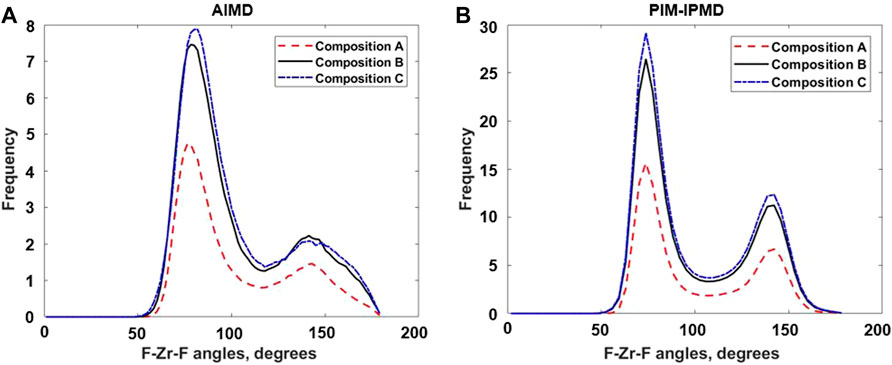
FIGURE 4. F–Zr–F Angle distribution from (A) AIMD calculations and (B) RIM-IPMD calculations. Angles obtained from RIM-IPMD are normalized by simulation box size factor of 8.
Figure 5 displays the 2D density plots for θZr-F-Zr plotted against Zr–Zr distances (dZ-Zr) in an AIMD simulation for compositions B and C. Here, θZr-F-Zr angles are formed between two fluorozirconate complexes connected by a bridging fluorine atom, while dZ-Zr is the distance between the Zr atoms from the connected fluorozirconates. The histograms along the abscissa and ordinate are the addition of all the bin values along the corresponding directions. The two distinct peaks in θZr-F-Zr angle distribution corresponding to the high-density region in the corresponding density plot indicate the presence of edge-sharing and corner-sharing complexes as observed in AIMD simulation. The number of face-sharing complexes is almost negligible for both the compositions as indicated by a sparse region in the density plot and supported by no distinctive third peak in the angle distribution. The corner-sharing complex average connectivity angle is ∼145° while the angle is nearly 110° for edge-sharing complexes. Both compositions B and C show a network connected via corner sharing and edge sharing. No such analysis was done for composition A as no chain formation (hence, no bridging fluorine) was observed in this case resulting in a negligible number of short-lived Zr-bridging F–Zr triplets. Compared to composition C, a lower number density is observed for composition B due to a low number of Zr-bridging F–Zr triplets (Figure 4).
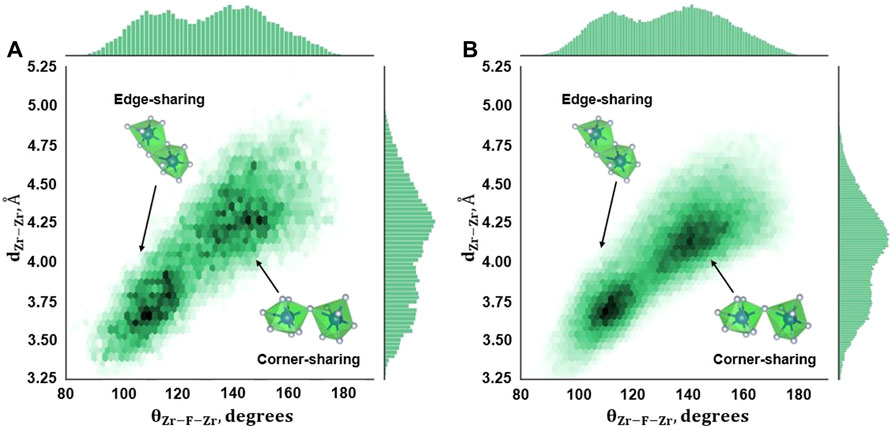
FIGURE 5. Zr–F–Zr Angle distribution from AIMD calculations for (A) Composition B, 727°C, and (B) Composition C, 700°C.
The θZr-F-Zr and dZr-Zr plot for RIM IPMD calculations (Figure 6) looks significantly different from that obtained from AIMD calculations. The presence of only one major peak in θZr-F-Zr and dZr-Zr histograms corresponds to one dense region in the density plot. This implies the absence of edge-sharing connectivity between the two adjacent fluorozironates in the network for compositions B and C. Even though Figures 3B,C suggested an overprediction of the fluorozirconate network in RIM-IPMD simulations, the whole network is largely connected by corner-sharing complexes. It could be caused due to the exclusion of higher-magnitude dipole moment values during the dipole-fitting process when optimizing the parameters for the polarization term by Salanne et al. [13]. In multivalent compounds such as ZrF4, the polarization of F− plays a key role in local structure by screening the repulsive electrostatic interactions between two Zr4+ cations in the anion coordination shell. The exclusion of higher-magnitude dipole moment values during potential fitting may result in less F− polarization effect leading to less shielding between Zr4+ and Zr4+ connected by bridging fluorine, which in turn results in larger values of θZr-F-Zr and dZr-Zr (corner-sharing zone). Consequently, a low-density region is observed at smaller values of dZr-Zr and θZr-F-Zr (edge-sharing zone).
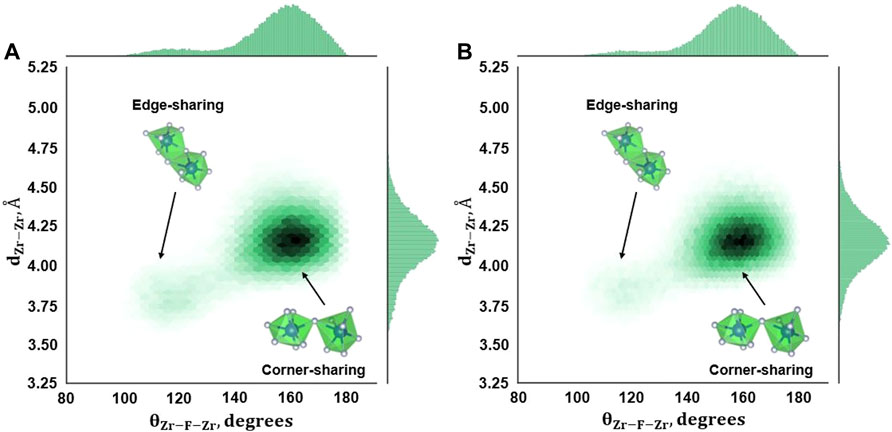
FIGURE 6. Zr–F–Zr Angle distribution from RIM-IPMD calculations for (A) Composition B, 727°C, and (B) Composition C, 700°C.
3.1.3 Intermediate-Range Fluorozirconate Chain Formation
Qualitatively, intermediate-range fluorozirconate chain formation can be visualized from equilibrated AIMD and RIM simulation trajectories. Figure 7 and Figure 8 show the snapshots from AIMD and RIM simulations, respectively. For both compositions B and C, AIMD shows the formation of fluorozirconate chains ([ZrFx4−x]n) constructed by edge- and corner-sharing polyhedrons as observed in Figures 7B,C. In comparison, the RIM-generated network is mainly connected by the corner-sharing polyhedrons in both compositions B and C (Figures 8B,C). Such differences in network connectivity were also observed from Figure 5 and Figure 6 based on the θZr-F-Zr vs. dZr-Zr density plots. For compositions B and C, Figures 8B,C confirm an overprediction of network by RIM when compared to AIMD snapshots (Figures 7B,C). For lower 11 mol% ZrF4 (composition A), both AIMD and RIM snapshots (Figure 7A and Figure 8A) show no such long-lived chain formation.
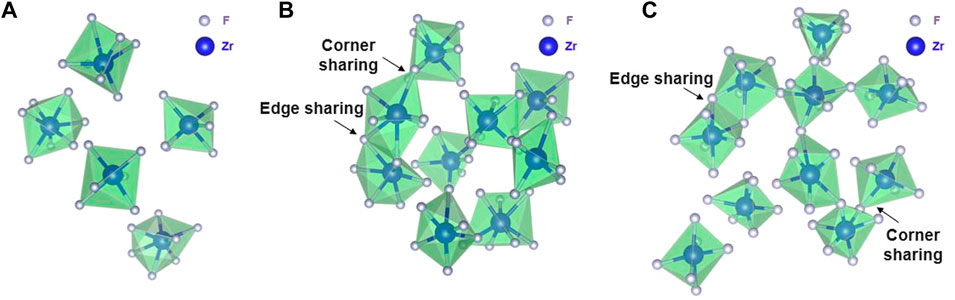
FIGURE 7. Snapshots from AIMD calculations showing (A) no chain formation in Composition A at 750°C, (B) a short fluorozirconate chain ([ZrFx4−x]n) in Composition B at 727°C, and (C) a long fluorozirconate chain ([ZrFx4−x]n) in Composition C at 700°C. Chain is created by edge and corner-sharing among 6-, 7-, and 8-fold coordinated fluorine zirconium complexes. Na, Li, and “free” fluorine atoms are removed during visualization.
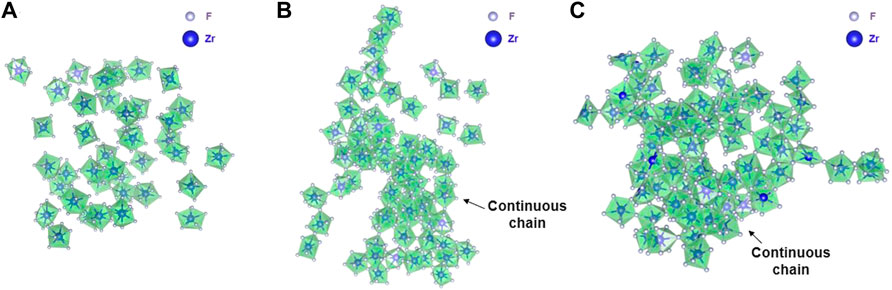
FIGURE 8. Snapshots from RIM-IPMD calculations showing (A) no chain formation in Composition A at 750°C, (B) a long continuous fluorozirconate chain ([ZrFx4−x]n) involving 91% of Zr (65/72) in Composition B at 727°C, and (C) a long continuous fluorozirconate chain ([ZrFx4−x]n) involving ∼99% of Zr (89/90) in Composition C at 700°C. Chain is created by edge and corner-sharing among 7-, 8-, and 9-fold coordinated fluorine zirconium complexes. Na, Li, and “free” fluorine atoms are removed during visualization.
In order to quantify the fluorozirconate chain lengths, the number of Zr atoms (representing count of fluorozirconate complexes) in the two largest chains (Chain 1: longest chain and Chain 2: second longest chain) was counted. Supplementary Figure S2 plots and compares the values of number of Zr involved in the longest chain (a.k.a., Chain 1) formation for each composition during equilibrated simulation trajectories from the respective AIMD and RIM-IPMD calculations. The values averaged over AIMD and RIM trajectories for both chains (Chain 1: longest chain and Chain 2: second longest chain) are reported in Table 3. For composition C, AIMD predicts ∼67% of Zr atoms (i.e., 6–7 Zr atoms out of a total of 10) involved in the longest chain formation, while RIM-IPMD calculations indicate more than 98% Zr (i.e., 79 Zr atoms out of a total of 80) involved in the longest chain formation. Similarly for 29 ZrF4 mol% as in composition B, AIMD predicts ∼26% of Zr atoms (i.e., two to three Zr atoms out of a total of 9) involved in the chain formation, while RIM-IPMD calculations indicate more than 92% Zr (i.e., 66–67 Zr atoms out of a total of 72) involved in the chain formation. The decrease in % of Zr in the network formation in composition B compared to composition C can also be noticed by the comparatively lower number density of Zr-bridging F–Zr triplets in Figure 5A and Figure 6A compared to Figure 5B and Figure 6B, respectively.
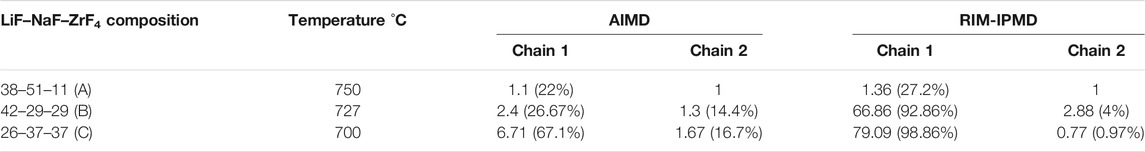
TABLE 3. % of Zr involved in flurozirconate chain formation as calculated by AIMD and RIM-IPMD.
Both AIMD and RIM suggest no long-lived chain formation for lower ZrF4 mol% as can be noticed in the snapshots for composition A in Figure 7A and Figure 8A. For instance, Table 3 reports that AIMD showed the longest chain (Chain 1) to be consisting of nearly 1 Zr, indicating the presence of isolated fluorozirconate complexes in composition A. On the other hand, a value of 1.36 for average Zr atoms involved in the longest chain indicates a short-lived chain formation including between one and two fluorozirconate complexes in the RIM simulated trajectories.
Overall, the network structure predicted by RIM for salts with lower ZrF4 mol% (composition A) is in close agreement with that obtained from AIMD, whereas there is an overprediction of network formation when using RIM parameters for higher ZrF4 mol% (compositions B and C). In addition, for both compositions B and C, RIM shows similar motifs containing a continuous fluorozirconate network spread across the periodic boundaries of a larger simulation cell (Figures 8B,C), which may affect the transport and thermophysical properties of the salt melt as discussed in Section 3.2 and Section 3.3. It should be noted that during the RIM force-field fitting, the dispersion parameters were not fitted directly from the first-principle calculations and instead were adjusted later to reproduce the experimental density of the pure compounds. It is known that dispersion parameters along with the polarization term also play a crucial role in the intermediate salt structure of multicomponent salts involving multiply charged species [11]. Recently, the discrepancies in the cation coordination numbers and structures due to inaccurate rigid ion model (RIM) parameters for NaCl and FLiNaK molten salt were pointed out by Lee et al. [29], which were fixed upon reparametrizing the RIM force-field parameters. While it suggests that a similar re-parameterization of RIM parameters for the LiF–NaF–ZrF4 salt system while implicitly including the dispersion effects may lead to obtaining an accurate short to the intermediate-range salt structure, the transferability of the refitted force-field parameters would be compromised. In quest to obtain an AIMD-accurate salt structure in comparatively efficient molecular dynamics simulations, recent success of AIMD-trained neural network potentials for salts containing divalent Be2+ cations [32, 33] also provides motivation for the use of machine-learned force-field for ZrF4 molten salts.
3.2 Self-Diffusion Coefficients
In order to study the effect of salt structure on the transport properties, the diffusion coefficients of Zr4+ are evaluated from AIMD and RIM simulations. In order to obtain diffusion coefficients, mean squared displacement (MSD) calculated using the block-averaging method (Eq. 1) [34] was used in the Einstein equation (Eq. 2). In the block-averaging scheme, the equilibrated simulation trajectory was divided into nearly 10 equal blocks (nt). The MSD vs. time curve was fitted for all but initial steps to avoid the initial quadratic region in the MSD plot. The remaining data are fitted to obtain diffusion coefficients for each block. The final diffusion coefficient is calculated as the average of values from each block. The error on DZr4+ for each block is calculated based on the 95% confidence interval and is finally averaged over the block count. It should be noted that the relative uncertainties are smaller for RIM-IPMD calculations due to better sampling in the larger simulation cell.
Table 4 compares the diffusion coefficients for Zr4+ as calculated from AIMD and RIM-IPMD simulations. For direct comparison, the diffusion coefficients reported in Table 4 were evaluated at the same densities (ρAIMD) for both AIMD and IPMD calculations, while the values calculated at RIM equilibrated densities (ρRIM) are reported in Supplementary Table S1. For composition A, the RIM-calculated diffusion coefficient is nearly 56% lower than the AIMD value, which is caused due to higher Zr coordination complexes (Table 1) and short-lived chain formation involving ∼27% of Zr on average (Table 3). Zr diffusion coefficient values for compositions B and C are lower by one and two orders of magnitude, respectively, compared to the corresponding AIMD values. A previous study involving a smaller system size comprising 574 atoms for composition B [14] reported the Zr4+ diffusion coefficient as nearly 5 × 10⁻⁶ cm2/s, which differs slightly from the value of 0.43 ± 0.14×10⁻⁶ cm2/s calculated in this study. The observed discrepancies may be caused due to the smaller system size and comparatively shorter simulation length (∼2 ns) in [14], which may have resulted in higher sampling uncertainty (not reported in Ref. [14]). This can have a significant effect where diffusivities are relatively low due to the formation of intermediate-ranged structures.
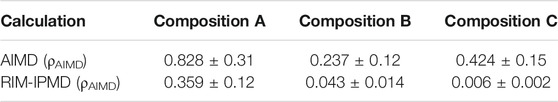
TABLE 4. DZr4+ × 105 (cm2/s) values as calculated from AIMD and RIM-IPMD simulations.
Overall, the disagreement in diffusivities as calculated from our RIM-IPMD and AIMD simulations is caused due to the unrealistic and long-lived continuous network formation observed from the RIM-IPMD-generated salt structure (Figures 8B,C). Such large discrepancies in the diffusion coefficient emphasize the importance of accurate intermediate-range structure prediction.
3.3 Thermophysical Properties
In this section, the densities from the three salt compositions as obtained from the AIMD and RIM calculations are reported and discussed. Both viscosity and heat capacity values are evaluated using the RIM parameters, and the values will be compared with the available experimental data.
3.3.1 Density
The equilibrated densities for compositions A, B, and C at 750°C, 727°C, and 700°C, respectively, are reported in Figure 9. For each case, RIM-IPMD-calculated densities are higher than the AIMD-calculated values. Both AIMD and the additive molar volume calculation of density are higher than the available experimental data for composition C at 700°C. For this composition, AIMD predicts the density nearly 11% higher than the experimental value while RIM overpredicts the density by ∼26%. The density prediction from AIMD is previously reported to be greatly influenced by the choice of dispersion interactions included in the DFT calculation [35]. A comparative study involving different dispersion methods such as vdW-DF, DFT-D3, and DFT-D2 can be nontrivial. As the current AIMD density is in reasonable range corresponding to experimental values, no such comparison is included. Regardless, the RIM parameters are further overpredicting the density by ∼26% compared to the experimental value. No uncertainty values were reported for the experimental measurement, while the densities estimated from the additive molar volume are considered to be within 5% of the experimental values [36]. The uncertainty values for both RIM and AIMD are based on the 95% confidence interval of the mean estimate. No simulation as well as experimental data for densities are available for comparison for compositions A and B.

FIGURE 9. Density prediction comparison.
3.3.2 Viscosity
In RIM-IPMD simulations, the Green–Kubo method is used to evaluate the viscosity by calculating the time integral of the shear stress autocorrelation function (ACF) as shown in Eq. 3:
where V is the volume of the simulation cell, kB is the Boltzmann constant, T is the temperature, and σαβ is one of the components of the stress tensor. For better statistics, the ACF is averaged over five stress components being σxy, σxz, σyz, σxx-yy, and σ2zz-xx-yy. The stress tensor data were obtained from RIM-IPMD run from nearly 10-, 8-, and 24-ns simulations for compositions A, B, and C, respectively, at their equilibrium densities. In each case, ACF is calculated by dividing the simulation trajectory in two halves. It can be noted that even after significantly longer simulation times, the stress ACF is not converging to zero, hence delaying the plateau behavior in the viscosity values. It is also observed by other researchers while simulating a highly polymerized system such as LiF-BeF2 [37]. Figure 10 reports the ACF and viscosity values evaluated from Eq. 3 for each composition using RIM parameters.
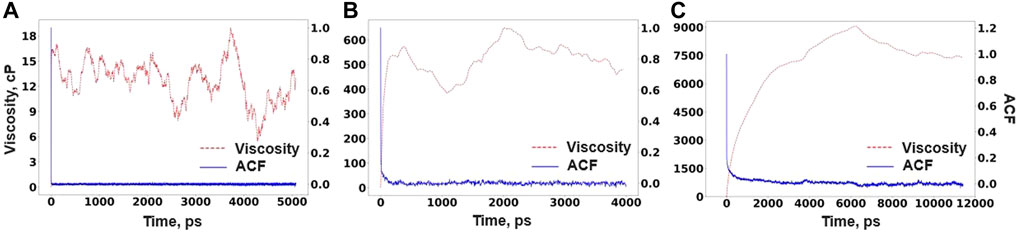
FIGURE 10. Viscosity and ACF for (A) Composition A at 750°C, (B) Composition B at 727°C, and (C) Composition C at 700°C as obtained from RIM-IPMD calculations.
It can be noted that the viscosity values for composition C drastically surpass its experimental value of 6.9 cP reported at 700°C [38] by nearly two orders of magnitude. It can be explained from the perspective of long-lived extensive network formation (Figure 8) and significantly lower Zr self-diffusivities (Table 4) observed from RIM-IPMD calculations. Clearly, an unrealistic overprediction of network formation significantly affects the viscosity of the melt. Similarly, as composition B also showed extensive network formation by involving nearly 93% of Zr in the longest chain formation (Table 3), the predicted viscosity values are still higher by an order of magnitude. Due to a better agreement between AIMD and RIM-IPMD regarding network formation in composition A (11 mol % of ZrF4), the viscosity value is nearly 10 cP. As such, no experimental data for viscosities are available for comparison for compositions A and B. As previously observed for Flibe [37] and NaF-ZrF4 [38], viscosity values tend to decrease with the decrease in the mol% of network-forming multivalent cations. Following such trend, the viscosity values for composition A would be expected to be lower than the experimental value of 6.9 cP for composition C. A comparatively higher value of viscosity calculated from the RIM simulation of composition A can be due to the higher coordination number of Zr (Table 1) and short-lived chain formation involving ∼27% of Zr in the melt (Table 3).
3.3.3 Specific Heat Capacity
The heat capacity values for all three compositions are evaluated from RIM-IPMD calculations from nearly 2-ns NPT calculations performed at five different temperatures. For composition A, NPT simulations were performed at 750°C–950°C with 50° intervals. For composition B, specific enthalpies were calculated from NPT simulations performed at 727°C, 777°C, 800°C, 850°C, and 900°C, while 700°C, 750°C, 800°C, 850°C, and 900°C temperatures were considered for composition C. For each calculation, the pressure was targeted to 1 atm. The specific enthalpies were calculated using ACF, and the error bars were estimated based on the 95% confidence interval from the mean estimated values. For compositions A and B, the specific enthalpies follow a linear trend when calculated between the given temperature range as shown in Figures 11A,B, indicating a constant value of Cp within the temperature range. Weighted least square regression was used to obtain a linear trend between specific enthalpies and temperature for each composition. A similar linear trend in specific enthalpies and temperature for short temperature ranges (200°C–300°C) at higher temperatures (>Tmelt) was noticed in previous literature [13, 39–43], while a nonlinear relationship was obtained when fitting to a wider temperature range [37, 38, 44, 45]. For composition C, a second-order polynomial fit better described the specific enthalpies and temperature trend in temperature range of 700°C–900°C (Figure 11C). The slope of the fitted specific enthalpy vs. temperature correlation gives specific heat capacity as described in Eq. 4:
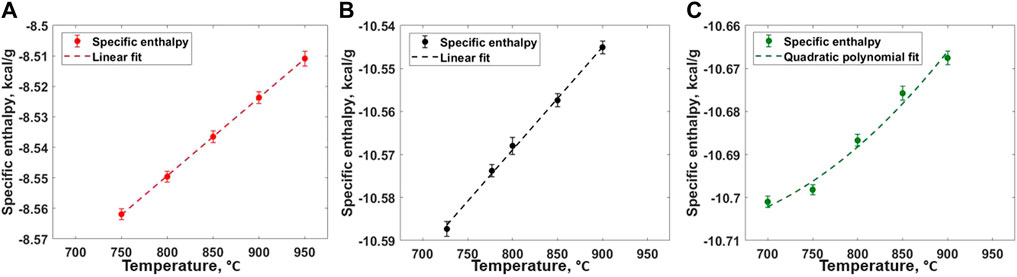
FIGURE 11. Specific enthalpy of salt melt for (A) Composition A (B) Composition B, and (C) Composition C as obtained from RIM-IPMD calculations.
The specific heat capacities values of 0.256 ± 0.002 and 0.24 ± 0.006 cal/gm-°C were obtained for compositions A and B, respectively. It should be noted that the constant values of specific heat capacity only represent the approximate Cp vs. T trend in the considered temperature ranges. For composition C, Eq. 5 describes the linear correlation between Cp and T in the temperature range of 700°C–900°C. The reported uncertainty values are evaluated while fitting the equation to the specific enthalpy values using weighted least square regression. Previous experimental measurements using differential scanning calorimetry for 42 LiF–29 NaF–29 ZrF4 (composition B) reported a Cp value nearly 0.334 cal/gm-°C with the 5% uncertainty [46]. In this case, the Cp value evaluated from RIM-IPMD is ∼28% smaller compared to the reported experimental values. To our knowledge, no previous experimental data are reported for the other two compositions studied in this paper. Overall, the trend of decrease in the Cp values with the increased ZrF4 mol% is in agreement with the observations from experimental measurements for the LiF-KF-ZrF4 system [47].
4 Conclusion
The ab-initio and classical molecular dynamics simulations were performed for 38–51-11 (composition A), 42–29-29 (composition B), and 26–37-37 (composition C) mol% of the LiF–NaF–ZrF4 salt system in the molten state. The short- to intermediate-range salt structure generated by AIMD and RIM-IPMD were analyzed and compared using cation–anion coordination number, cation–anion and Zr–Zr RDF, angular distribution, and fluorozirconate chain length quantification.
Densities obtained from RIM-IPMD were compared with AIMD, semi-empirical expression a.k.a. additive molar volume method, and experimental values. It was found that the AIMD-obtained density for composition C is in reasonable agreement (within 11%) with the experimental values, while RIM-IPMD-calculated densities are off by 26%.
For all compositions considered in this study, RIM suggested the formation of 7, 8, and 9 coordinated fluorine zirconium complexes, while the AIMD calculations and previous Raman spectra indicate the occurrence of 6, 7, and 8 coordinated fluorozirconate complexes in the salt mix. Both RIM and AIMD simulations showed a decrease in the average Zr coordination number with the increase in ZrF4 mol% going from compositions A to C. For all compositions, RIM reported up to 19% higher values for average Zr coordination numbers. The monovalent cation–anion (Li, Na) coordination numbers showed good agreement with those obtained from AIMD at lower ZrF4 mol%, while their values deviated by 7% upon increase in ZrF4 mol%. At higher ZrF4 mol% (compositions B and C), there is a deviation between AIMD and RIM-calculated Zr–F coordination numbers. This indicates poor representation of the short-range interactions in RIM when a higher mol% of multivalent cation is present. At the intermediate-range, isolated zirconium fluorine complexes ([ZrFx4−x]) were dominant in both RIM and first-principle calculations when ZrF4 mol% was limited (composition A). However, as ZrF4 mol% increased such as in compositions B and C, both AIMD and RIM showed the presence of fluorozirconate chains ([ZrFx4−x]n). Evidently, RIM parameters depicted an extensive network formation in the salt structure involving up to 99% of Zr in the melt compared to only 67% of Zr involved in chain formation in AIMD. Moreover, angle distribution functions revealed that the AIMD-generated network is connected by both edge-sharing and corner-sharing fluorine–zirconium complexes, while the RIM-generated network is mainly connected by corner-sharing complexes.
Such differences in coordination complexes ([ZrFx4−x]) resulted in ∼56% smaller Zr diffusion coefficients in composition A. An additional unrealistic network formation ([ZrFx4−x]n) in higher ZrF4 mol% compositions contributed to differences in AIMD and RIM Zr self-diffusion coefficients up to one order and two orders of magnitude for compositions B and C, respectively. Moreover, for compositions B and C, the overprediction of the network by RIM resulted in the viscosity values to be two and three orders higher than the reported experimental data. Where AIMD and RIM salt structures showed good agreement (composition A), reasonable Zr diffusivities and viscosity values calculated from RIM are predicted. It was also found that the specific heat capacities calculated from the RIM structure showed a decrease in values with the increase in ZrF4 mol%, which agrees with the previously available experimental and simulation data. Upon comparison, the specific heat capacity values from RIM deviated by 27% from the available experimental data for composition B.
Overall, the discrepancies in coordination behavior can be attributed to the increase in inaccuracy of short-range interactions calculated by RIM potential as ZrF4 mol% increases. Additionally, the observed discrepancies in the intermediate-range structure for LiF–NaF–ZrF4 salt are likely caused by several factors including noninclusion of dispersion interaction in the parameter fitting process and omission of higher dipole moments while fitting for the polarization terms. Fluorine polarizability significantly affects the Zr–F–Zr angle and hence can influence the connectivity of the adjacent flurozirconates (corner- or edge-sharing).
While it can be argued that a re-parameterization of RIM parameters for the LiF–NaF–ZrF4 salt system containing higher ZrF4 mol% may lead to obtaining of an accurate short- to intermediate-range salt structure, the transferability of the refitted force-field parameters would be reduced. It is known that the parameter fitting for multicomponent molten salts containing multivalent charged species is a tedious process which involves multiple challenges. To this end, AIMD calculations are particularly required in interpolating and extrapolating across compositional space. In future studies, DFT-trained neural network interatomic potentials can also provide an alternative pathway for generating the accurate salt structure and evaluating structure-dependent transport as well as thermophysical properties.
Data Availability Statement
The raw data supporting the conclusion of this article will be available by the authors, without undue reservation upon reasonable request.
Author Contributions
RC and SL conceived and guided the overall study. RC performed data generation and analysis and wrote the manuscript. SB contributed to oral discussions. All the authors reviewed the manuscript. All authors agree to be accountable for the content of the work.
Funding
This work is supported by DOE-NE’s Nuclear Energy University Program (NEUP) under Award DE-NE0009204. A part of the computational resources were provided by Massachusetts green high-performance computing cluster (MGHPCC). This research also used resources of the National Energy Research Scientific Computing Center, a DOE Office of Science User Facility supported by the Office of Science of the U.S. Department of Energy under Contract No. DE-AC02-05CH11231.
Conflict of Interest
The authors declare that the research was conducted in the absence of any commercial or financial relationships that could be construed as a potential conflict of interest.
Publisher’s Note
All claims expressed in this article are solely those of the authors and do not necessarily represent those of their affiliated organizations, or those of the publisher, the editors, and the reviewers. Any product that may be evaluated in this article, or claim that may be made by its manufacturer, is not guaranteed or endorsed by the publisher.
Supplementary Material
The Supplementary Material for this article can be found online at: https://www.frontiersin.org/articles/10.3389/fphy.2022.830468/full#supplementary-material
References
1. Grimes WR, Cuneo DR, Blankenship FF. Chemical Aspects of Molten-Fluoride-Salt Reactor Fuels. Fluid fuel reactors (1958) 569–94.
2. Fredrickson GL, Cao G, Gakhar R, Yoo T-S. Molten Salt Reactor Salt Processing – Technology Status. United States: Idaho Falls, ID (2018). Aug.
3. Williams DF. Assessment of Candidate Molten Salt Coolants for the Advanced High Temperature Reactor (AHTR). TN: Oak Ridge (2006). Mar.
4. Jerden J. Molten Salt Thermophysical Properties Database Development : 2019 Update. Lemont, IL: ANL/CFCT-19/6 (2019).
5. Li Q-J, Sprouster D, Zheng G, Neuefeind JC, Braatz AD, Mcfarlane J, et al. Complex Structure of Molten NaCl-CrCl3 Salt: Cr-Cl Octahedral Network and Intermediate-Range Order. ACS Appl Energ Mater. (2021) 4(4):3044–56. doi:10.1021/acsaem.0c02678
6. Roy S, Brehm M, Sharma S, Wu F, Maltsev DS, Halstenberg P, et al. Unraveling Local Structure of Molten Salts via X-ray Scattering, Raman Spectroscopy, and Ab Initio Molecular Dynamics. J Phys Chem B (2021) 125(22):5971–82. Jun. doi:10.1021/acs.jpcb.1c03786
7. Timoshenko J, Anspoks A, Cintins A, Kuzmin A, Purans J, Frenkel AI. Neural Network Approach for Characterizing Structural Transformations by X-Ray Absorption Fine Structure Spectroscopy. Phys Rev Lett (2018) 120(22):225502. doi:10.1103/physrevlett.120.225502
8. Lam ST, Li Q-J, Mailoa J, Forsberg C, Ballinger R, Li J. The Impact of Hydrogen Valence on its Bonding and Transport in Molten Fluoride Salts. J Mater Chem A (2021) 9:1784–94. doi:10.1039/d0ta10576g
9. Nam HO, Morgan D. Redox Condition in Molten Salts and Solute Behavior: A First-Principles Molecular Dynamics Study. J Nucl Mater (2015) 465:224–35. doi:10.1016/j.jnucmat.2015.05.028
10. Salanne M, Simon C, Turq P, Ohtori N, Madden PA. Modeling of Molten Salts. In: Molten Salts Chemistry. 1st ed. Elsevier (2013). p. 1–16. no. i. doi:10.1016/b978-0-12-398538-5.00001-9
11. Salanne M, Madden PA. Polarization Effects in Ionic Solids and Melts. Mol Phys (2011) 109(19):2299–315. doi:10.1080/00268976.2011.617523
12. Salanne M, Rotenberg B, Jahn S, Vuilleumier R, Simon C, Madden PA. Including many-body Effects in Models for Ionic Liquids. Theor Chem Acc (2012) 131(3):1143. Mar.
13. Salanne M, Simon C, Turq P, Madden PA. Heat-transport Properties of Molten Fluorides: Determination from First-Principles. J Fluorine Chem (2009) 130(1):38–44. Jan. doi:10.1016/j.jfluchem.2008.07.013
14. Salanne M, Simon C, Groult H, Lantelme F, Goto T, Barhoun A. Transport in Molten LiF-NaF-ZrF4 Mixtures: A Combined Computational and Experimental Approach. J Fluorine Chem (2009) 130(1):61–6. doi:10.1016/j.jfluchem.2008.07.005
15. Kresse G, Furthmüller J. Efficient Iterative Schemes Forab Initiototal-Energy Calculations Using a Plane-Wave Basis Set. Phys Rev B (1996) 54(16):11169–86. Oct. doi:10.1103/physrevb.54.11169
16. Perdew JP, Burke K, Ernzerhof M. Generalized Gradient Approximation Made Simple. Phys Rev Lett (1996) 77(18):3865–8. Oct. doi:10.1103/physrevlett.77.3865
17. Lam ST. Accelerated Atomistic Prediction of Structure, Dynamics and Material Properties in Molten Salts. Cambridge, MA: Massachusetts Institute of Technology (2020).
18. Grimme S, Antony J, Ehrlich S, Krieg H. A Consistent and Accurate Ab Initio Parametrization of Density Functional Dispersion Correction (DFT-D) for the 94 Elements H-Pu. J Chem Phys (2010) 132(15):154104. doi:10.1063/1.3382344
19. Martinez L, Andrade R, Birgin EG, Martinez JM. Software News and Updates Gabedit — A Graphical User Interface for Computational Chemistry Softwares. J Comput Chem (2008) 30:2157–64.
20. Hoover WG. Canonical Dynamics: Equilibrium Phase-Space Distributions. Phys Rev A Gen Phys (1985) 31(3):1695–7. Mar. 1985. doi:10.1103/physreva.31.1695
21. Chahal R, Lam ST. Ab-initio Molecular Dynamics Study of LiF-NaF-ZrF4 Molten Salt System,” in. Trans Am Nucl Soc (2021) 125(1):549–53.
22. Kühne TD, Iannuzzi M, Del Ben M, Rybkin VV, Seewald P, Stein F, et al. CP2K: An Electronic Structure and Molecular Dynamics Software Package -Quickstep: Efficient and Accurate Electronic Structure Calculations. J Chem Phys (2020) 152(19). doi:10.1063/5.0007045
23. Stukowski A. Visualization and Analysis of Atomistic Simulation Data with OVITO-The Open Visualization Tool. Model Simul. Mater. Sci. Eng. (2010) 18(1):015012. doi:10.1088/0965-0393/18/1/015012
24. Momma K, Izumi F. VESTA 3for Three-Dimensional Visualization of crystal, Volumetric and Morphology Data. J Appl Cryst (2011) 44(6):1272–6. doi:10.1107/s0021889811038970
25. Winner N, Williams H, Scarlat RO, Asta M. Ab-initio Simulation Studies of Chromium Solvation in Molten Fluoride Salts. J Mol Liquids (2021) 335:116351. doi:10.1016/j.molliq.2021.116351
26. Bengtson A, Nam HO, Saha S, Sakidja R, Morgan D. First-principles Molecular Dynamics Modeling of the LiCl-KCl Molten Salt System. Comput Mater Sci (2014) 83:362–70. Feb. doi:10.1016/j.commatsci.2013.10.043
27. Toth LM, Quist AS, Boyd GE. Raman Spectra of Zirconium(IV) Fluoride Complex Ions in Fluoride Melts and Polycrystalline Solids. J Phys Chem (1973) 77(11):1384–8. doi:10.1021/j100630a014
28. Kergoat M, Massot L, Gibilaro M, Chamelot P. Investigation on Fluoroacidity of Molten Fluorides Solutions in Relation with Mass Transport. Electrochimica Acta (2014) 120:258–63. doi:10.1016/j.electacta.2013.12.035
29. Lee S-C, Zhai Y, Li Z, Walter NP, Rose M, Heuser BJ, et al. Comparative Studies of the Structural and Transport Properties of Molten Salt FLiNaK Using the Machine-Learned Neural Network and Reparametrized Classical Forcefields. J Phys Chem B (2021) 125(37):10562–70. Sep. doi:10.1021/acs.jpcb.1c05608
30. Rollet A-L, Salanne M, Groult H. Structural Effects on the Electrical Conductivity of Molten Fluorides: Comparison between LiF-YF3 and LiF-NaF-ZrF4. J Fluorine Chem (2012) 134:44–8. doi:10.1016/j.jfluchem.2011.04.002
31. Pauvert O, Zanghi D, Salanne M, Simon C, Rakhmatullin A, Matsuura H, et al. In Situ Experimental Evidence for a Nonmonotonous Structural Evolution with Composition in the Molten LiF−ZrF4 System. J Phys Chem B (2010) 114(19):6472–9. doi:10.1021/jp912195j
32. Lam ST, Li Q-J, Ballinger R, Forsberg C, Li J. Modeling LiF and FLiBe Molten Salts with Robust Neural Network Interatomic Potential. ACS Appl Mater Inter (2021) 13(21):24582–92. doi:10.1021/acsami.1c00604
33. Rodriguez A, Lam S, Hu M. Thermodynamic and Transport Properties of LiF and FLiBe Molten Salts with Deep Learning Potentials. ACS Appl Mater Inter (2021) 13(46):55367–79. Nov. 2021. doi:10.1021/acsami.1c17942
34. Rapaport DC. The Art of Molecular Dynamics Simulation. 2nd ed., 4. Cambridge University Press (2004).1.
35. Nam HO, Bengtson A, Vörtler K, Saha S, Sakidja R, Morgan D. First-principles Molecular Dynamics Modeling of the Molten Fluoride Salt with Cr Solute. J Nucl Mater (2014) 449(1–3):148–57. doi:10.1016/j.jnucmat.2014.03.014
36. Grimes WR. Reactor Chemistry Division Annual Progress Report for Period Ending December 31, 1965. TN (United States): Oak Ridge (1966). Mar.
37. Smith AL, Capelli E, Konings RJM, Gheribi AE. A New Approach for Coupled Modelling of the Structural and Thermo-Physical Properties of Molten Salts. Case of a Polymeric Liquid LiF-BeF2. J Mol Liquids (2020) 299:112165. Feb. doi:10.1016/j.molliq.2019.112165
39. Liang W, Lu G, Yu J. Machine-Learning-Driven Simulations on Microstructure and Thermophysical Properties of MgCl2-KCl Eutectic. ACS Appl Mater Inter (2021) 13(3):4034–42. Jan. doi:10.1021/acsami.0c20665
40. Pan G, Ding J, Du Y, Lee DJ, Lu Y. A DFT Accurate Machine Learning Description of Molten ZnCl2 and its Mixtures: 2. Potential Development and Properties Prediction of ZnCl2-NaCl-KCl Ternary Salt for CSP. Comput Mater Sci (2021) 187:110055. September 2020.
41. Zhou W, Zhang Y, Salanne M. Effects of Fluoride Salt Addition to the Physico-Chemical Properties of the MgCl2-NaCl-KCl Heat Transfer Fluid : A Molecular Dynamics Study (2021). ChemRxivThis content is a preprint and has not been peer-reviewed.
42. Dewan LC, Simon C, Madden PA, Hobbs LW, Salanne M. Molecular Dynamics Simulation of the Thermodynamic and Transport Properties of the Molten Salt Fast Reactor Fuel LiF-ThF4. J Nucl Mater (2013) 434(1–3):322–7. doi:10.1016/j.jnucmat.2012.12.006
43. Beilmann M, Beneš O, Capelli E, Reuscher V, Konings RJM, Fanghänel T. Excess Heat Capacity in Liquid Binary Alkali-Fluoride Mixtures. Inorg Chem (2013) 52(5):2404–11. doi:10.1021/ic302168g
44. Ocádiz-Flores JA, Carré E, Griveau J-C, Colineau E, Capelli E, Souček P, et al. Thermodynamic Assessment of the KF-ThF4, LiF-KF-ThF4 and NaF-KF-ThF4 Systems. The J Chem Thermodynamics (2020) 145:106069. Jun. doi:10.1016/j.jct.2020.106069
45. Li Q-J, Küçükbenli E, Lam S, Khaykovich B, Kaxiras E, Li J. Development of Robust Neural-Network Interatomic Potential for Molten Salt. Cell Rep Phys. Sci. (2021) 2(3):100359. Mar.
46. Khokhlov V, Korzun I, Dokutovich V, Filatov E. Heat Capacity and thermal Conductivity of Molten Ternary Lithium, Sodium, Potassium, and Zirconium Fluorides Mixtures. J Nucl Mater (2011) 410(1–3):32–8. Mar.
Keywords: multicomponent molten salts, ab-initio molecular dynamics, rigid ion model, fluorozirconate chains, neoteric liquids simulation, ionic liqiuds, thermophyical properties, diffusion coefficients
Citation: Chahal R, Banerjee S and Lam ST (2022) Short- to Intermediate-Range Structure, Transport, and Thermophysical Properties of LiF–NaF–ZrF4 Molten Salts. Front. Phys. 10:830468. doi: 10.3389/fphy.2022.830468
Received: 07 December 2021; Accepted: 17 January 2022;
Published: 07 March 2022.
Edited by:
Y. Z, University of Illinois at Urbana-Champaign, United StatesReviewed by:
De-en Jiang, University of California, Riverside, United StatesTaras Bryk, National Academy of Sciences of Ukraine, Ukraine
Copyright © 2022 Chahal, Banerjee and Lam. This is an open-access article distributed under the terms of the Creative Commons Attribution License (CC BY). The use, distribution or reproduction in other forums is permitted, provided the original author(s) and the copyright owner(s) are credited and that the original publication in this journal is cited, in accordance with accepted academic practice. No use, distribution or reproduction is permitted which does not comply with these terms.
*Correspondence: Rajni Chahal, UmFqbmlfQ2hhaGFsQHVtbC5lZHU=