- 1Key Laboratory of Ministry of Education for Geomechanics and Embankment Engineering, Hohai University, Nanjing, China
- 2Research Institute of Geotechnical Engineering, Hohai University, Nanjing, China
In 2014, a landslide disaster occurred at Hongshiyan in Ludian County, Yunnan Province, China, causing the landslide-dames in Niulanjiang River. Scholars have studied the characteristics and causal mechanisms of this landslide and obtained substantial results. However, the kinematic evolution characteristics of the landslide remain relatively unclear. To resolve this problem, we introduced the Material Point Method (MPM) to study large-scale deformations for simulation analysis. The results showed that the movement of the slide body could be divided into three stages: accelerated sliding, decelerated sliding, and stabilizing. The velocity field and displacment field of the slide body is closely related to its spatial distribution. The velocity and displacement of the surface part higher than that of the shallow part. The internal friction angle and friction coefficient significantly affected the kinematic characteristics of landslide. The decrease in the internal friction angle and friction coefficient reduced the energy consumed by the friction between particles and between the particles and the sliding bed, raising the landslide velocity and displacement.
Introduction
With densely distributed mountains and river valleys, Southwest China is rich in hydropower resources, and many hydroelectric projects have been constructed in the area. Under the effects of the reservoir water level, long-term rainfall, and seismicity, landslides frequently occur on the slopes of the river valleys where these hydropower facilities are located, causing casualties and economic losses in severe cases. Studying the kinematic evolution process of a landslide enables us to analyze its striking force, travel path, deposition range, and deposition thickness, which have important theoretical significance and engineering practice value in quantitatively assessing landslide risks and avoiding secondary disasters associated with landslides [1, 2].
Unlike in-situ observation and model test methods, numerical simulation is not restricted by the scale or monitoring methods and can reveal a detailed failure process. Thus, it is widely applied in the research of the landslide movement process. The numerical methods currently used to study the landslide runout process can be divided into two main categories: discrete and continuous medium methods [3].
Discrete methods, such as the discrete element method (DEM), focus on the microscopic details of interparticle contacts and can facilitate detailed and in-depth analysis of the dynamics of granular flows [4]. Wei et al. used PFC3D to characterize the dynamics of the Mabian landslide. They established a support vector machine (SVM) coupled with PFC to back-analyze the macroscopic and microscopic strength parameters of the rock materials and investigated the velocity, displacement, and kinetic energy features of the landslide [5]. Wang et al. performed dynamic simulations for the Zhenggang landslide based on a 3-D geological model and PFC3D to study the landslide’s deposition morphology and failure mechanism [6]. Although the discrete element technique can simulate millions of particles, the scale of the granular medium system is still not considered “macroscopic” [7]. Moreover, it is sometimes difficult to determine the model calculation parameters from conventional laboratory experiments [8].
Continuous medium methods are only applied to landslide problems with distinct separation between macroscopic and microscopic scales. This technique focuses on macroscopic mechanical quantities from a continuum perspective, which is more suitable for large-scale engineering calculations. Currently, the continuous medium methods used to study the landslide movement process mainly include smoothed particle hydrodynamics (SPH) and the MPM. Huang et al. used the SPH method to simulate the Tangjiashan landslide in three dimensions, and the results were in good agreement with the flow-like landslide characteristics observed in the field [9]. The advantage of SPH is that it can simulate large deformation problems as well as fluid changes in large deformations. The disadvantages are that SPH exhibits spatial instability due to point-to-point integration and that its boundary treatment method is complicated [10]. The MPM is a particle-based approach in which the material domain is represented by a series of material points, and the material deformation is determined by solving Newton’s second law of motion on the computational mesh [11]. Unlike SPH, MPM does not generate boundary problems, and it can simulate the fluid-solid coupling effect in large deformation problems [12, 13]. Researchers have explored landslide modeling using the MPM. Enrico et al. used the MPM to analyze the kinematic evolution of the Senise landslide in two dimensions, and the numerical simulation results obtained matched well with the monitored circumstances [14]. Li et al. applied MPM to simulate the runout processes of the Wangjiashan landslide with and without buildings on the deposition area. The results showed that the presence of buildings significantly affected the runout of the landslide [15]. Llanoserna et al. modeled the large-scale runout process of the Alto Verde landslide in Colombia using MPM and emphasized the influence of clay-rich layers on the runout behavior [16]. Yerro et al. used the MPM to simulate the initiation and runout process of the Oso landslide in the United States and considered a complex topography with multiple soil layers in their model [17]. Despite the substantial results obtained by previous researchers in landslide simulation with the MPM, deficiencies in this research direction remain, such as the lack of studies focusing on landslides in alpine valley areas.
To resolve the deficiency mentioned above, we conducted this study with the progress of the remediation project of Hongshiyan dammed lake on the Niulan River in Yunnan Province, China. We simulated the runout process of the Hongshiyan landslide based on the MPM, focusing on the evolution of the velocity and displacement fields of the slide body during its movement, and compared the calculated deposition morphology of the landslide with in-situ geological survey results. The effects of the internal friction angle, cohesion, and friction coefficient on the kinematic characteristics of the landslide were explored to elucidate the runout features of such landslides in alpine valley areas. This research provides a basis for understanding the landslide runout processes, quantitatively assessing landslide risks, and preventing disasters in alpine valley areas.
Material Point Method
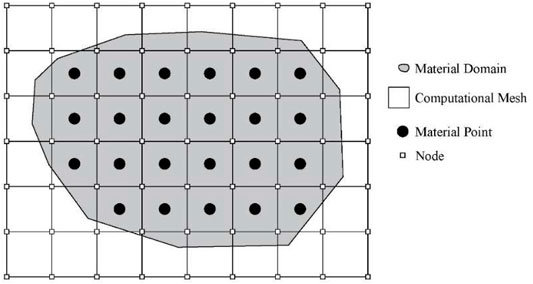
The MPM is a novel and developing a particle-based numerical approach that combines the strengths of the Euler and Lagrangian algorithms. It uses the Lagrangian description to divide the continuum into a series of discrete material points and the Eulerian description to conduct calculations on a background mesh. As shown in Figure 1, the material domain Ω composed of a specific type of material can be discretized into a series of material points, and a background computational mesh that includes the entire computational domain is simultaneously set up. Let xip, mp, and vipdenote the position coordinates, mass, and velocity of material point p, respectively, which constitute the Lagrangian description of this object. As the mass of the material point remains constant, the conservation of mass is apparently satisfied. Unlike most calculation methods based on discrete particles, the momentum equation of the material point is solved on a background mesh. The calculation starts by projecting the mass, momentum, and position information carried by the material points onto the background mesh, and the nodes are then solved and updated with the governing equation,
piI is the momentum of the grid node in the i direction, (2) and (3) are the calculation formulae of the external and internal forces of the node. mp is the mass of the material point p. ρp is the denstiy of the material point p. NIp is the value of the shape functuon of the grid node I at the material point p. bip is the physical force of the material point p. σijp is the Cauchy stress tension of the material point p.
The momentum of the node for the next time step can be calculated as
The updated momentum of the node is used to solve the physical quantities, such as the position and velocity of the material point:
For the updated state of motion, finally the constitutive configuration and strength criteria of the material should be used to calculate the stress limit of the particles. The constitutive calculation is performed on the material point, and the velocity field calculated by the background mesh can be used to obtain the strain rate and spin rate tensor, which can be used to calculate the stress field of the material. Finally, the deformed mesh is discarded, and a new mesh is established at the beginning of the next calculation to avoid mesh distortion.
MPM Numerical Model of the Hongshiyan Landslide
Overview of the Hongshiyan Landslide
The Hongshiyan landslide is located on the right bank of the Niulan River in Ludian County, Zhaotong, Yunnan Province, and China. The landslide area sits in the transitional zone between the Yunnan-Guizhou Plateau and Sichuan Basin. The regional geomorphology is dominated by high mountains and deeply incised river valleys, as shown in Figure 2A. The original slope before failure was steep at the top and gentle at the bottom, and the landslide source area had a slope angle of approximately 50°. The landslide occurred in a typical V-shaped river valley. Affected by previous earthquakes, the top of the slope had been broken and loosened, and a new earthquake triggered the landslide. The landslide mass entirely deposited at the bottom of the river valley, forming a dam blocking the Niulan River and threatening public safety in the downstream areas. The landslide dam was 83–96, 307, and 262 m in height, length, and width, respectively, with a total volume of approximately 1200 × 104 m3, as shown in Figure 2D. Eventually, the landslide dam was converted into a hydraulic structure for permeant remediation. The topography before and after the landslide, as observed in Google Earth, is shown in Figures 2B,C.
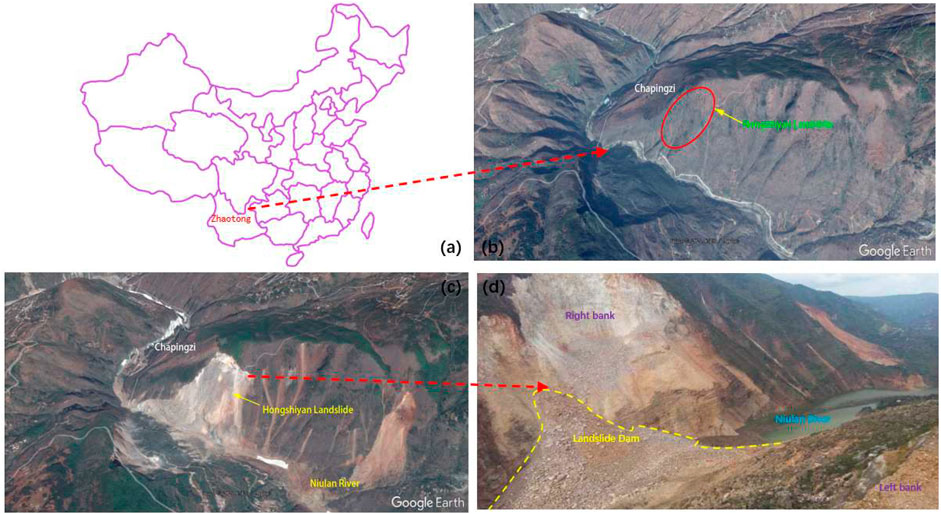
FIGURE 2. (A) Location of the Hongshiyan landslide; (B) remote sensing image before the Hongshiyan landslide (modified from Google Earth); (C) remote sensing image after the Hongshiyan landslide (modified from Google Earth); (D) landslide dam (modified from www.cigem.cn).
The residual slope of the Hongshiyan landslide after the earthquake has an angle of 70–80° and height of 600 m. According to the in-situ geological survey, a large number of tensile and unloading fractures were developed within 60 m behind the slope on the right bank after the earthquake. The width and depth of the fractures reach 50 and 60 cm, respectively, as shown in Figure 3.
Engineering Geological Characteristics
The Hongshiyan landslide is located on the right bank of the Niulan River in Ludian County. In the study area, the Niulan River crosses a deep and steep V-shaped river valley, and the engineering geological map is shown in Figure 4A. The source area of the slide body is approximately 800 m above the riverbed, and the shear outlet of its leading edge has an elevation of approximately 1200 m. The vertical height of the landslide surface is approximately 700 m, and the elevation range is 1100–1800 m. The whole runout process of the landslide lasted for approximately 100 s. The horizontal runout distance (from the top of the slope to the farthest end of the slide body) is approximately 1274 m.
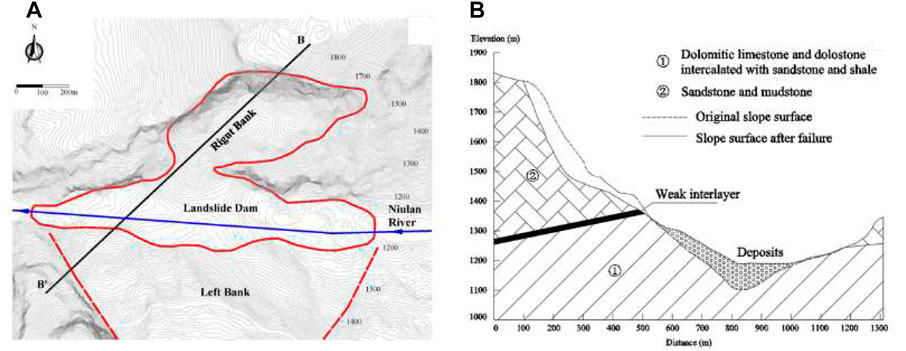
FIGURE 4. (A) Engineering geological map of the Hongshiyan landslide; (B) cross-section along the main sliding direction.
Figure 4Bshows the geological cross-section along the main sliding direction (B-B’). This area is widely developed with joints, fractures, and strongly weathered surfaces. The rock mass at the landslide source area consists of two units, strongly weathered limestone in the upper part and silty mudstone in the lower part. During the earthquake, the weak mudstone was unable to carry the load of the limestone above it, resulting in a landslide. The failed rock mass was then crushed and broken in the runout process, developed into a debris flow, and finally deposited at the bottom of the river valley.
Numerical Model
In this study, the MPM was applied to simulate the runout process of the Hongshiyan landslide. This method combines the advantages of Lagrangian and Euler algorithms, and is very suitable for simulating large deformation problems of landslides. With this method, not only can the initial status, but also the travel path and final deposition pattern of the landslide be obtained. These features will aid in assessing landslide risks and reducing property loss.
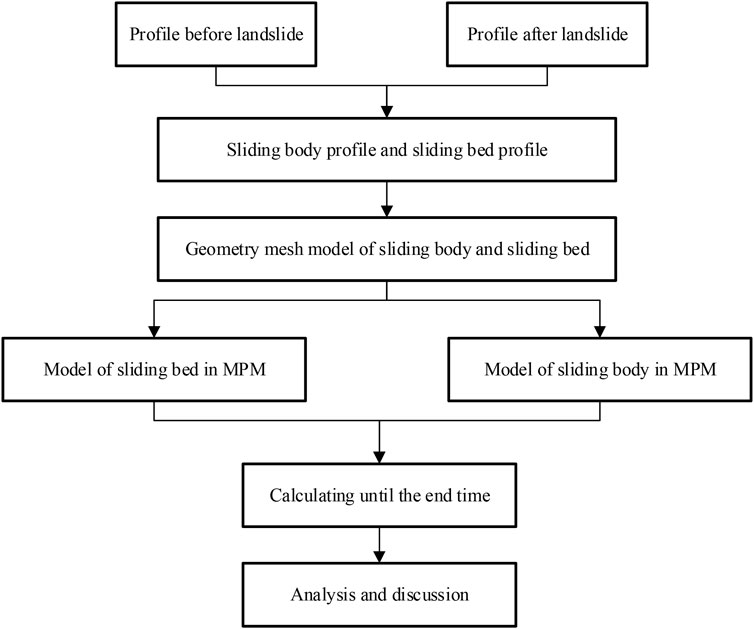
Based on the topographic data obtained before and after the landslide by in-situ geological surveys, an MPM numerical model of the Hongshiyan landslide was established to analyze its dynamic characteristics, such as the variations in displacement and velocity, and the flowchart of construction of model as show in Figure 5. The cross-section B-B’ in Figure 4B was selected as a reference for model construction in the numerical simulation.
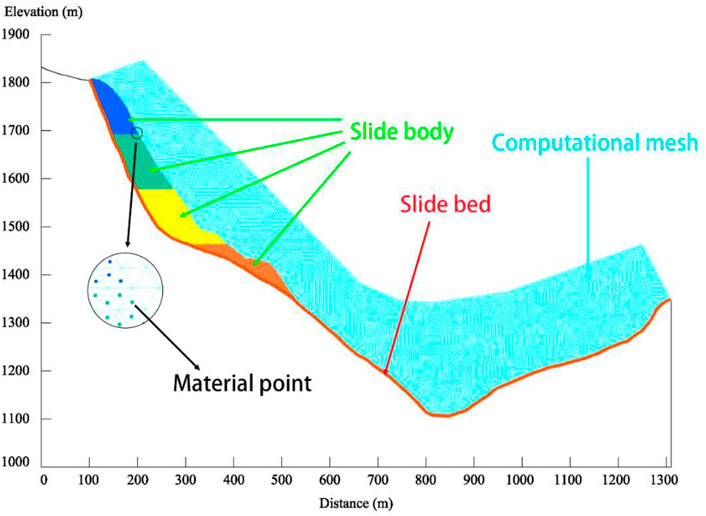
First, the slide body and slide bed structures were generalized and discretized. The model was established in an elevation range of 1000–1900 m, and the total volume of the slide body indicated by the two-dimensional cross-section, i.e., the modeling reference, was conserved. According to the field survey results, the size of the landslide debris varied greatly. To ensure the accuracy of the simulation calculations, we mainly assigned the volume of the material points based on the size of the in-situ rock and soil debris, and the size of the background computational mesh was 5 m. The model mainly included two parts, the slide body and slide bed, and the computational mesh was composed of triangular grid cells, each holding one material point. The model contained 22112 grid cells, 11368 nodes, and 2969 material points. Each material point carried the mass, volume, and other parameters of the area it represented. A Mohr-Coulomb model was used as the constitutive model of the slide body and an elastic model for the slide bed. The MPM model established is shown in Figure 6.
Calculation Parameters
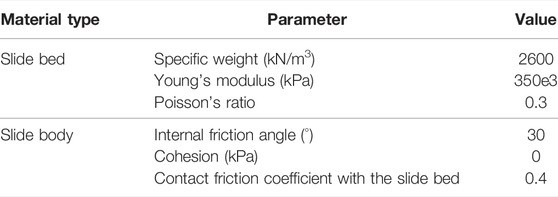
The local damping was set to 0.75 for the initial equilibrium condition before sliding and 0.05 for the runout process. The boundary conditions were simulated by constraining the normal displacement of the model’s left, right, front, and rear boundaries, and the displacements of the bottom boundary were constrained to prevent any vertical or horizontal displacement. Finally, constraints in the vertical direction were also applied on top of the mesh. The calculation parameters for the slide body of the Hongshiyan landslide are listed in Table 1.
Monitoring Point Distribution
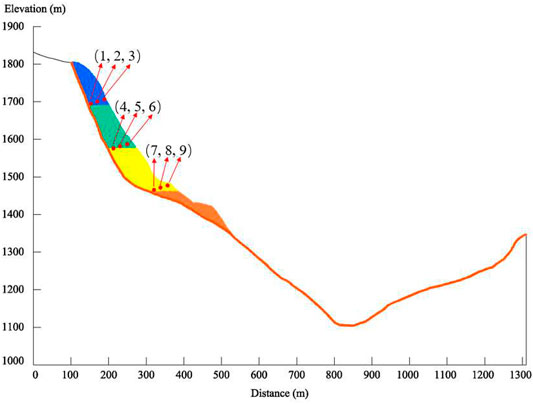
To explore the failure mechanism, destabilization process, and travel path of the Hongshiyan landslide, we set up nine monitoring points on the slide bed and within the slide body (at the surface and in shallow and deep layers), as shown in Figure 7. Generally, the changes in velocity and displacement can realistically reflect the movement process.
Results and Analysis
Sliding Velocity Variation Characteristics
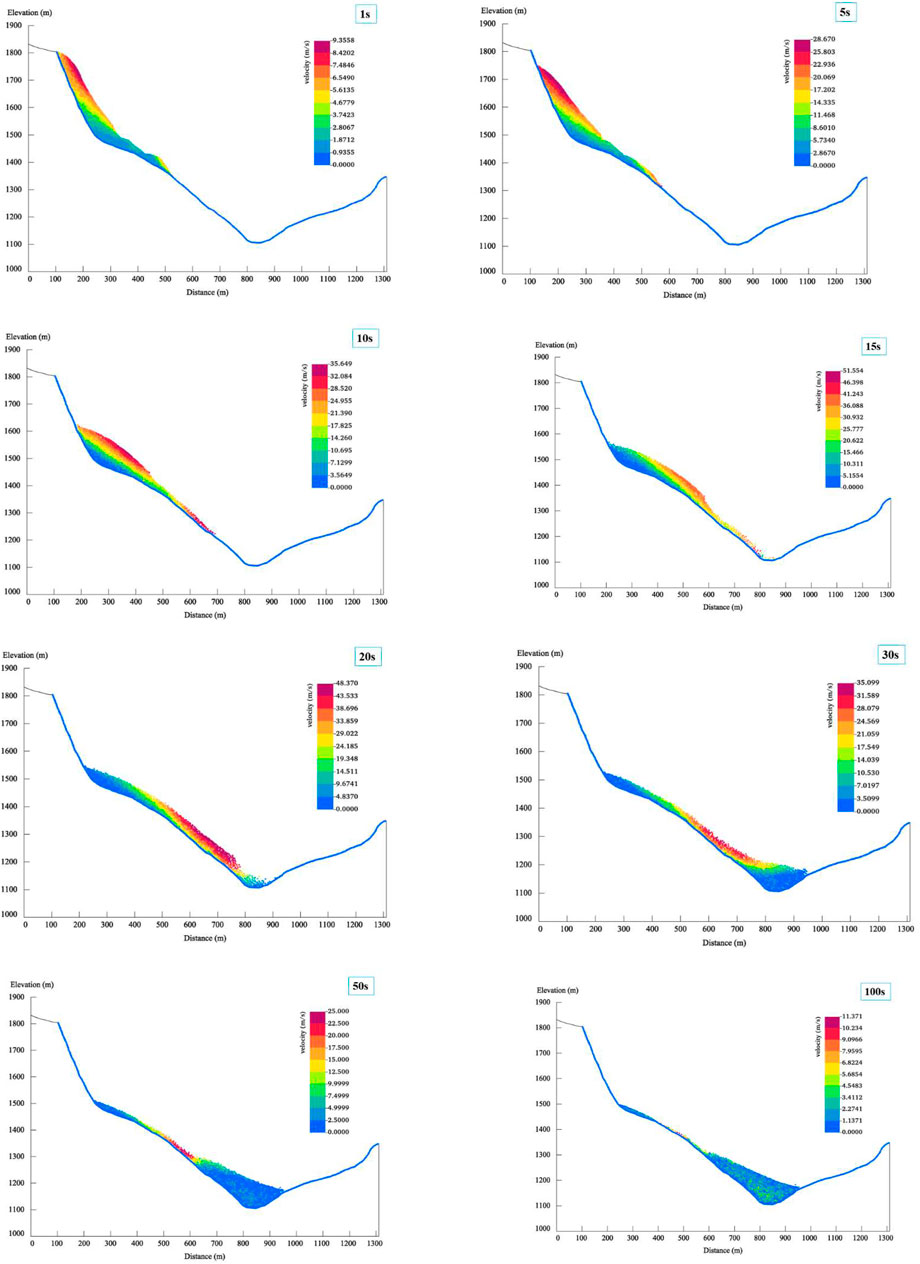
The simulated runout process of the Hongshiyan landslide is shown in Figure 8, which presents the sliding velocity distribution cloud maps of the slid body at different moments, i.e., t = 1, 5, 10, 15, 20, 30, 50, and 100 s. The diagrams indicate that the entire runout process lasted for approximately 100 s, and the movement of the slide body could be divided into three stages: accelerated sliding, decelerated sliding, and stabilizing. In the accelerated sliding stage, the velocity of all particles increased sharply, and the maximum sliding velocity of the particles on the slide body’s surface reached 20 m/s at around 3 s. The jostling of the rock mass at the upper part of the slide body pushed the lower part towards the river valley at high speed. As the energy dissipated (including the dissipation of friction and collision energy, and the deformation of the rock mass system), the acceleration gradually decreased, and the average velocity of the slide body reached its maximum of 19.52 m/s at 25 s as in shown Figure 9A. Meanwhile, the leading edge of the slide body reached the riverbed, and the runout process entered the decelerated sliding stage. The sliding velocity then declined sharply. As the particles slid down on the main slide bed, the deposition height of the landslide debris in the river valley gradually increased, and a landslide dam was formed by 50 s. This simulated process is consistent with the eyewitness’s report that the entire runout process of the Hongshiyan landslide lasted for approximately 1 min.
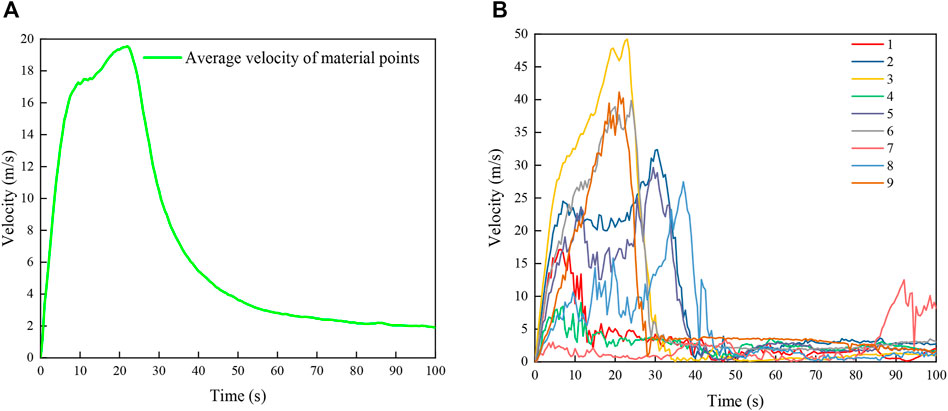
FIGURE 9. (A) Average sliding velocity of the slide body and (B) sliding velocities of the monitoring points in the slide body.
The velocity variations were observed by the monitoring points set at the surface and in the shallow and deep layers of the slide body, and the velocity variation curves are presented in Figure 9B. For the velocity distribution along the direction normal to the landslide’s surface, at the beginning of the landslide, the velocities of the monitoring points on the surface of the slide body (3, 6, and 9) were greater than those of the monitoring points in the shallow layer (2, 5, and 8), and the velocities of the shallow monitoring points were greater than those of the deep monitoring points (1, 4, and 7). The peak velocities of points 3, 6, and 9 were 49.21, 41.13, and 39.28 m/s, respectively. Additionally, the velocities of the surface monitoring points reached their peaks earlier than those of the shallow monitoring points, which agrees with the kinematic characteristics of the Hongshiyan landslide. For the velocity distribution along the elevation, the velocity of the monitoring point at a higher elevation exceeded that of a low-elevation monitoring point at the same depth. For example, the velocity of point 3 was greater than those of points 6 and 9, and the velocity of point 2 was greater than those of points 5 and 8. It should be noted that the velocity of point 7 only exhibits apparent acceleration at 85 s. This is because point 7 was compressed by the upper slide body, and it moved slowly in the early stage of sliding. Point 7 began to accelerate after the upper slide body has reached the riverbed.
The MPM simulation results show that the Mohr-Coulomb model and MPM can simulate the runout process of the Hongshiyan landslide well. The whole process of destabilization–high-velocity movement and the development into debris flow–deceleration and deposition into a landslide dam has been reconstructed. Due to the constraints of the Niulan River valley at the foot of the mountain, the debris gradually accumulated at the bottom of the river valley after sliding.
Displacement Variation Characteristics
The displacement features of the Hongshiyan landslide are closely related to the runout and deposition of the slide body. As shown in Figure 10A, the maximum average displacement of the landslide was 591 m at 100 s. This is affected by topography and the elevation of the slide body. The landslide displacement rose rapidly in the first 30 s, and the displacement increase then gradually slowed. For monitoring points 1–9, the points at the surface (3, 6, 9) were the first to initiate, and the time taken for their motions to reach equilibrium was shortest, followed by the points in the shallow layer (2, 5, 8). The displacements of the monitoring points in the deep layer (1, 4, 7) were less than those of the others. It should also be noted that the displacement of point 7 only exhibited an apparent acceleration after 85 s. For the displacement distribution along the elevation, the displacements of the monitoring points at the same depth increased as their elevation increased. The maximum displacement of the monitoring points was 917 m, occurring at point 3.
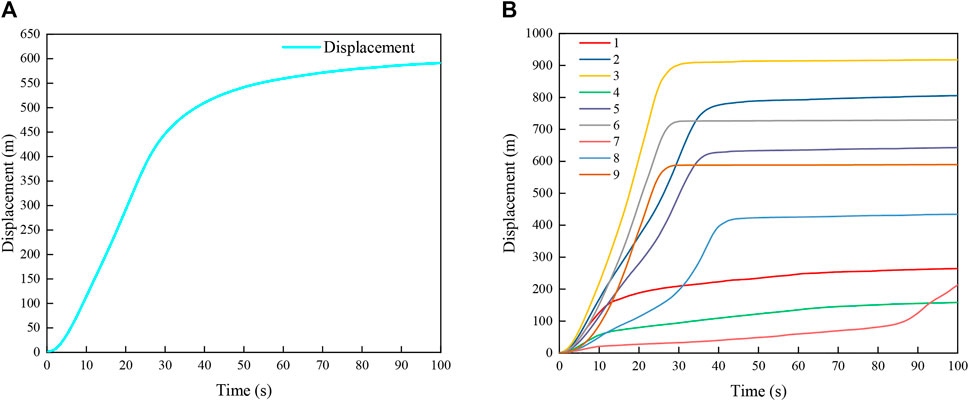
FIGURE 10. (A) Average displacement of the slide body and (B) displacements of the monitoring points in the slide body.
Landslide Deposition Morphology Evolution Characteristics
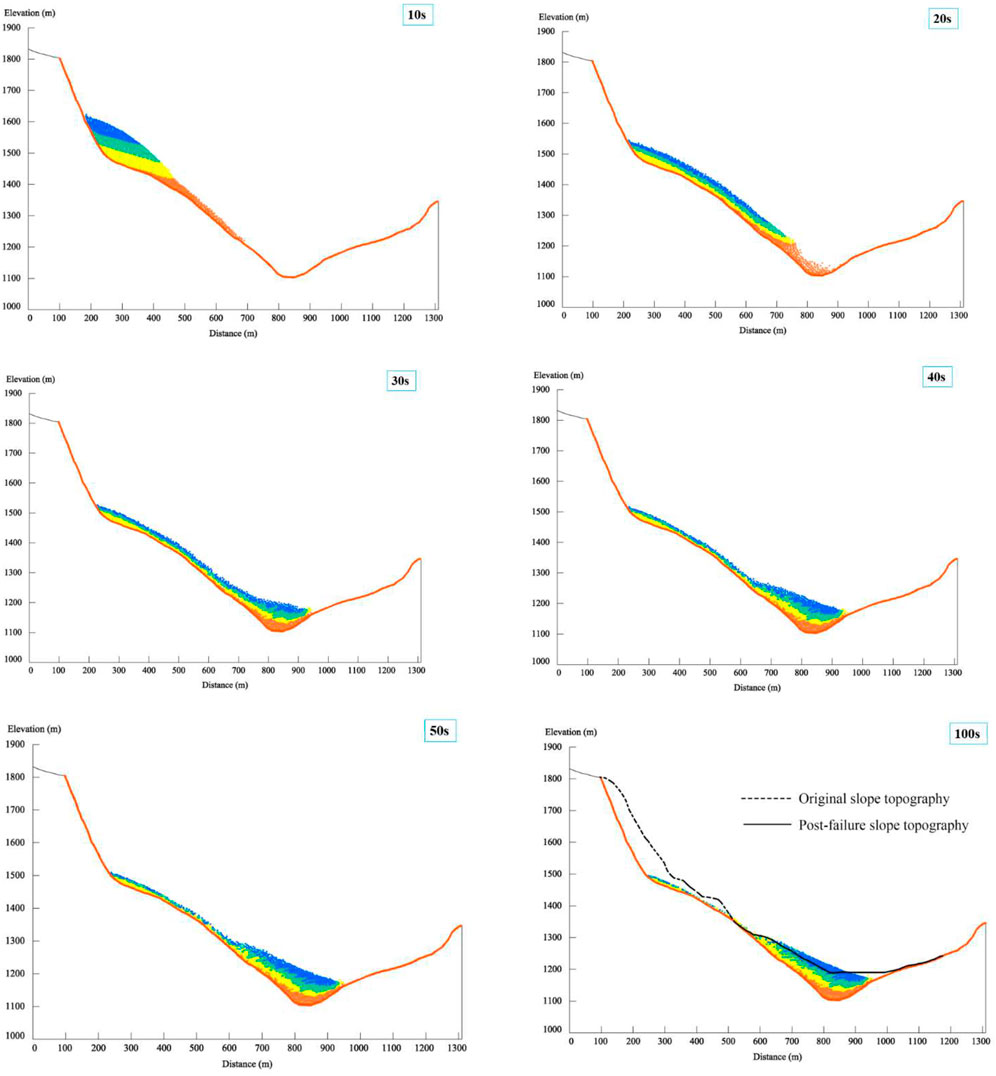
To analyze the morphological evolution of the Hongshiyan landslide deposit, such as the travel paths of rocks from different elevations, we obtained a series of images of the landslide movement and deposition process, as shown in Figure 11. The lower part of the slide body (with an elevation of 1350–1465 m) is marked in red, Zone 1 in the middle (1465–1580 m) is marked in yellow, Zone 2 in the middle (1580–1695 m) is marked in green, and the upper part (1695–1810 m) is marked in blue. The entire slide body slid down for 203.2 m at 20 s, and its leading edge reached the riverbed. Restricted by the topography of the river valley, the landslide debris began to accumulate on the riverbed. The deposition pattern of the slide body was formed at 50 s. At 100 s, the slide body had slid down for 365.7 m overall, with a maximum deposition thickness of 111.87 m and angle of repose of 25°, and some rock mass at the trailing edge of the landslide remained. The topographic profile lines before and after the landslide are plotted in the diagram. The simulated deposition morphology matched well with the actual pattern.
Sensitivity Analysis
The Hongshiyan landslide occurred on the right bank of the Niulan River, and is a typical landslide in the alpine valley area. To explore the effects of the internal friction angle, cohesion, and friction coefficient on the simulation results of the Hongshiyan landslide, we plotted the curves of the average velocities and displacements under different internal friction angle, cohesion, friction coefficient values and mesh size, and performed analysis for the parameters.
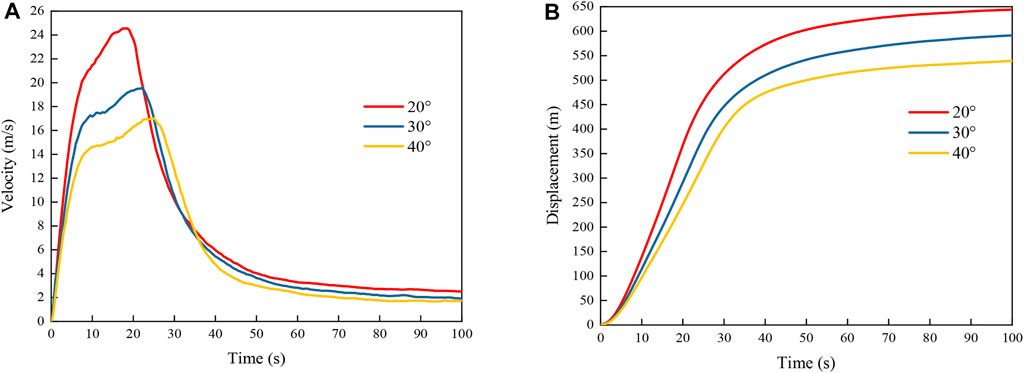
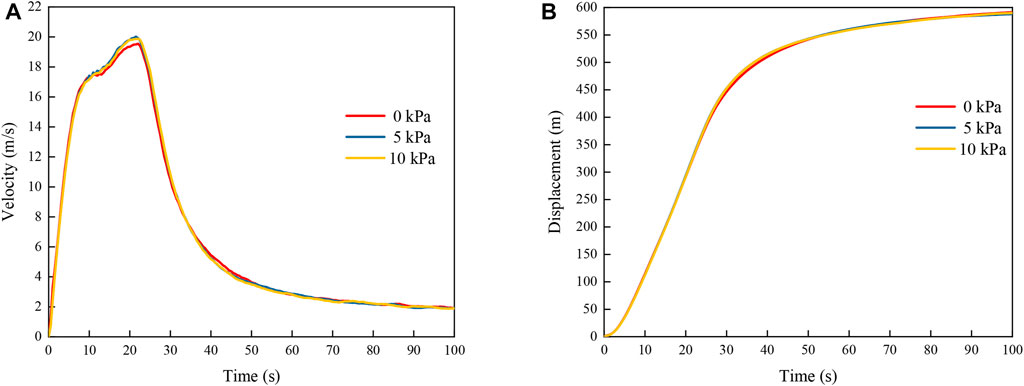
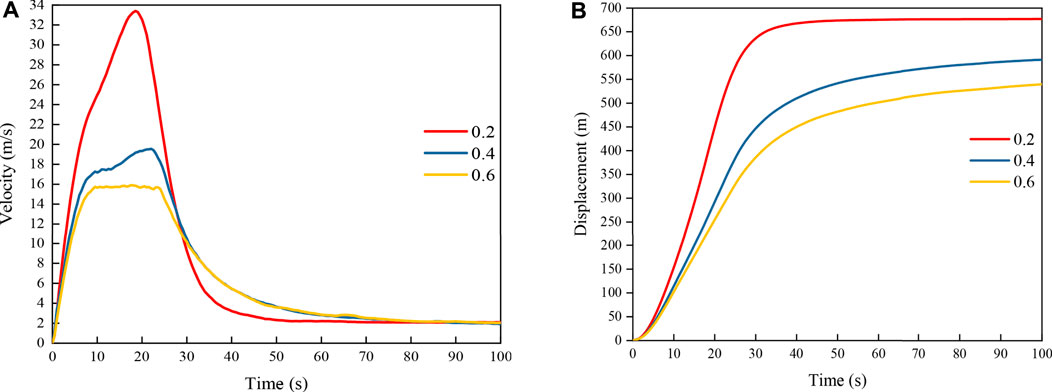
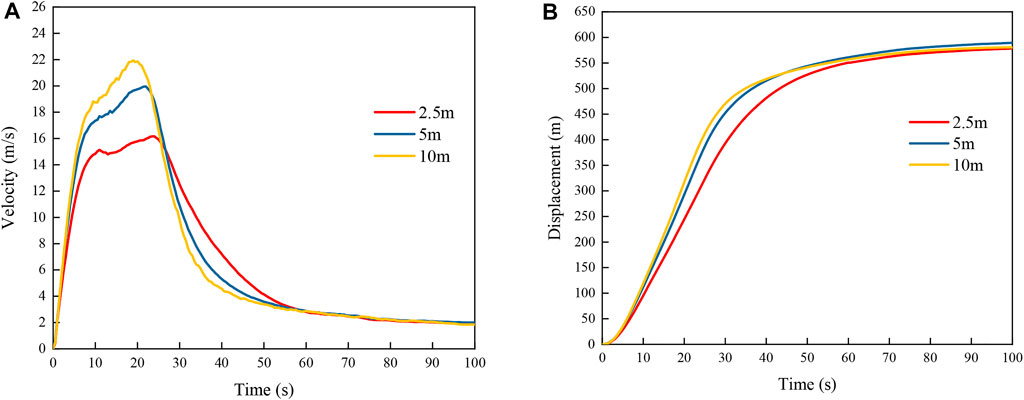
The average velocities and displacements obtained under internal friction angles of 20°, 30°, and 40° when the other parameters were constant are shown in Figure 12. The curves reveal that, as the internal friction angle decreased, the average velocity and displacement of the slide body exhibited increasing trends. The decrease in the internal friction angle reduced the energy consumed by the friction among particles, thereby raising the landslide velocity and displacement. Figure 13 presents the average velocities and displacements obtained under cohesion levels of 0, 5, and 10 kPa when the other parameters remained constant. The average velocity and displacement of the slide body did not change greatly with cohesion. As the mountain slope of the Hongshiyan landslide area is steep and the rock mass is severely weathered and developed with joints and fractures, all parts of the slide body moved almost together when the landslide initiated. The mode of landslide failure tended to be integral failure. Therefore, the level of cohesion did not greatly affect the failure mode and also had no effect on energy consumption. Figure 14 shows the average velocities and displacements obtained under friction coefficients of 0.2, 0.4, and 0.6 while the other parameters remained constant. The average velocity and displacement tended to increase with decreasing friction coefficient. Figure 15 shows the average velocities and displacements obtained under mesh size of 2.5, 5, 10 m while the other parameters remained constant. It can be seen that the average velocity increases with the increase of the mesh size, while the average displacement in the early stage increases with the increase of the mesh size. A finer mesh has more particles, and the frictional energy dissipation between particles increases compared to a coarse mesh, which ultimately leads to lower average velocity and displacement.
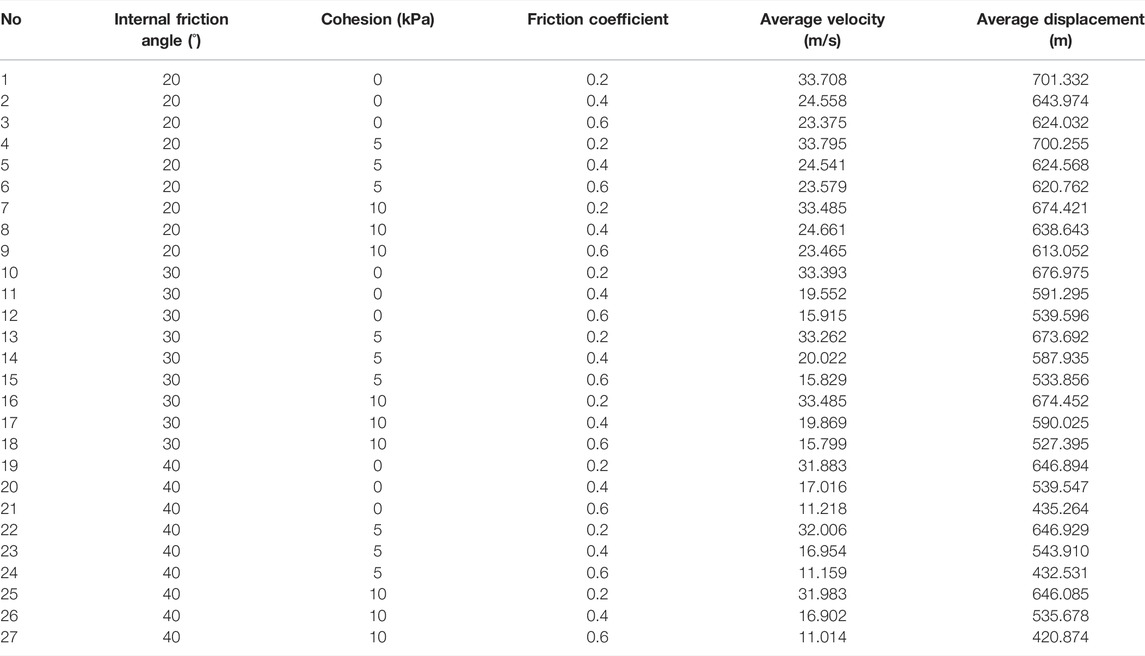
Generally, for landslides in alpine river valleys, such as the Hongshiyan landslide, the velocity and displacement increase with decreasing internal friction angle and friction coefficient. It should be noted that the kinematic characteristics of the landslide, including displacement and velocity, are essential for assessing the impact range and extent of the landslide disaster. To quantify the degree of influence of the calculation parameters on the movement of the Hongshiyan landslide, we established 27 MPM models of the Hongshiyan landslide with different internal friction angle, cohesion, and friction coefficient combinations for variance analysis, and the results are listed in Table 2.
We conducted variance analysis for the test results in Table 2 using statistical methods, with a significance level α of 0.05 and confidence interval of 95%. If the α-value of a factor is less than 0.05, its effect on the research object is considered significant; if the α-value of the factor is greater than 0.05, its effect on the research object is considered insignificant. The analysis results for the average velocity and displacement are listed in Tables 3, 4. The significance levels of the internal friction angle and friction coefficient in Tables 3, 4 were all below 0.05. Thus, these two factors significantly affect the average velocity and displacement. In contrast, the significance levels of cohesion exceeded 0.05; thus, it was believed to have no significant effect on the average velocity and displacement. It can be seen that the internal friction angle and friction coefficient have a greater effect on the average velocity and average displacement than the cohesion, which is consistent with the previous conclusion.
Discussion
Landslides in alpine valley areas can pose a safety threat to hydroelectric projects. In this study, a numerical model was established using the MPM to reconstruct the runout process of the Hongshiyan landslide. However, there were inevitable errors in the numerical model calculations, and they did not fully consider the natural conditions in the field. In future studies, a numerical model can be established using the MPM that considers the effects of complex natural factors so that the simulation results would better fit reality.
Conclusion
Based on the material point numerical calculation method, this study focuses on the kinematic evolution of a landslide that occurred at the Hongshiyan slope on the right bank of the Niulan River in Ludian County, Zhaotong, Yunnan Province, China, and reveals the variation characteristics of the velocity and displacement fields during the runout of the Hongshiyan landslide-debris flow. The conclusions obtained are as follows:
1) The sliding process of the Hongshiyan landslide can be divided into three stages: accelerated sliding, decelerated sliding, and stabilizing. The maximum average velocity of the landslide is 19.52 m/s. The velocity field of the slide body is closely related to its spatial distribution. The velocity of the surface monitoring points reached peaks earlier than that of the shallow monitoring points. From the perspective of the elevation distribution, the velocity of the monitoring points with lower elevation is higher at the same depth.
2) The displacement field of the slide body is closely related to its spatial distribution. The monitoring points in the surface of the slide body are activated earlier than those in the shallow layer of the landslide body, and have more displacement at the same time. From the perspective of elevation distribution, the displacement of monitoring points at the same depth increased as their elevation increased. The deposition morphology of the Hongshiyan landslide simulated by the MPM is consistent with the field survey results.
3) The internal friction angle and friction coefficient significantly affected the kinematic characteristics of the Hongshiyan landslide. The decrease in the internal friction angle and friction coefficient reduced the energy consumed by the friction between particles and between the particles and the sliding bed, raising the landslide velocity and displacement. The mode of landslide failure tended to be integral failure. Therefore, the level of cohesion did not greatly affect the failure mode and also had no effect on energy consumption.
Data Availability Statement
The original contributions presented in the study are included in the article/Supplementary Material, further inquiries can be directed to the corresponding author.
Author Contributions
The contribution of RW is the idea, introduction, Material Point Method and conclusion. The contribution of YY is the MPM numerical model and results analysis. The contribution of WX is the critical revision of the manuscript for important intellectual content. The contribution of YY is the Sliding velocity variation characteristics. The contribution of YW is the sensitivity analysis of Hongshiyan Landslide.
Funding
This work is supported by the National Key Research and Development Program of China (No. 2018YFC1508501) the National Natural Science Foundation of China (No. 51939004), the Fundamental Research Funds for the Central Universities (No. B210203003 and B200204008).
Conflict of Interest
The authors declare that the research was conducted in the absence of any commercial or financial relationships that could be construed as a potential conflict of interest.
Publisher’s Note
All claims expressed in this article are solely those of the authors and do not necessarily represent those of their affiliated organizations, or those of the publisher, the editors and the reviewers. Any product that may be evaluated in this article, or claim that may be made by its manufacturer, is not guaranteed or endorsed by the publisher.
Acknowledgments
We also thank the PowerChina Kunming Engineering Corporation Limited for their help in providing the data of Hongshiyan landslide for this study.
References
1. Hungr O, Evans SG, Bovis MJ, Hutchinson JN. A Review of the Classification of Landslides of the Flow Type. Environ Eng Geoscience (2001) 7(3):221–38. doi:10.2113/gseegeosci.7.3.221
2. Soga K, Alonso E, Yerro A, Kumar K, Bandara S. Trends in Large-Deformation Analysis of Landslide Mass Movements with Particular Emphasis on the Material Point Method. Géotechnique (2016) 66(3):248–73. doi:10.1680/jgeot.15.LM.005
3. Conte E, Donato A, Troncone A. A Finite Element Approach for the Analysis of Active Slow-Moving Landslides. Landslides (2014) 11(4):723–31. doi:10.1007/s10346-013-0446-9
4. Ghaboussi J, Barbosa R. Three-dimensional Discrete Element Method for Granular Materials. Int. J. Numer. Anal. Methods Geomech. (1990) 14(7):451–72. doi:10.1002/nag.1610140702
5. Wei J, Zhao Z, Xu C, Wen Q. Numerical Investigation of Landslide Kinetics for the Recent Mabian Landslide (Sichuan, China). Landslides (2019) 16(11):2287–98. doi:10.1007/s10346-019-01237-0
6. Wang SN, Xu WY, Shi C, Chen HJ. Run-out Prediction and Failure Mechanism Analysis of the Zhenggang Deposit in Southwestern China. Landslides (2017) 14(2):719–26. doi:10.1007/s10346-016-0770-y
7. Katz O, Morgan JK, Aharonov E, Dugan B. Controls on the Size and Geometry of Landslides: Insights from Discrete Element Numerical Simulations. Geomorphology (2014) 220:104–13. doi:10.1016/j.geomorph.2014.05.021
8. Fern J, Rohe A, Soga K, Alonso E. The Material Point Method for Geotechnical Engineering. A Practical Guide. 1st ed. Miami, FL, USA: CRC Press (2019). doi:10.1201/9780429028090
9. Huang Y, Zhang W, Xu Q, Xie P, Hao L. Run-out Analysis of Flow-like Landslides Triggered by the Ms 8.0 2008 Wenchuan Earthquake Using Smoothed Particle Hydrodynamics. Landslides (2011) 9(2):275–83. doi:10.1007/s10346-011-0285-5
10. Bandara S, Soga K. Coupling of Soil Deformation and Pore Fluid Flow Using Material Point Method. Comput Geotechnics (2015) 63:199–214. doi:10.1016/j.compgeo.2014.09.009
11. Zhang X, Chen Z, Liu Y. Material Point Method. Beijing, China: Tsinghua University Press (2017). doi:10.1016/B978-0-12-407716-4.00003-X
12. Alonso EE, Yerro A, Pinyol NM. Recent Developments of the Material Point Method for the Simulation of Landslides. IOP Conf. Ser Earth Environ. Sci. (2015) 26:012003. doi:10.1088/1755-1315/26/1/012003
13. Rohe A, Martinelli M. Material Point Method and Applications in Geotechnical Engineering. In: Conference Proc. of the Workshop on Numerical Methods in Geotechnics Hamburg; Germany (2017). p. 57–72.
14. Conte E, Pugliese L, Troncone A. Post-failure Stage Simulation of a Landslide Using the Material Point Method. Eng Geol (2019) 253:149–59. doi:10.1016/j.enggeo.2019.03.006
15. Li X, Wu Y, He S, Su L. Application of the Material Point Method to Simulate the Post-failure Runout Processes of the Wangjiayan Landslide. Eng Geol (2016) 212:1–9. doi:10.1016/j.enggeo.2016.07.014
16. Llano Serna MA, Muniz-de Farias M, Martínez-Carvajal HE. Numerical Modelling of Alto Verde Landslide Using the Material Point Method. Dyna (2015) 82(194):150–9. doi:10.15446/DYNA.V82N194.48179
Keywords: hongshiyan landslide, material point method, kinematic evolution, morphology evolution, numerical simulation
Citation: Yang Y, Wang R, Xu W, Wang Y and Yan L (2022) Characterization of the Kinematic Evolution of the Hongshiyan Landslide Using the Material Point Method. Front. Phys. 10:829262. doi: 10.3389/fphy.2022.829262
Received: 05 December 2021; Accepted: 20 April 2022;
Published: 03 May 2022.
Edited by:
Wanqing Shen, Université de Lille, FranceReviewed by:
Gang Liu, China Three Gorges University, ChinaCopyright © 2022 Yang, Wang, Xu, Wang and Yan. This is an open-access article distributed under the terms of the Creative Commons Attribution License (CC BY). The use, distribution or reproduction in other forums is permitted, provided the original author(s) and the copyright owner(s) are credited and that the original publication in this journal is cited, in accordance with accepted academic practice. No use, distribution or reproduction is permitted which does not comply with these terms.
*Correspondence: Rubin Wang, cmJ3YW5nX2hodUBmb3htYWlsLmNvbQ==
 Yue Yang
 Rubin Wang
 Weiya Xu
 Yunzi Wang
 Long Yan