
95% of researchers rate our articles as excellent or good
Learn more about the work of our research integrity team to safeguard the quality of each article we publish.
Find out more
ORIGINAL RESEARCH article
Front. Phys. , 01 April 2022
Sec. Chemical Physics and Physical Chemistry
Volume 10 - 2022 | https://doi.org/10.3389/fphy.2022.828444
This article is part of the Research Topic Oscillations, Waves and Patterns in the Physical and Life Sciences View all 16 articles
In agarose gel containing [Fe(CN)6]3‒ ions and sandwiched between two metal rods (Ti, Fe, or Cu) with a voltage of 1‒5 V applied for 20–100 h, reaction–diffusion–reaction (RDR) processes (that is, electrochemical reactions at metal rods to generate reactant ions, diffusion of the reactant ions influenced by the electric field in agarose gel, and reactions of the reactant ions to form/decompose precipitates) were coupled to generate diverse precipitation patterns of Prussian blues (PB) or Cu–Fe-based Prussian blue analogs (Cu–Fe PBA). These patterns strongly depended on the type of metal electrode, applied voltage, initial [Fe(CN)6]3‒ concentration, and elapsed time after voltage application. Under the application of 2 V for 20/50 h, the PB/Cu–Fe PBA formed a discrete precipitation band on the anode/cathode side in an agarose gel containing 0.050 M [Fe(CN)6]3‒ ions. In the Cu–Fe PBA system, a relatively long precipitation band of Cu(OH)2 was also generated on the anode side by OH− ions produced on the cathode as a byproduct. Longer voltage applications promoted propagation of the Cu–Fe PBA band to the anode side and caused the discrete PB band to disappear. Higher initial [Fe(CN)6]3‒ concentrations deepened the color of the generated patterns. Higher voltage applications suppressed the propagation of the Cu–Fe PBA band to the anode side and caused the PB band to disappear. Experiments using a Ti cathode suggested that the formation and subsequent decomposition of PB or Cu–Fe PBA at the cathode surface are important for forming precipitation band(s) in the gel near the cathode. The application of cyclic alternating voltages (particularly, 4 V for 1 h and 1 V for 4 h) was effective in generating Liesegang-band-like periodic bands, particularly for the Cu–Fe PBA system.
Liesegang bands [1, 2], which are the periodic precipitation bands of slightly soluble compounds via reaction–diffusion (RD) processes in hydrogels, have been continuously investigated [3] since their discovery by Liesegang in 1896 [4, 5]. Liesegang banding continues to attract considerable scientific interest as a self-organization phenomenon [6, 7] that is potentially applicable to micro- and nanofabrication [1,8‒10]. In conventional experiments to observe Liesegang bands, two electrolytes are loaded into separate columns in a single sample tube. The shorter column on top (in the form of a gel or aqueous solution) has a higher electrolyte concentration, and the longer gel column is placed at the bottom, in which a continuous precipitation zone and/or Liesegang bands form. Because only limited systems have been reported to form Liesegang bands [1], it is scientifically interesting and technologically important to widely explore systems in which Liesegang-band-like precipitation patterns could form.
Recently, we proposed a new class of systems to stochastically form Liesegang-band-like, periodic precipitation bands of Cu–Fe-based Prussian blue analogs (Cu–Fe PBA) in agarose gel through the coupled processes of 1) electrochemical reactions to generate reactant ions, 2) diffusion of the reactant ions influenced by the electric field in the gel, and 3) reactions of the reactant ions to form precipitates, that is, reaction–diffusion–reaction (RDR) processes [11]. The proposed system is illustrated in Figure 1.
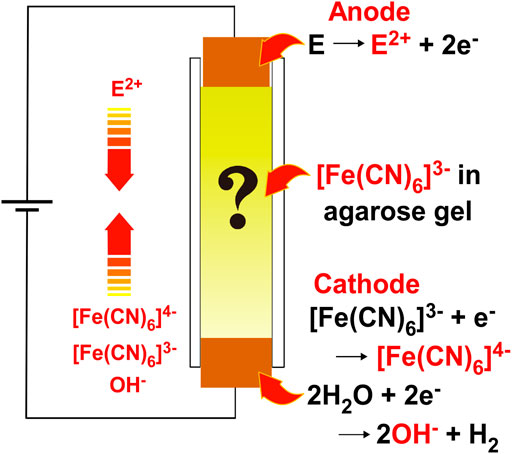
FIGURE 1. A schematic illustration of the reaction–diffusion–reaction (RDR) setup in which electrochemical reactions to generate reactant ions, diffusion of the reactant ions influenced by an electric field, and reactions of the reactant ions to form precipitates are coupled to generate precipitation patterns of PB or PBA in agarose hydrogel. The arrows indicate the movement directions of reactant ions in the electric field.
The setup in Figure 1 is simple: it consists only of agarose gel with [FeIII(CN)6]3‒ ions in a plastic straw sandwiched between two metal rods for voltage application. However, the chemical processes that occur within this system are considerably complicated. The reactant metal ions (E2+: E = Fe or Cu in this study) and reactant [FeII(CN)6]4‒ ions are generated at the anode and cathode by reactions (1) and (2), respectively, when the applied voltage exceeds the sum of the overpotential of the electrodes and the potentials of the electrode reactions (typically ∼1 V [11])
For E = Fe, because aqueous Fe2+ ions are easily oxidized by dissolved oxygen in the hydrogel, Fe3+ ions are generated by
Additionally, side reactions that form H+ and OH− ions are also possible at the anode and cathode, respectively
The ions generated by reactions (1‒5) are transported under the influence of the electric field and thermal diffusion and react with each other to form precipitates of Prussian blues (PB) or Prussian blue analogs (PBA), which are generally represented by the formula AxEy [E′(CN)6]z□1‒z‧nH2O [A is an alkali metal element, and E (= Mg, V, Cr, Mn, Fe, Co., Ni, Cu, Zn, Ag, Ce, Sm, Bi, etc.) and E′ (= V, Cr, Mn, Fe, Co., Ru, etc.) are specific (mainly transition) metal elements; A = K and E′ = Fe in this study]. Here, if E = E′ = Fe, the compounds are generally called “PB; ” if not, they are called “E–E′-based PBA” (for example, for E = Cu and E′ = Fe, they are called “Cu–Fe-based PBA”). The symbol □ indicates E′(CN)6 vacancies, that is, defects resulting from missing E′(CN)6 moieties. For most PBA, 0 ≤ x ≤ 2, y = 1, and 0 < z ≤ 1; for example, x = y = z = 1 for CuII-FeIII PBA with no Fe(CN)6 vacancies. Thus, the possible reactions to form PB/Cu‒Fe PBA precipitates in the proposed system can be expressed as
Note that 1) the compounds KxFeIIy[FeIII(CN)6]z□1‒z‧nH2O, which are generated by reaction (6) for E = Fe, are unstable and readily transformed into KxFeIIIy[FeII(CN)6]z□1‒z‧nH2O:
2) the compounds KxFeIIIy [FeIII(CN)6]z□1‒z‧nH2O, which are historically called “Berlin green (BG),” are soluble and do not form precipitates [12]. Thus, for E = Fe, two types of precipitates, KxFeIIIy [FeII(CN)6]z□1‒z‧nH2O and KxFeIIy [FeII(CN)6]z□1‒z‧nH2O, are expected. The former is “PB” in the strict sense, and the latter is historically called “Prussian white (PW)” [12]. For E = Cu, two types of precipitates, KxCuIIy [FeIII(CN)6]z□1‒z‧nH2O and KxCuIIy [FeII(CN)6]z□1‒z‧nH2O, are possible, which are generated by reactions (6) and (7), respectively.
Because the surfaces of the E metal are generally reactive to [FeIII(CN)6]3‒and [FeII(CN)6]4‒ ions [11], precipitates of PB and PBA can also form on the surfaces of the electrodes [if they consist of E metal(s)]. For example, reactions (1) and (2) can occur at the metal surface and the gel surface in contact with the metal, respectively, even without voltage application. At the cathode/anode of the E metal, the E2+/[FeII(CN)6]4‒ ions generated at these surfaces can react with the [FeII(CN)6]4‒/E2+ ions generated electrochemically to produce precipitates of KxEIIy [FeII(CN)6]z□1‒z‧nH2O. At the anode, direct electrochemical production of KxEIIy [FeII(CN)6]z□1‒z‧nH2O is also possible through
Note also that the OH− ions generated by reaction (5) can form precipitates of metal hydroxides through
Here, FeII(OH)2 [E = Fe in reaction (12)] is relatively unstable in aqueous solutions or hydrogels and is rapidly oxidized by
Thus, three types of colored precipitates, which provide multicolored precipitation patterns in gels, are expected to form in the RDR system shown in Figure 1: for E = Cu, these are KxCuIIy [FeII(CN)6]z□1‒z‧nH2O (CuII–FeII PBA), KxCuIIy [FeIII(CN)6]z□1‒z‧nH2O (CuII–FeIII PBA), and CuII(OH)2; for E = Fe, these are KxFeIIy [FeII(CN)6]z□1‒z‧nH2O (PW), KxFeIIIy [FeII(CN)6]z□1‒z‧nH2O (PB), and FeIII(OH)3.
Furthermore, OH− ions can dissolve the precipitates of PB and PBA [13] (both at the surface of electrodes and in agarose gel) through
As shown above, the chemistry of the proposed RDR system is considerably complicated; hence, the generated precipitation patterns may strongly depend on the preparation conditions. In this paper, we comprehensively report the diverse precipitation patterns of PB and Cu–Fe PBA observed in the RDR system. This is an extension of a previous study [11] exploring the experimental conditions under which periodic patterns are observed with high probability. Because very little is currently known about RDR patterning (only for Cu–Fe PBA system [11]), the present study (although qualitative) is useful for outlining this novel class of macroscopic patterning.
Additionally, the RDR patterning of PB and PBA is also interesting from the perspective of applications in material science because PB and PBA have attracted significant interest as multifunctional platforms for various applications [14] such as magnets [15, 16], batteries [13, 17, 18], catalysts [19], gas adsorbents [20‒22], and radioactive-Cs adsorbents [20,23‒25] owing to their characteristic crystal structures. Generally, PB/PBA properties are strongly influenced by the Fe(CN)6 vacancies (or the value of z), the amount of which depends considerably on the preparation process [13, 15, 17]. Therefore, if we could prepare gels containing PB/PBA with position-dependent variation of Fe(CN)6 vacancies using RDR processes in the future, the RDR patterning may be used to simultaneously obtain PB/PBA with different functional properties [11].
Analytical reagent-grade K3 [FeIII(CN)6] (≥99.0%), K4 [FeII(CN)6]∙3H2O (≥99.5%), FeIISO4∙7H2O (≥99.0%), FeIIICl3∙6H2O (≥99.0%), and CuIICl2∙2H2O (≥99.0%) were obtained from Wako Pure Chemical Industries (Osaka, Japan). Agarose for electrophoresis (gel strength: 1,800–2300 g/cm3) was purchased from Kanto Chemical (Tokyo, Japan). All chemicals were used without further purification. All aqueous solutions were prepared using deionized water that had been purified from tap water using a cartridge water purifier (G-10: Organo, Tokyo, Japan). For the electrodes, Ti (≥99.5%), Fe (≥99.5%), and Cu (≥99.9%) rods were obtained from Nilaco (Tokyo, Japan).
A sample tube filled with agarose gel containing [FeIII(CN)6]3– ions was prepared as described below. Appropriate amounts of K3 [FeIII(CN)6] powder were dissolved in deionized water at 25°C to form a [FeIII(CN)6]3– solution (30 ml) with a concentration of 0.050–0.100 M. After adding 2.0 mass% agarose, the mixture was stirred vigorously at 98°C for 30 s to produce a uniform [FeIII(CN)6]3–agarose sol. Note that the density of the employed agarose sol was relatively high to suppress gel shrinkage when a voltage was applied. Using a Pasteur pipette, the prepared sol was transferred to plastic straws (4 mm in diameter and 50 mm long), the bottoms of which were plugged with a metal (Ti, Fe, or Cu) rod with a diameter of 4 mm and length of ∼20 mm, which was used as the cathode. Because the sol was viscous and solidified within 1000 s, it did not leak from the bottom of the straws. Plastic straws were employed as sample holders because they are simple to process and use, low-cost, and enable the easy introduction of viscous samples [26]. The hot sol in the straw was left to cool to 25°C, thus forming a solidified gel. The height of the gel column in the sample tube was ∼40 mm.
Another metal rod (Fe or Cu; 3 mm in diameter and ∼20 mm long) was placed atop the gel as the anode. This metal rod was narrower than that at the bottom of the tube. Because it did not fit tightly inside the straw, the metal anode maintained contact with the gel surface even when the electric field caused the gel sample to contract. The cathode and anode were connected to a programmable power supply (1696B, B&K Precision, Yorba Linda, CA, United States). During voltage application at 25°C for 20–100 h (current <1 mA), the precipitation patterns formed in the sample tube were monitored using a digital camera (IXY650, Canon, Japan). In some experiments, not only constant voltage application, but also cyclic alternating voltage application [11] were examined. After these voltage applications, several gel samples were removed from the straws and repeatedly immersed in deionized water (∼200 ml) for 3 days to remove unreacted [FeIII(CN)6]3– ions and soluble compounds (these ions and compounds were spontaneously eluted from the gels into water). Without such immersion, the precipitation patterns in the gel occasionally changed (within 50 h), implying that precipitation reactions in the gel can proceed even without voltage application; however, such changes were not significant [11].
For comparison, precipitates of PB and Cu‒Fe PBA were formed in aqueous solutions as follows: 0.050 M [FeIII(CN)6]3–/[FeII(CN)6]4– aqueous solutions (0.1 ml) were prepared in glass tubes (4 mm in diameter and 60 mm long) by dissolving K3 [FeIII(CN)6]/K4 [FeII(CN)6]∙3H2O powder in deionized water at 25°C. Separately, 0.250 M aqueous solutions of Fe2+, Fe3+, and Cu2+ (0.1 ml) were prepared by dissolving powders of FeIISO4∙7H2O, FeIIICl3∙6H2O, and CuIICl2∙2H2O, respectively, in deionized water at 25°C and were mixed with the 0.050 M [FeIII(CN)6]3–/[FeII(CN)6]4– solutions. Precipitates of PB or Cu‒Fe PBA formed immediately in the mixed solutions.
The precipitates of PB and PBA are known to exhibit various colors depending on the types of E2+ ions and the oxidation states of Fe [27]. Figure 2 shows the precipitates of PB and Cu‒Fe PBA formed in aqueous solutions with labeled precipitate colors. The characteristic colors of these precipitates are useful for assigning the types of PB and Cu‒Fe PBA formed in the RDR systems, as described later.
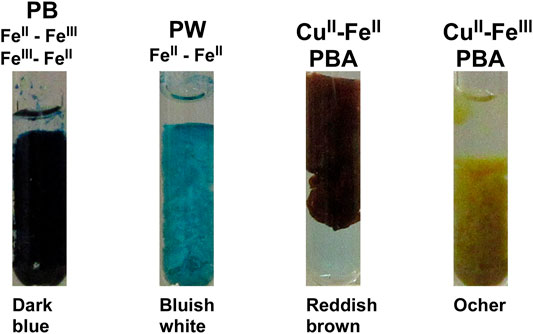
FIGURE 2. Precipitates of PB, PW, and Cu‒Fe PBA formed at 25°C in aqueous solutions. The types of precipitates are indicated at the top. The colors of these precipitates are labeled at the bottom.
Figures 3A,B show typical multicolored patterns formed at 25°C in the RDR system of the Cu–Fe PBA and PB, respectively, under an applied voltage of 2 V for 50 h. The initial [FeIII(CN)6]3‒concentration was 0.050 M. Despite its intrinsic stochasticity, the pattern shown in Figure 3A was primarily the same as that previously reported [11].
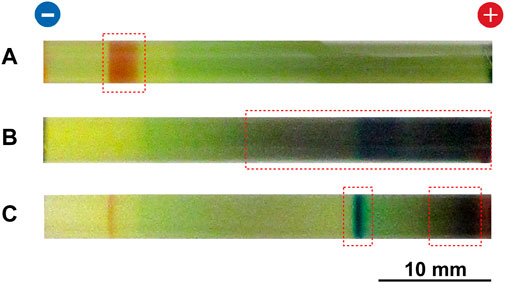
FIGURE 3. Typical multicolored patterns formed at 25°C in the RDR system of (A) Cu–Fe PBA and (B) PB under an applied voltage of 2 V for 50 h. For the PB system, (C) the pattern formed under an applied voltage of 2 V for 20 h is also depicted. The initial [FeIII(CN)6]3‒concentration and the initial agarose density were 0.050 M and 2.0 mass%, respectively. The regions in which a precipitation band of PB or Cu‒Fe PBA was formed are indicated by red squares. The charges of the electrodes and a scale bar are provided at the top and bottom of the images, respectively.
As reported previously [11], in the Cu–Fe PBA system, a relatively short reddish-brown band formed on the cathode side (Figure 3A), suggesting the accumulation of CuII–FeII PBA after 50 h of voltage application. Meanwhile, a wide region on the anode side became green, which is the color of aqueous Cu2+ ions (providing a blue color) that were mixed with [FeIII(CN)6]3‒ ions (providing a yellow color) [11]. Thus, the green color suggests the accumulation of aqueous Cu2+ ions without generating CuII–FeIII PBA, which are typically ocher (Figure 2). These findings suggest that precipitation reaction (7) is more dominant than reaction (6) in the agarose gel. Note that significant amounts of reddish-brown deposits accumulated at the cathode and anode surfaces [11], suggesting that at the electrode surfaces reaction (7) [as well as reaction (11)] is again more dominant than reaction (6).
Interestingly, the pattern observed in the PB system (Figure 3B) was completely different from that of the Cu–Fe PBA system. Here, a relatively long dark-blue (characteristic color of PB; Figure 2) band with graduations in color was observed on the anode side, suggesting the accumulation of PB precipitates. The PB accumulation on the anode side was considered to be due to the extremely low solubility of PB: for example, at 25°C, the base 10 logarithm of the solubility constant for PB (−40.52) is much lower than that for MnII–FeII-based PBA (−12.10), CoII–FeII-based PBA (−14.74), NiII–FeII-based PBA (−14.89), and CuII–FeII PBA (−15.89) [28]. Owing to this property, the Fe2+ ions produced at the anode could readily form PB precipitates via reaction (6) with the initially loaded [FeIII(CN)6]3‒ ions [and the subsequent reaction (10)]. Additionally, significant amounts of dark-blue deposits accumulated at the cathode and anode surfaces. Note that bluish-white PW precipitates could not be clearly observed anywhere in this system. The lack of PW (FeII–FeII) precipitates suggests that in the PB system, precipitation reaction (6) to produce PB was more dominant than reaction (7) to produce PW. This opposite trend to the Cu–Fe PBA system can be explained by two factors: 1) generally, the reduced species [FeII(CN)6]4‒ ions, are less abundant around the anode and 2) Fe2+ ions are easily oxidized to Fe3+ ions in the hydrogel through reaction (3).
As shown in Figure 3C, until ∼20 h of voltage application, the dark-blue PB band was located away from the anode surface and its bandwidth was significantly narrow. The color around the anode surface was dark brown which is the color of the BG (and possibly Fe3+ ion-related compounds including FeIII(OH)3). This observation suggests that, around the anode, side reactions (3), (8), and/or (12–14) were competitive with the PB-forming reaction (6). Here, competitive FeIII(OH)3 formation is possible because the base 10 logarithm of the solubility constant for FeIII(OH)3 (−36.35) is comparable to that for PB (−40.52) at 25°C [28]. Additionally, Figure 3C shows a thin brown band near the cathode, which was occasionally (not always) observed in the PB system. The existence of this band suggests that the aforementioned side reactions can also contribute to band formation on the cathode side.
Figure 4 shows typical multicolored patterns formed at 25°C in the RDR system of the Cu–Fe PBA and PB under an applied voltage of 2 V for 100 h. Here, the initial [FeIII(CN)6]3‒concentration was 0.050 M.
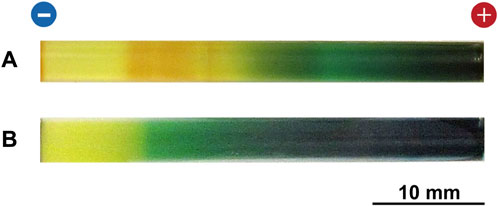
FIGURE 4. Typical multicolored patterns formed at 25°C in the RDR system of (A) Cu–Fe PBA and (B) PB under an applied voltage of 2 V for 100 h. The initial [FeIII(CN)6]3‒concentration and the initial agarose density were 0.050 M and 2.0 mass%, respectively. The charges of the electrodes and a scale bar are provided at the top and bottom of the images, respectively.
For Cu–Fe PBA (Figure 4A), the reddish-brown band broadened toward the anode with color fading, suggesting a decrease in the amount of CuII–FeII PBA. This observation can be explained as follows. Under long-time voltage application, CuII–FeII PBA precipitates in the precipitation band were partially decomposed by OH− ions [increasingly generated from the cathode by side reaction (5)] through reaction (15). Owing to the diffusion and electric field, the decomposed [FeII(CN)6]4‒ ions drifted to the anode side, where the green color deepened, suggesting the accumulation of Cu2+ ions [increasingly generated from the anode by reaction (1)]. Thus, these two types of reactant ions reacted on the anode side to re-produce CuII–FeII PBA, which resulted in the broadening of the CuII–FeII PBA band toward the anode. Meanwhile, for the PB system, the long-time voltage application broadened the almost-continuous dark-blue (PB) band toward the cathode side with a deepening color (compare Figures 3B, 4B), suggesting the continuous accumulation of PB precipitates with time. Thus, long-time voltage application was effective in broadening the precipitation band of PB and CuII–FeII PBA but not in forming their periodic bands.
Figure 5 shows typical multicolored patterns formed at 25°C in the RDR system of the Cu–Fe PBA and PB under an applied voltage of 2 V. Here, the initial [FeIII(CN)6]3‒concentration was 0.100 M.
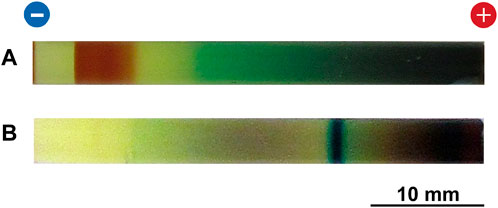
FIGURE 5. (A) Typical multicolored pattern formed at 25°C in the Cu–Fe PBA system under an applied voltage of 2 V for 50 h. (B) Typical precipitation pattern formed at 25°C in the PB system under an applied voltage of 2 V for 20 h. The initial [FeIII(CN)6]3‒concentration and the initial agarose density were 0.100 M and 2.0 mass%, respectively. The charges of the electrodes and a scale bar are provided at the top and bottom of the images, respectively.
A comparison between Figures 3, 5 suggests a common effect of increasing [FeIII(CN)6]3‒ ions (0.050 M → 0.100 M) on the two systems: higher [FeIII(CN)6]3‒ concentrations significantly deepened the color of the generated patterns. For the Cu–Fe PBA system, an increase in the concentration broadened the reddish-brown (CuII‒FeII PBA) band. These findings are consistent with the expectation that the increase in [FeIII(CN)6]3‒ ions promotes the generation of reactant [FeII(CN)6]4‒ ions [via reaction (2)] and the precipitation of PB [via reaction (9)] and CuII–FeII PBA [via reaction (7)]. Interestingly, the comparison between Figures 3, 5 also suggests that higher [FeIII(CN)6]3‒ concentrations only slightly influenced the number and position of the PB/CuII–FeII PBA band; in other words, higher concentrations did not lead to periodic banding or a large shift in the band position. Based on these observations, the 0.050 M [FeIII(CN)6]3‒ concentration was primarily employed in this study because the multicolored patterns were generally most clearly observable at this concentration.
Figure 6 shows typical multicolored patterns formed at 25°C in the RDR system of the Cu–Fe PBA and PB under an applied voltage of 4 V. Here, the initial [FeIII(CN)6]3‒concentration was 0.050 M.
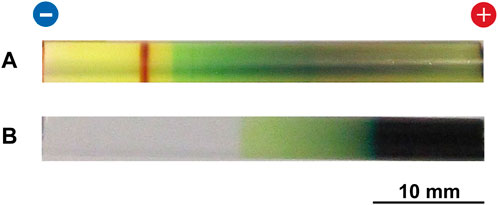
FIGURE 6. (A) Typical multicolored pattern formed at 25°C in the Cu–Fe PBA system under an applied voltage of 4 V for 50 h. (B) Typical precipitation pattern formed at 25°C in the PB system under an applied voltage of 4 V for 20 h. The initial [FeIII(CN)6]3‒concentration and the initial agarose density were 0.050 M and 2.0 mass%, respectively. The charges of the electrodes and a scale bar are provided at the top and bottom of the images, respectively.
For the Cu–Fe PBA system, a comparison between Figures 3A, 6A indicates that the propagation of the reddish-brown CuII–FeII PBA band to the anode side was considerably suppressed at 4 V, and the bandwidth was narrower than that at 2 V. Meanwhile, the CuII–FeII PBA band did not increase in number upon the application of 4 V. These observations suggest that increasing the applied voltage is effective in restricting the broadening of the CuII–FeII PBA band but not in the formation of periodic bands.
In the PB system under the application of 4 V, only a relatively long, thick dark-blue band was formed in the region close to the anode, followed by a thin green region (Figure 6B). The yellow color of [FeIII(CN)6]3‒ ions disappeared near the cathode, indicating that the anode strongly attracted [FeIII(CN)6]3‒ions. The relatively narrow, discrete, dark-blue PB band that formed at 2 V (observed in Figure 3C) disappeared. Thus, for the PB system, the 4 V application hindered periodic banding or even the formation of a discrete PB band.
In addition, the application of a constant voltage of 4 V or higher occasionally resulted in several experimental problems, particularly for long-time observations (≥50 h). For example, the agarose gel occasionally shrank during the application of a constant voltage of 4 V, primarily on the cathode side. At higher voltages, such shrinkage occurred more frequently and prevented detailed observation. Furthermore, at voltages greater than 4 V, contact between the cathode and gel was frequently lost, possibly because of the formation of H2 bubbles generated by reaction (5) on the cathode surface (although the bubbles were not observed in the gels by the naked eye). At less than 2 V (such as 1.5 V), the precipitation bands of PB and CuII–FeII PBA were not clearly observed, even after 100 h (not shown here). Thus, in this study, the applied constant voltages for examining precipitation patterns in detail were limited to 2‒4 V.
The multicolored patterns shown in Figures 3‒6 were obtained when the same metal was used as the anode and cathode. If the precipitates of PB and PBA formed only through the precipitation reactions (6), (7), or (9) of the reactant ions that were simply produced by reactions (1) and (2) at the electrodes and were subsequently moved by diffusion and the electric field in the gel (Figure 1 is depicted according to this simple model), the substitution of the cathode metal is expected to hardly change the precipitation pattern because any metal, in principle, can operate as a cathode to reduce [FeIII(CN)6]3‒ ions.
Figure 7 shows typical multicolored patterns formed at 25°C in the RDR system of the Cu–Fe PBA and PB commonly using a Ti cathode under an applied voltage of 2 V. Here, the initial [FeIII(CN)6]3‒concentration was 0.050 M, and the voltage application periods were set to be the same as those employed to observe the patterns in Figures 3A,C: 50 and 20 h. Ti metal was selected as the cathode because it can generate [FeII(CN)6]4‒ ions but cannot provide PB or Cu‒Fe-PBA at its surface.
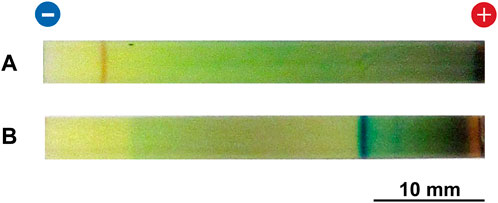
FIGURE 7. (A) Typical multicolored pattern formed at 25 °C in the Cu–Fe PBA system using a Ti rod as a cathode under an applied voltage of 2 V for 50 h. (B) Typical precipitation pattern formed at 25°C in the PB system using the Ti cathode under an applied voltage of 2 V for 20 h. The initial [FeIII(CN)6]3‒concentration and the initial agarose density were 0.050 M and 2.0 mass%, respectively. The charges of the electrodes and a scale bar are provided at the top and bottom of the images, respectively.
As shown in Figure 7A, substitution into the Ti cathode clearly blocked the formation of the CuII–FeII PBA band, and a narrow, reddish-brown band was barely observed on the cathode side, but its color was very light, indicating that the amount of CuII–FeII PBA in the band was very low. This observation suggests that the CuII–FeII PBA precipitates generated at the Cu cathode surface considerably contributed to the CuII–FeII PBA band in the agarose gel. The CuII–FeII PBA precipitates at the cathode surface can be decomposed through reaction (15) by OH− ions generated at the cathode by reaction (5). The [FeII(CN)6]4‒ ions and charged fragments of the precipitates thus generated can disperse owing to diffusion and an electric field to re-produce CuII–FeII PBA precipitates in the agarose gel.
The above mechanism is expected to be less effective for the PB system because the PB band formed on the anode side, suggesting that the reactions with the initially loaded [FeIII(CN)6]3‒ ions near the anode were dominant in forming the band patterns. Indeed, a comparison between Figures 3C, 7B indicates that the substitution of the cathode from Fe to Ti only slightly affected the dark-blue PB band on the anode side. Interestingly, a thin brown band on the cathode side, which was occasionally observed using the Fe cathode (Figure 3C), always disappeared completely through this cathode substitution. This finding suggests that the formation of the thin brown (not PB) band requires several fragments generated from PB at the Fe cathode surface through reaction (17). Thus, we deduced that the formation and decomposition of PB or CuII–FeII PBA precipitates at the Fe or Cu cathode surfaces, respectively, are important for the formation of precipitate band(s) in the gel near the cathode.
Figure 8A shows a typical precipitation pattern (formed at 25°C under an applied voltage of 2 V for 50 h) after the removal of the unreacted ions and soluble compounds from the Cu–Fe PBA system. The initial [FeIII(CN)6]3‒concentration was 0.050 M. As expected, the characteristic yellow color of the [FeIII(CN)6]3‒ ions disappeared and the reddish-brown CuII–FeII PBA band persisted. Note that the ocher color of the CuII–FeIII PBA was not observed in Figure 8A. Interestingly, the blue color remained over a wide area on the anode side (right side of Figure 8A). This finding suggests that the Cu2+ ions formed sparingly soluble CuII(OH)2 on the anode side through side reactions (12) and/or (15) with OH− ions that migrated to the anode side under the influence of a constant 2 V application. These observations confirm the suggestion provided by Figure 3A that in the Cu–Fe PBA system [FeIII(CN)6]3‒ ions are less reactive with aqueous Cu2+ ions than [FeII(CN)6]4‒ and OH− ions; in other words, reaction (6) is less active than reactions (7) and (12).
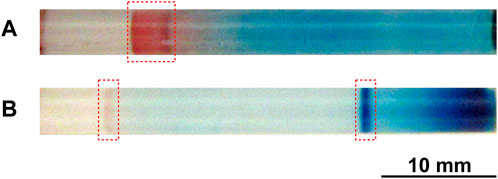
FIGURE 8. (A) Typical precipitation pattern (formed at 25°C under an applied voltage of 2 V for 50 h) after removing unreacted ions and soluble compounds from the Cu–Fe PBA system. (B) Typical precipitation pattern (formed at 25°C under an applied voltage of 2 V for 20 h) after removing unreacted ions and soluble compounds from the PB system. The initial [FeIII(CN)6]3‒concentration and the initial agarose density were 0.050 M and 2.0 mass%, respectively. The regions in which a precipitation band was formed are indicated by red squares. A scale bar is provided at the bottom of the images.
Figure 8B shows a typical precipitation pattern (formed at 25°C under an applied voltage of 2 V for 20 h) after the removal of the unreacted ions and soluble compounds from the PB system. The initial [FeIII(CN)6]3‒concentration was 0.050 M. As expected, the characteristic yellow color of the [FeIII(CN)6]3‒ ions and the dark-brown color of the BG disappeared, and the discrete dark-blue PB band persisted. Interestingly, the dark-blue color remained in the region near the anode, although it was not very clear before the removal process (see Figures 3C, 5B, 7B), possibly because of the overlap with unreacted Fe3+ (yellow brown) and [FeIII(CN)6]3‒ ions (yellow) and the generated BG (dark brown). Furthermore, the bluish-white color of PW is not observed in Figure 8B. These observations confirm the suggestion provided by Figure 3B that, in the PB system, reaction (7) is less active than reaction (6). Additionally, it is interesting that a thin brown band on the cathode side, which was occasionally observed using the Fe cathode (Figure 3C) but not using the Ti cathode (Figure 7B), persisted. This finding suggests that the thin brown band did not consist of soluble BG, but sparingly soluble FeIII(OH)3; hence, the PB fragments required for its generation were FeIII(OH)3-related fragments, possibly provided by reaction (17) at the cathode surface.
Figure 9 shows typical multicolored patterns formed in the RDR system under cyclic alternating voltages of 4 V for 1 h and then 1 V for 4 h per cycle (the initial [FeIII(CN)6]3‒concentration was 0.050 M). In this cyclic voltage sequence, fewer reactant ions are produced at 1 V, and more reactant ions are produced at 4 V. Furthermore, the diffusion contribution to their transportation is more important at 1 V, and the drift contribution due to the electric field is more important at 4 V.
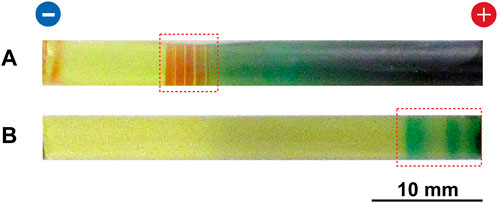
FIGURE 9. Typical multicolored patterns formed at 25°C in the RDR system of (A) Cu–Fe PBA and (B) PB under cyclic alternating voltages of 4 V (1 h) and 1 V (4 h). The Cu–Fe PBA pattern was obtained by 20 cycles (100 h), and the PB pattern was obtained by four cycles (20 h). The initial [FeIII(CN)6]3‒concentration and the initial agarose density were 0.050 M and 2.0 mass%, respectively. The regions in which periodic precipitation bands were formed are indicated by red squares. The charges of the electrodes and a scale bar are provided at the top and bottom of the images, respectively.
In the Cu–Fe PBA system (Figure 9A), several periodic (that is, Liesegang-band-like), short reddish-brown CuII–FeII PBA bands (which were not observed under constant voltage; see Figures 3A‒7A) were observed within a relatively narrow region (<8 mm) near the cathode. Figure 10 shows an enlarged image of the periodic bands in Figure 9A after removing unreacted ions and soluble compounds; 1 mm graduations are shown for ease of comparison. These periodic bands were numbered from i = 1 (cathode side) to 12 (anode side). Because of the stochastic nature, the periodic pattern shown in Figure 10 was not completely the same as the pattern previously reported [11]; however, it exhibited similar basic features, including a band number of ∼12 and the existence of the blue band.
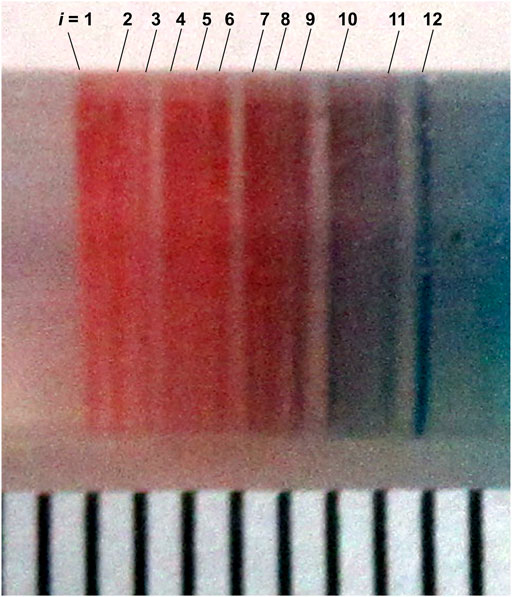
FIGURE 10. Enlarged image of the periodic bands shown in Figure 9A after removing unreacted ions and soluble compounds. The bands are numbered from 1 (the cathode side) to 12 (the anode side). For comparison, 1 mm graduations are also shown at the bottom of the image.
As reported previously [11], these periodic bands stochastically formed with a probability of ∼50% after 40 h of cyclic voltage application (eight cycles), and the number of bands increased with time (within 12 ± 5 after removing unreacted ions). Here, ∼50% formation of periodic bands indicates that when the m gel samples are prepared under the same experimental conditions (in this study, typically m = 24), we may observe periodic banding in ∼m/2 samples. In the other ∼m/2 samples, an almost continuous band with several lengths was formed, implying an overlap of the periodic bands [11]. The periodic bands maintained their positions during the observation period, and several bands were blue (for example, the band with i = 12 in Figure 10), strongly suggesting the presence of CuII(OH)2 [11].
It is well known that Liesegang bands tend to follow an empirical scaling law, the so-called spacing law, irrespective of the electrolyte pair and geometry of the system: Xi+1/Xi = 1 + p, where Xi is the position of the i-th band and p > 0 for most systems [1, 2, 5–8]. The spacing law means that the space between adjacent bands increases monotonically with i [11]. Meanwhile, Figure 10 indicates that the band space obtained in the Cu–Fe PBA system did not increase monotonically with i but remained approximately constant (∼0.3 mm) with a broad dispersion (±0.3 mm), thus failing to obey the spacing law. It is not surprising that the periodic banding in Figure 10 disobeyed the spacing law because the mechanism to form periodic bands in the proposed RDR system fundamentally differs from that in the conventional RD system used to examine Liesegang banding. Currently, no mathematical model is available to explain the periodic banding observed in RDR systems under cyclic alternating voltages. A deeper understanding of this new class of periodic banding is urgently required.
In the PB system (Figure 9B), the cyclic alternating voltage application could split a discrete precipitation band (which formed under constant voltage pplications; Figures 3C, 5B, 7B, 8B) into a few bands near the anode. Such splitting stochastically occurred with a probability of ∼50% after 10 h of cyclic voltage application (two cycles), whereas in the other ∼50% of the scenarios, the cyclic alternating voltage application caused the discrete precipitation band to be completely painted out in a continuous band. The observed split bands were broader and more blurred than the periodic bands in the Cu–Fe PBA system, and their numbers were less than three. By combining these findings and the suggestions from Figures 3B, 7B, 8B that in the PB system, the reactions with the initially loaded [FeIII(CN)6]3‒ ions are dominant, we deduced that the cyclic voltage application is more effective for forming periodic precipitation bands when both the anode and cathode can supply the reactant ions of the precipitates.
Based on the above results, the Cu–Fe PBA system is employed hereafter for more detailed analyses of the factors that form periodic bands under cyclic alternating voltages. Note that the precipitation band formation in the RDR system is stochastic to an extent; hence, we can suggest only the general trend of the patterning, depending on some factors.
Figures 11A,B show typical multicolored patterns formed at 25°C in the Cu–Fe PBA system under 10 cycles of alternating voltages of 4 V for 1 h and 1 V for 9 h per cycle, and 40 cycles of alternating voltages of 4 V for 1 h and 1 V for 1.5 h per cycle, respectively (the initial [FeIII(CN)6]3‒concentration was 0.050 M). Compared with the reddish-brown bands shown in Figure 9A, the bands in Figure 11A are considerably broad, distorted, and defective in shape. These diffusive features suggest the strong influence of diffusion to reactant ions, primarily because of the relatively long period of 1 V application. In contrast, the reddish-brown bands in Figure 11B are significantly narrow, thick in color, and overall similar to the corresponding bands observed in Figure 6A (obtained under a constant 4 V application). This similarity is not surprising because such a frequently alternating voltage application can be approximated as a constant 4 V application.
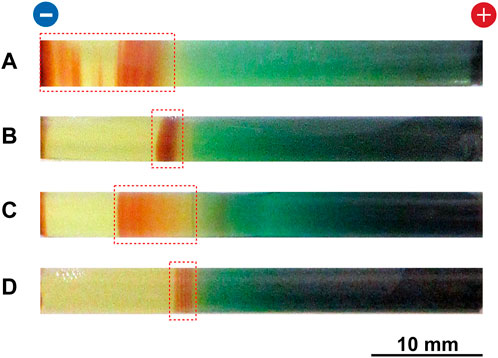
FIGURE 11. Typical multicolored patterns formed at 25°C in the Cu–Fe PBA system under various cyclic alternating voltage conditions. The initial [FeIII(CN)6]3‒concentration and the initial agarose density were 0.050 M and 2.0 mass%, respectively. The multicolored patterns (A,B) were obtained by 10 cycles of alternating voltages of 4 V (1 h) and 1 V (9 h) and 40 cycles of alternating voltages of 4 V (1 h) and 1 V (1.5 h), respectively. The multicolored patterns (C,D) were obtained by 20 cycles of alternating voltages of 3 V (1 h) and 1 V (4 h) and 5 V (1 h) and 1 V (4 h), respectively. For each sample, the total voltage application time was set to 100 h. The regions in which periodic bands were formed are indicated by red squares. The charges of the electrodes and a scale bar are provided at the top and bottom of the images, respectively.
Figures 11C,D show typical multicolored patterns formed at 25°C in the Cu–Fe PBA system under 20 cycles of alternating voltages of 3 V for 1 h and 1 V for 4 h per cycle, and 5 V for 1 h and 1 V for 4 h per cycle, respectively (the initial [FeIII(CN)6]3‒concentration was 0.050 M). As shown in Figure 11C, the alternating voltage application of 3 V (1 h) and 1 V (4 h) broadened the precipitation band, whereas its band shape was almost continuous, unlike that under the 4 V (1 h) and 1 V (4 h) conditions (Figure 9A). Thus, this alternating voltage application does not seem to be effective in producing periodic bands. In contrast, as shown in Figure 11D, the alternating voltage application of 5 V (1 h) and 1 V (4 h) tended to generate several periodic bands, similar to the 4 V (1 h) and 1 V (4 h) applications, but the regions forming the bands were considerably limited (<3 mm).
Thus, we conclude from the results in Figure 11 that 1) the voltage and period of alternating voltage application strongly influence the resultant precipitation patterns, and 2) currently, the application of 4 V (1 h) and 1 V (4 h) is the most effective for generating periodic bands over a relatively wide region in the gel.
As shown in Figures 3‒11, the RDR system (Figure 1) can generate various types of precipitation patterns of PB and CuII‒FeII PBA with a significant aesthetic appeal, depending on the type of electrode and the conditions of voltage application. Its preparation and operation are simple and low-cost [for example, constant-voltage experiments can be performed within $130: a plastic straw ($ ∼0.01), metal rods ($ ∼2), agarose ($ ∼85), K3 [FeIII(CN)6] ($ ∼40), and two dry cells ($ ∼1.5)], but its chemistry is complicated and its physics is interesting. These features make the proposed RDR system a fascinating educational tool for pattern forming. Furthermore, RDR patterning of PB and PBA is potentially applicable in materials science [11]. However, from the perspective of the practical applications of RDR patterning, many challenges remain. For example, in the Cu‒Fe PBA system, periodic banding only occurred stochastically (with a probability of ∼50%), and some byproducts such as CuII(OH)2 were present in the bands. These characteristics can hinder its application; hence, better control over RDR patterning is required, including the reproducibility of the obtained patterns and the amounts of PB or PBA and byproducts in the RDR system.
Achieving better control of the RDR patterns requires a deeper understanding of the observations reported in this paper, particularly periodic banding under an alternating voltage application (Figures 9‒11). As previously mentioned [11], a theoretical framework applicable to the RDR system should be developed. Optimal experimental conditions for producing well-controlled patterns should be further explored. In addition to the initial concentration of [FeIII(CN)6]3‒ ions (Figure 5), cathode metals (Figure 7), applied voltages (Figures 6, 11), and application periods (Figures 4, 11), several factors can change the precipitation patterns: for example, the length and diameter of the gel column, gel type [29], gel density [29], and the presence of magnetic fields [30]. Precipitation patterns, including periodic bands, should be examined while varying these factors. The extension of the RDR experiments to other PBA systems is also interesting; for example, the RDR patterning of Co‒Fe-based PBA and Ni‒Fe-based PBA can be easily examined using the current setup by substituting for Co and Ni electrodes. It is also important to comprehensively characterize the reaction products, including byproducts, formed in the precipitation band(s), other colored regions in the gel, and anode and cathode surfaces. For example, X-ray absorption fine structure spectroscopy and X-ray diffractometry are useful for investigating the local structure(s) around the metal atoms and the crystallinity of the generated compounds, respectively. Scanning electron microscopy and micro-X-ray fluorescence mapping may be helpful for determining the characteristics and distribution of the byproducts. If possible, effective methods should be developed to remove (or at least suppress) the byproducts. Additionally, electrochemical processes at the boundaries between the metal electrodes and agarose gel should be further investigated. Electrochemical measurements capable of detecting μA levels may provide insights into this issue. Thus, further research across several scientific fields is required.
In a significantly simple RDR system, diverse precipitation patterns of PB and CuII‒FeII PBA were generated, depending on the type of metal electrode, applied voltage, initial [FeIII(CN)6]3‒ concentration, and elapsed time after voltage application. We observed that 1) cyclic alternating voltage applications (particularly, that of 4 V for 1 h and 1 V for 4 h per cycle) could generate Liesegang-band-like periodic bands (although stochastically with a probability of ∼50%); and 2) OH− ions, a byproduct of the cathode, considerably influence the resultant patterns through the formation of hydroxide precipitates in the gel and the decomposition of the PB/CuII‒FeII PBA precipitates generated at the cathode surface. Despite these findings, many aspects of the RDR patterning remain unclear. The novelty, simplicity of handling, diversity of the observed patterns, significant aesthetic appeal, and associated potential applications warrant further investigation of the RDR patterning of PB and PBA.
The original contributions presented in the study are included in the article/Supplementary Materials; further inquiries can be directed to the corresponding author.
HH conceived the concept, performed the experiments, analyzed the results, wrote the manuscript, and prepared the figures.
This research was funded by the JSPS KAKENHI (grant number JP19K05409).
The authors declare that the research was conducted in the absence of any commercial or financial relationships that could be construed as a potential conflict of interest.
All claims expressed in this article are solely those of the authors and do not necessarily represent those of their affiliated organizations, or those of the publisher, the editors and the reviewers. Any product that may be evaluated in this article, or claim that may be made by its manufacturer, is not guaranteed or endorsed by the publisher.
The author is grateful to R. Matsumoto, M. Arai, H. Kawakami, M. Shinoda, A. Seimiya, N. Taniguchi, and H. Matsumoto of Japan Women’s University for their aid in sample preparation.
1. Nabika H. Liesegang Phenomena: Spontaneous Pattern Formation Engineered by Chemical Reactions. Cpc (2015) 5:5–20. doi:10.2174/187794680501150908110839
2. Nabika H, Itatani M, Lagzi I. Pattern Formation in Precipitation Reactions: the Liesegang Phenomenon. Langmuir (2020) 36:481–97. doi:10.1021/acs.langmuir.9b03018
3. Sadek S, Sultan R. Liesegang Patterns in Nature: A Diverse Scenery across the Sciences. In: I Lagzi, editor. Precipitation Patterns in Reaction–Diffusion Systems. Kerala, India: Research Signpost (2010). p. 1.
5. Henisch H. Crystals in Gels and Liesegang Rings. Cambridge, UK: Cambridge University Press (1988). p. 116.
6. Nakouzi E, Steinbock O. Self-organization in Precipitation Reactions Far from the Equilibrium. Sci Adv (2016) 2:e1601144. doi:10.1126/sciadv.1601144
7. Arango-Restrepo A, Barragán D, Rubi JM. Self-Assembling outside Equilibrium: Emergence of Structures Mediated by Dissipation. Phys Chem Chem Phys (2019) 21:17475–93. doi:10.1039/c9cp01088b
8. Grzybowski BA. Chemistry in Motion: Reaction–Diffusion Systems for Micro- and Nanotechnology. Chichester, UK: John Wiley & Sons (2009). p. 93.
9. Grzybowski BA, Bishop KJM, Campbell CJ, Fialkowski M, Smoukov SK. Micro- and Nanotechnology via Reaction-Diffusion. Soft Matter (2005) 1:114. doi:10.1039/b501769f
10. Grzybowski BA, Campbell CJ. Fabrication Using 'programmed' Reactions. Mater Today (2007) 10:38–46. doi:10.1016/s1369-7021(07)70131-1
11. Hayashi H, Suzuki T. A Reaction-Diffusion-Reaction System for Forming Periodic Precipitation Bands of Cu-Fe-Based Prussian Blue Analogues. Appl Sci (2021) 11:5000. doi:10.3390/app11115000
12. Karyakin AA. Prussian Blue and its Analogues: Electrochemistry and Analytical Applications. Electroanalysis (2001) 13:813–9. doi:10.1002/1521-4109(200106)13:10<813::aid-elan813>3.0.co;2-z
13. Li WJ, Han C, Cheng G, Chou SL, Liu HK, Dou SX. Chemical Properties, Structural Properties, and Energy Storage Applications of Prussian Blue Analogues. Small (2019) 15:1900470. doi:10.1002/smll.201900470
14. Azhar A, Li Y, Cai Z, Zakaria MB, Masud MK, Hossain MSA, et al. Nanoarchitectonics: A New Materials Horizon for Prussian Blue and its Analogues. Bcsj (2019) 92:875–904. doi:10.1246/bcsj.20180368
15. Verdaguer M, Girolami G. Magnetic Prussian Blue Analogs. In: JS Miller, and M Drillon, editors. Magnetism: Molecules to Materials V. Weinheim, Germany: Wiley‒VCH Verlag GmbH & Co. KGaA (2004). p. 283.
16. Pajerowski DM, Gardner JE, Frye FA, Andrus MJ, Dumont MF, Knowles ES, et al. Photoinduced Magnetism in a Series of Prussian Blue Analogue Heterostructures. Chem Mater (2011) 23:3045–53. doi:10.1021/cm2003337
17. Ma F, Li Q, Wang T, Zhang H, Wu G. Energy Storage Materials Derived from Prussian Blue Analogues. Sci Bull (2017) 62:358–68. doi:10.1016/j.scib.2017.01.030
18. Hurlbutt K, Wheeler S, Capone I, Pasta M. Prussian Blue Analogs as Battery Materials. Joule (2018) 2:1. doi:10.1016/j.joule.2018.07.017
19. Yu Z-Y, Duan Y, Liu J-D, Chen Y, Liu X-K, Liu W, et al. Unconventional CN Vacancies Suppress Iron-Leaching in Prussian Blue Analogue Pre-catalyst for Boosted Oxygen Evolution Catalysis. Nat Commun (2019) 10:2799. doi:10.1038/s41467-019-10698-9
20. Estelrich J, Busquets MA. Prussian Blue: A Safe Pigment with Zeolitic-like Activity. Ijms (2021) 22:780. doi:10.3390/ijms22020780
21. Kaye SS, Long JR. Hydrogen Storage in the Dehydrated Prussian Blue Analogues M3[Co(CN)6]2 (M = Mn, Fe, Co, Ni, Cu, Zn). J Am Chem Soc (2005) 127:6506–7. doi:10.1021/ja051168t
22. Svensson G, Grins J, Eklöf D, Eriksson L, Wardecki D, Thoral C, et al. Influence of the Presence of Different Alkali Cations and the Amount of Fe(CN)6 Vacancies on CO2 Adsorption on Copper Hexacyanoferrates. Materials (2019) 12:3371. doi:10.3390/ma12203371
23. Nielsen P, Dresow B, Heinrich HC. In Vitro Study of 137Cs Sorption by Hexacyanoferrates(II). Z Naturforsch B (1987) 42:1451–60. doi:10.1515/znb-1987-1114
24. Altagracia-Martínez M, Kravzov-Jinich J, Martínez-Núňez JM, Ríos-Castaňeda C, López-Naranjo F. Prussian Blue as an Antidote for Radioactive Thallium and Cesium Poisoning. Orphan Drugs Res Rev (2012) 2:13.
25. Sandal N, Mittal G, Bhatnagar A, Pathak DP, Singh AK. Preparation, Characterization, and In Vivo Pharmacoscintigraphy Evaluation of an Intestinal Release Delivery System of Prussian Blue for Decorporation of Cesium and Thallium. J Drug Deliv (2017) 2017:4875784. doi:10.1155/2017/4875784
26. Hayashi H, Takaishi M. Low-cost, High-Performance Sample Cell for X-ray Spectroscopy of Solutions and Gels Made from Plastic Straw. Anal Sci (2019) 35:651–357. doi:10.2116/analsci.18p538
27. Gotoh A, Uchida H, Ishizaki M, Satoh T, Kaga S, Okamoto S, et al. Simple Synthesis of Three Primary Colour Nanoparticle Inks of Prussian Blue and its Analogues. Nanotechnology (2007) 18:345609. doi:10.1088/0957-4484/18/34/345609
28. Sillen L. Stability Constants of Metal-Ion Complexes. Section I: Inorganic Ligands. London, UK: The Chemical SocietyBurlington House (1964). p. 52.
29. Hayashi H, Abe H. Gel-State Dependencies of Brown Patterns of Mn-Fe-Based Prussian Blue Analogues Studied by Combined X-ray Spectroscopies. Bcsj (2017) 90:807–19. doi:10.1246/bcsj.20170080
Keywords: precipitation pattern, periodic band structure, Prussian blue analog (PBA), reaction-diffusion system, electrochemical reaction (ECR)
Citation: Hayashi H (2022) Precipitation Patterns in Reaction–Diffusion–Reaction Systems of Prussian Blue and Cu–Fe-Based Prussian Blue Analogs. Front. Phys. 10:828444. doi: 10.3389/fphy.2022.828444
Received: 03 December 2021; Accepted: 28 February 2022;
Published: 01 April 2022.
Edited by:
Rabih Sultan, American University of Beirut, LebanonReviewed by:
Ivan L’Heureux, University of Ottawa, CanadaCopyright © 2022 Hayashi. This is an open-access article distributed under the terms of the Creative Commons Attribution License (CC BY). The use, distribution or reproduction in other forums is permitted, provided the original author(s) and the copyright owner(s) are credited and that the original publication in this journal is cited, in accordance with accepted academic practice. No use, distribution or reproduction is permitted which does not comply with these terms.
*Correspondence: Hisashi Hayashi, aGF5YXNoaWhAZmMuand1LmFjLmpw
Disclaimer: All claims expressed in this article are solely those of the authors and do not necessarily represent those of their affiliated organizations, or those of the publisher, the editors and the reviewers. Any product that may be evaluated in this article or claim that may be made by its manufacturer is not guaranteed or endorsed by the publisher.
Research integrity at Frontiers

Learn more about the work of our research integrity team to safeguard the quality of each article we publish.