
95% of researchers rate our articles as excellent or good
Learn more about the work of our research integrity team to safeguard the quality of each article we publish.
Find out more
ORIGINAL RESEARCH article
Front. Phys. , 04 February 2022
Sec. Optics and Photonics
Volume 10 - 2022 | https://doi.org/10.3389/fphy.2022.822714
This article is part of the Research Topic Digital Holography: Techniques and Applications View all 16 articles
 Jieyu Wang1
 Xue Wang1,2*
 Zhao Dong1,2*Huaying Wang1,2*Qiaofen Zhu1,2Gaofu Men1,2Yafei Gao3Wenjian Wang1
We present a single-shot dual-wavelength common-path off-axis digital holographic microscopic (CO-DHM) imaging method based on two-dimensional grating diffraction. This method improves the utilization rate of the interference field under the limited photosensitive size of the camera, and further expands the original camera’s field of view (FOV). In addition, the mode of orthogonal carrier frequencies close to the diagonal direction can optimize the utilization of the camera’s spatial bandwidth. Compared with the traditional dual-wavelength CO-DHM using one-dimensional grating or prism beam splitting, this method effectively avoids the aliasing of high-frequency components of the +1-order spectrum of different wavelengths in the frequency domain. We provide quantitative phase imaging experiments for the full FOV of USAF resolution chart, onion epidermal cells and standard polystyrene beads. The results prove that the system can enlarge the interferometric FOV by nearly 74.0% without changing the imaging parameters, such as magnification and resolution, and can achieve high-precision quantitative phase imaging with only a single hologram.
Digital holographic microscopy (DHM) combines traditional optical microscopy imaging technology and holographic imaging technology to quantitatively obtain the amplitude and phase distribution of the original object light in the field of microscopic imaging [1–6]. Digital holographic microscopy has the characteristics of no contact, no chemical damage, and three-dimensional dynamic imaging during the entire sample observation process. It has been widely used in life, medicine, environment, materials, manufacturing, microelectronics, and other fields [7–12]. Common-path off-axis digital holographic microscopy (CO-DHM) system based on grating diffraction, as a typical and simple DHM, can realize high-stability non-contact real-time dynamic monitoring of samples [13, 14]. The system uses a classic optical microscope and is equipped with an additional diffraction module [15–18]. The object-reference light interference pattern is obtained on the camera plane by using grating beam splitting and the diffraction field spectrum filter technology, and then the complex amplitude distribution of the object light field is reconstructed by a computer [19]. In this way, three-dimensional quantitative information of the sample is obtained [20].
Recently, CO-DHM has been adapted to many types of light sources. Researchers have improved the resolution and spatial phase sensitivity of the CO-DHM system by using broadband light sources and structured light sources [21, 22]. In 2014, Moham Reza Jafarfard et al proposed a dual-wavelength diffraction phase microscopy system to accurately measure the thickness and refractive index of samples [23]. In 2015, N.A. Talaikova et al. measured the refractive index of red blood cells using the dual-wavelength transmitted light and reflected light simultaneous irradiation mode [24]. In 2020, Manoj Kumar et al developed a dual-wavelength co-channel off-axis system based on prism splitting to measure the phase and refractive index of samples at one time [25]. However, the Fourier orders of different wavelengths in the spectrogram of the above schemes are in the same direction, and strict system parameter optimization is required to avoid aliasing of the high frequency components of the +1-order spectrum. If the selected area is too small during frequency domain filtering, High frequency components will be lost. To solve this problem, MIT Poorya Hosseini and others developed a dual-wavelength interference microscope in 2018, which provides single-lens off-axis interferometry by encoding two spectral images at orthogonal spatial frequencies, but the optical path uses two 4f systems [26]. The structure of the system is more complicated [27]. Behnam Tayebi et al developed a dual-pinhole dual-wavelength CO-DHM in 2018, which maximized the optimization of two arbitrary wavelengths and crosstalk-free two-dimensional sampling schemes [28]. Compared with the previous CO-DHM, the field of view was expanded, but the system adopted two Gratings and two pinholes, it brings higher requirements to the stability of the system.
The size of the CO-DHM system’s field of view (FOV) is limited by two key factors: the size of the object reference light interference spot size and the camera’s photosensitive size. In recent years, several methods have been proposed in the field of digital holography to increase the recording FOV without changing the size of the camera sensor or loss of imaging resolution. One of them is the spatial phase scanning digital holographic imaging technology, which scans the sample on a reference light field, periodically obtains multiple frames of sample phase images, and finally uses algorithms to combine them into a large field of view holographic image. However, this type of method sacrifices the time resolution or the range of the dynamic area allowed in the recorded image [29]. The other is the off-axis interferometric field of view multiplexing technology, which optically multiplexes two off-axis interferometric fields of view collected from different areas on the sample to a single camera sensor, which can realize wide-area dynamic imaging without loss of spatial resolution. However, the currently reported digital holographic microscopy optical paths using this technology require complex device design and use more optical devices [30].
To solve the above problems, we propose a dual-wavelength CO-DHM based on a two-dimensional diffraction grating. This system can multiplex two FOVs into a single off-axis interferogram without using special optical elements. And it also can obtain wider FOV imaging without losing time resolution. The two FOVs share the dynamic measurement range of the camera and will not affect imaging parameters such as magnification and resolution. The interference area between the object light of two wavelengths and the reference beam is determined by the adjustable shearing distance that can be adjusted by controlling the axial position of the grating [31], and this distance determines the enlarged area of the field of view. Furthermore, the spatial bandwidth of the camera can be maximized by simply rotating the two-dimensional grating to form orthogonal carrier frequencies close to the diagonal direction. Quantitative phase imaging of samples can be achieved by placing the module as an additional unit on the exit port of the inverted microscope. To prove the high precision of the system, the large field of view quantitative phase imaging capability, the imaging results of the resolution plate, standard polystyrene beads and onion epidermal cell are provided.
Figure 1 shows the proposed experimental scheme of dual-wavelength CO-DHM based on two-dimensional gratings. The experiment uses a single longitudinal mode He-Ne laser (λR = 632.8 nm) and a semiconductor laser (λG = 532 nm) as the illumination source. The two beams of light are combined by the beam splitting prism (BS) and irradiate the sample (S) at the same time. Among them, the spatial filter (SF) plays a role in filtering out the high frequency noise of the laser and collimating and expanding the beam. The two-dimensional grating (G) is placed behind the image plane (IP) to generate different diffraction orders that carry sample information. The light beam is collimated by the tube lens (TL) into parallel light and incident on the grating. On this basis, a 4f imaging module is added to image the sample image to the camera plane. Then, for each wavelength component in the Fourier plane of the 4f system, the 0th order and +1 order diffracted lights are extracted in two mutually orthogonal directions using filters. The design of the filter (after rotating 45°) is shown in Figure 1. The strongest 0-order diffracted light passes through the pinhole on the spatial filter and becomes an ideal uniform spherical wave as the reference beam in interference. The weaker +1-order diffracted light passes through a larger spatial filter hole separately. The outgoing beam is used as the object light. To ensure better fringe contrast, an attenuator with a transmittance of 50% is placed behind the 0-level filter hole on the spectrum plane. Finally, the +1-order object beam with the complete information of the sample will interfere with the plane reference light on the imaging surface of the CCD sensor to generate two holograms which are captured and recorded by the CCD sensor at one time.
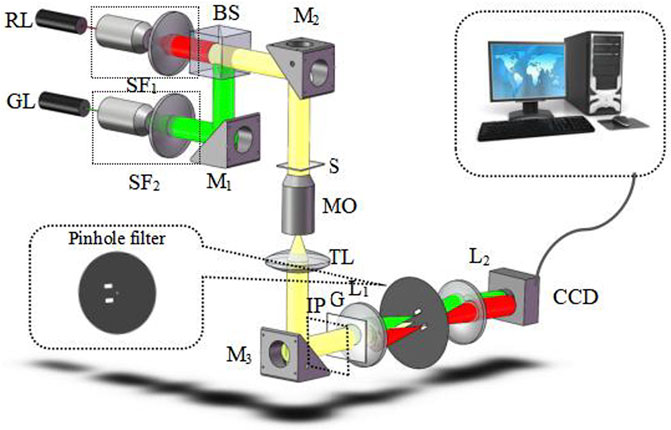
FIGURE 1. Schematic setup of dual-wavelength CO-DHM. S, sample; SF, spatial filters. RL, red laser; GL, green laser; M, mirrors; MO, microscopy objective; TL, tube lens; G, two-dimensional grating; L, lens.
Since the beams of two wavelengths have the same propagation mode in this module and are independent of each other, after the beam is filtered by the Fourier plane spectrum (as shown in Figure 2), only the 0-order and +1-order light in a single direction can pass. For simplicity, we consider the light field distribution of a single wavelength in a one-dimensional plane. The transmittance function of a single wavelength through a two-dimensional diffraction grating can be simplified as
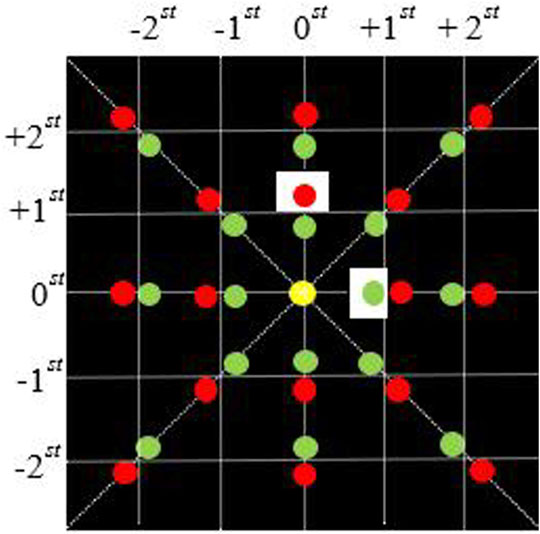
FIGURE 2. Fourier plane spectrum distribution of 4f system. The red and green dots respectively represent the focusing spots of the beams of different wavelengths on the Fourier plane of the 4f system; The white square represents the rectangular light-transmitting part of the filter.
Here,
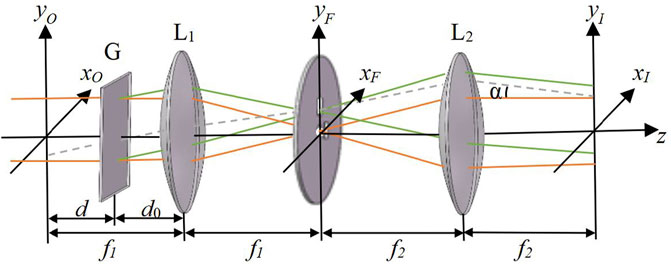
FIGURE 3. Schematic diagram of 4f system module. f1, f2, focal length of lens L1, L2; α, off-axis interference angle; d, distance between grating and image plane; d0, distance between lens and grating.
Among them, d is the distance between the grating and the image plane. A (xO,yO) is the complex amplitude of the sample image of the IP plane. After the diffraction grating, the complex amplitude of the light field in front of the first Fourier lens is expressed as
Substituting formula (1) and (2) into formula (3), it can be simplified to
Taking into account the Fourier transform properties of the lens, after the light field passes through the first lens of the 4f system, the distribution of the complex light field in front of the Fourier plane is
The transmittance function of lens L1 is expressed by Eq. 6. A filter is placed on the Fourier plane of the lens L1 to allow the +1-order light to pass through and further low-frequency filtering of the 0-order light, while other levels are blocked. Therefore, on the image plane, the +1-order object light that contains all the information of the original image and the 0-order reference light that only carries the DC content of the original image can be obtained [31]. Omitting the constant exponential coefficient, the complex amplitude distribution of the object light field on the Fourier plane is
Where F represents the Fourier transform of the function. Considering the properties of the Fourier transform of the lens, the distribution of the complex amplitude and light intensity (with the constant exponential coefficient omitted) of the image plane of a single wavelength are
where
As shown in Figure 4, the red and green circular areas respectively represent the light intensity distribution of the object light carrying all the sample information at the corresponding frequency of the camera plane, and the area inside the yellow circle represents the object reference light interference area. The shearing distance l is the distance between the center of the object light beam and the center of the reference light, and this distance determines the position of the interference area between the object light and the reference light in the image plane. It can be seen from Eq. 11 that the shearing distance can be adjusted by controlling the axial position of the grating. When the two-dimensional grating is located in the xOyO plane (d = 0), the clipping distance l is 0. And the red and green object images are overlapped on the camera plane in Figure 4, and the camera captures The field of view corresponding to the two wavelength beams is the same. When the distance d increases, one of the two fields of view produces a displacement of l1 in the x direction, and the other produces a displacement of l2 in the y direction. This configuration produces a multiplex of two linear, orthogonal, off-axis interference holograms, corresponding to two sample fields of view. Therefore, two object light fields can be digitally extracted from a single multi-channel hologram. The beams of each wavelength of the dual-wavelength CO-DHM are split by a two-dimensional grating to generate corresponding shearing fields in mutually orthogonal directions. The expansion rate of the field of view compared to the original camera field of view area can be expressed as
Where l1 and l2 are the shearing distances corresponding to the light fields of different frequencies. w is the lateral width of the photosensitive surface of the camera.
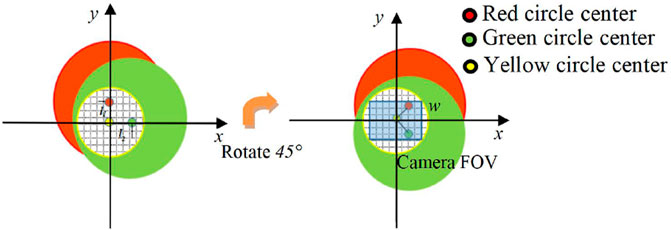
FIGURE 4. (A) is the plane light intensity distribution diagram of the camera, l1, l2, the shearing distance of red and green light; (B) is the plane light intensity distribution of the camera after the two-dimensional grating is rotated 45°, w is the lateral width of the photosensitive surface of the camera.
To design the filter diaphragm reasonably, the following three key factors must be considered: One is the distance between the pinhole and the center of the rectangular diaphragm, Through grating diffraction calculation, we can get
Where Δx and Δy are the physical distances between the 0-order and the +1-order spectrum of green and red light on the Fourier plane, and λG and λR are the wavelengths of green and red light. Second, the size of the rectangular aperture should be The design is large enough to ensure that the weaker +1-order diffracted beams pass through in the orthogonal direction individually and completely. The optimal side length dimension (L) of the rectangular diaphragm design can be expressed as:
In the numerical reconstruction, the Fourier transform is performed on the image digital hologram recorded by the CCD to obtain the separable +1-order spectrum [32]. The original light field distribution can be obtained by performing frequency domain filtering on the +1-order spectra at different positions of the spectrogram, and then undergoing inverse Fourier transform. And calculate the arctangent of the complex amplitude of the object light wave to obtain the wrapped phase [33]. Here, the filtering method used in this article is the classical spectral filtering method. And the least squares unwrapping algorithm based on transverse shearing (LS-LS) is used to demodulate the wrapping phase. Among them, the phase compensation method in which the background optical complex amplitude is divided by the original light field is used to eliminate the additional phase factor and other background noise of the reference light wavefront. The distortion compensation method is detailed in Ref. [34]. It is worth pointing out that the camera only needs to collect a hologram to obtain background information of two wavelengths.
In order to verify the large field of view quantitative imaging capability of the system, a dual-wavelength CO-DHM optical path based on a two-dimensional diffraction grating as shown in Figure 1 was constructed. The focal lengths of the lenses L1 and L2 used in the experiment are 6 cm, and all lenses are achromatic to minimize chromatic dispersion [35]. The actual horizontal magnification of the 4f module is M4f = 1. The object beam is collimated by the tube lens into parallel light and incident on the two-dimensional Ronchi grating (Λ = 8.6 µm). The two-dimensional grating is located behind the front focal plane of the first lens (d = 3 cm) to generate diagonally orthogonal carrier frequencies. The CMOS (Basler acA 2500-14 µm, sensor for-mat: 2,592 × 1944 pixels, pixel size of 2.2 µm) is located at the back focal plane of the 4f system to record the interference hologram. The camera’s dynamic range (typical value) is 60.6 dB. In our experiment, the microscope is equipped with a 40×/0.60NA objective lens. For the design of the filter, the diameter of the 0-order filter hole is 50 µm, and the two 1-order rectangular holes should be large enough to ensure that the +1-order light of this wavelength passes completely, and the +1-order light of another wavelength is filtered out.
Through the quantitative phase imaging of the 1951-USAF resolution chart (positive chart), the system’s ability to obtain two holograms at one time and expand the field of view is verified. Figure 5A shows two resolution plate holograms with different fields of view recorded by a CCD camera at the same time, and Figure 5B shows an enlarged view of the fringes orthogonal to each other by magnifying the part of the hologram in the red rectangular frame. Figure 5C shows the spatial Fourier transform image of the hologram. The ±1 order spectrum of two wavelengths (λ1 = 632.8 nm and λ2 = 532 nm) are separated and marked with corresponding color circles. And the wrapped phase is obtained by performing frequency domain filtering on the +1 spectrum at different positions of the spectrogram. Figure 5D show the reconstructed intensity map after red light frequency domain filtering. Figure 5E show the reconstructed intensity map of the green light. Finally, we get the final field of view size by stitching the pixels of the intensity map of two different resolution versions of the field of view, as shown in Figure 5F. Here, we selected the 1944 × 2,592 (camera full field of view) picture of the reconstructed resolution board illuminated by the green light source, and the (1,438 × 2,592) image size of the resolution board illuminated by the red light source. The image area (506 × 2,596) is the overlapping part of the two fields of view. From the geometric relationship, it can be calculated that the final field of view is 74.0% larger than that of the original camera.
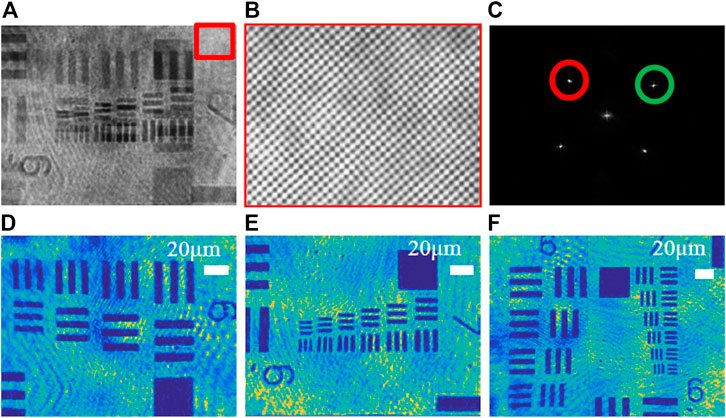
FIGURE 5. Phase imaging of the 1951-USAF resolution chart based on dual-wavelength CO-DHM. (A) The multiplexed off-axis interferogram recorded during the exposure of a single CCD camera; (B) Enlarged image of interference fringes; (C) Spatial Fourier transform of the hologram; (D) λ1 = 632.8 nm reconstructed intensity image. (E) λ2 = 532 nm reconstruction intensity image; (F) The final field of view after stitching the intensity image of the resolution chart of two different fields of view.
In addition, we verified the ability of this technology to quantitatively image large scale biological cells by imaging the epidermal cells of plant onion. Figure 6A shows the multiplexed off-axis interference hologram recorded during the exposure of a single CCD camera; Figure 6B shows the spatial Fourier transform of the hologram; Figures 6D,E show the reconstructed intensity map, phase map and height map of λ1 = 532 nm; Figures 6F,G show the reconstructed phase map and height map of λ2 = 632.8 nm; Here, the image stitching method based on SIFT feature detection is used to reconstruct the image [36]. Figures 6C,H6 are the intensity map and height map obtained after the two fields of view are stitched together. It is worth noting that it is unreasonable if the spliced picture is directly regarded as a complete single reconstructed image. This is manifested in two aspects: one is for the restored intensity image, because the light intensities of the two wavelengths are different. And the camera’s sensitivity to different monochromatic light results in the difference in the natural intensity of the samples recorded by the CCD in the two fields of view. The solution adopted in this work is: adjust the attenuator in the optical path to approximate the same light intensity and numerical adjustment of intensity map brightness; the second is shown on the height map, this method is effective when there is no sample at the stitching boundary. But for large-size biological samples, even if the inherent height of the sample is the same (the height calculation formula can refer to Ref. [37]), it still remains at the stitched boundary with a slight difference. Because the sample has a different dispersion, refractive index and absorption for a specific wavelength of laser light. Here is only to show that the mentioned method is effective for the final expansion of the imaging field of view.
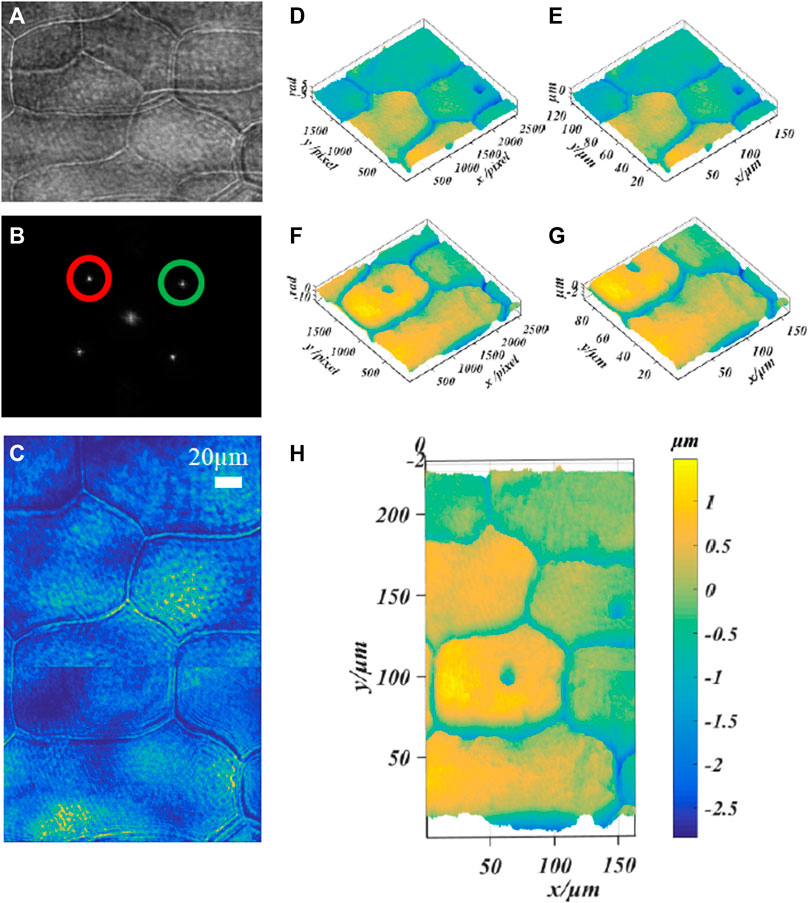
FIGURE 6. Phase imaging of onion epidermal cells based on dual-wavelength CO-DHM based on grating diffraction. (A) the multiplexed off-axis interferogram recorded during the exposure of a single CCD camera; (B) the spatial Fourier transform of the hologram; (D,E), λ1 = 532 nm reconstruction phase map and height map; (F,G) λ2 = 632.8 nm reconstruction phase map and height map. (C,H) Intensity map and height map obtained by splicing two fields of view.
Finally, we imaged standard polystyrene beads to verify the imaging accuracy of our system. The standard polystyrene microspheres have a diameter of (9.8 ± 0.2)μm and a refractive index of 1.59. Use a dropper to take a small number of microspheres and drop them on the glass slide. After the original ethanol solution has evaporated, use the refractive index matching solution to immerse the microspheres. Finally, put the standard sample into the stage and adjust the focus to make it image on the plane of the CCD camera. Figures 7A–D show the phase images of the microspheres with λ1 = 632.8 nm and λ2 = 532 nm, respectively. The red rectangular frame identifies the area as the overlapping area of different fields of view. Figures 7E,F respectively show the height images of the microspheres with λ1 = 632.8 nm and λ2 = 532 nm. The background noise of phase map and height map is caused by impurities in the medium, laser speckle and coherent parasitic fringe noise. Figure 8 shows the one-dimensional phase and height reproduction of the same bead corresponding to the white line in the overlapping area under different fields of view. From the highest point value in Figure 8B, the longitudinal diameter of the microspheres illuminated by the red light source is 9.85 µm; the longitudinal diameter of the microspheres illuminated by the green light source is 10.00 µm. The main source of the errors in the measurement of the two wavelengths is due to the slight difference in refractive index of the test sample at different frequencies [23]. Here, we assume that the refractive index of the sample at different frequencies is the same; the second is the error caused by manual selection of the center position of the microbead.
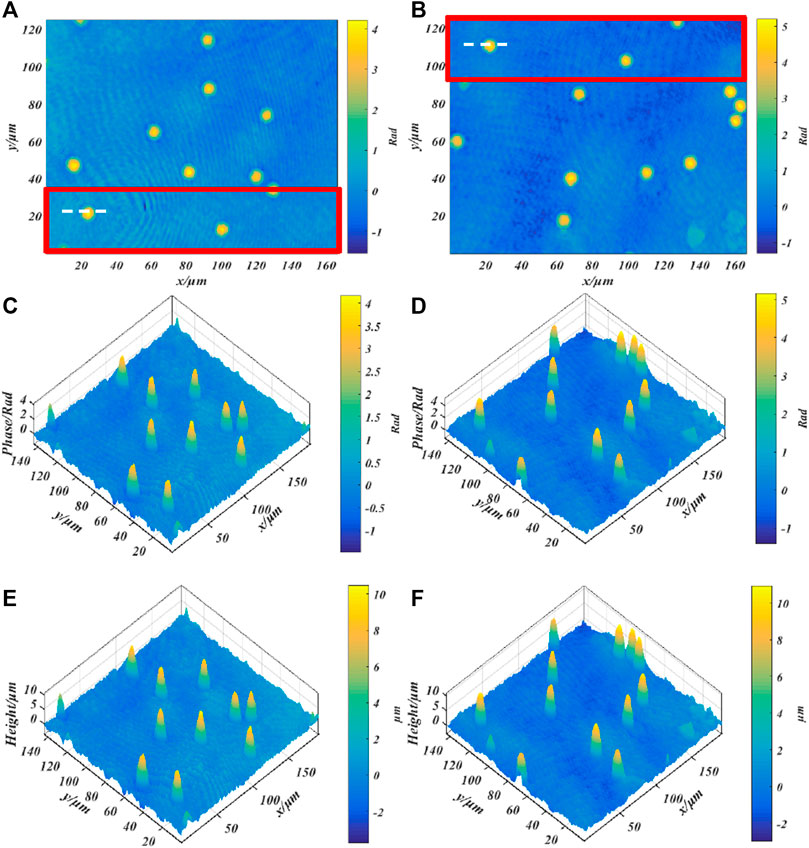
FIGURE 7. Quantitative phase imaging of standard polystyrene beads; (A,C) Phase diagram of beads with a wavelength of 632.8 nm; (B,D) Phase diagram of microbeads with a wavelength of 532 nm, (E,F) correspond to the height map.
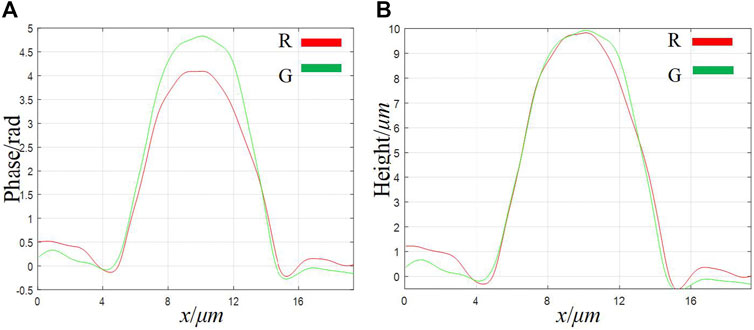
FIGURE 8. A cross-sectional image of a single bead taken from the overlapping area of different fields of view. (A) phase map; (B) height map.
In summary, we propose a two-wavelength CO-DHM system based on two-dimensional grating diffraction to improve the utilization of the interference field under the limited photosensitive size of the camera. This scheme can simultaneously perform two-wavelength and large field of view quantitative phase imaging. And compared with one-dimensional gratings and prisms as light-splitting elements, the use of two-dimensional gratings to split light to rotate 45° to form orthogonal carrier frequencies in diagonal directions can optimize the use of the spatial bandwidth product of the camera. Experimental results show that this technology can enlarge the common-path off-axis interference FOV by nearly 74.0% without changing the imaging parameters, such as magnification and resolution. It is worth pointing out that by optimizing the grating and 4f system lens parameters to the maximum, there is still room for improvement in this value to a certain extent.
At the same time, because the camera FOV and the acquisition frame rate are interchangeable, this technology can increase the camera’s ability to acquire the frame rate by using fewer pixels without reducing the original reconstructed FOV [38]. By providing this module with conventional inverted microscopy, a broader FOV or faster collection rate can be provided for a given camera, thereby achieving greater and fastmoving sample imaging.
Of course, this solution also has all the advantages of single-lens multi-wavelength CO-DHM. It brings higher stability to the system by adopting the common-channel structure and multi-wavelength multiplexing method. By selecting the overlap area of the FOV of different wavelengths, the thickness, refractive index and dispersion of the sample can be measured at the same time (as mentioned in Refs. [4, 23]). This technology opens up a new way for the integration of versatility, high stability, wide field of view three-dimensional biological quantitative imaging technology.
The raw data supporting the conclusion of this article will be made available by the authors, without undue reservation.
Conceptualization, HW, and JW; methodology, GM, QZ, ZD, and JW; software, QZ, and XW; validation, XW, YG; formal analysis, JW, and HW; investigation, JW, XW; resources, HW, and WW; data curation, HW; writing—original draft preparation, JW; writing—review and editing, XW, JW, and HW; visualization, JW, and WW; supervision, HW; project administration, HW; funding acquisition, HW. All authors have read and agreed to the published version of the manuscript.
This research was funded by National Natural Science Foundation of China, Grant number 62175059, Natural Science Foundation of Hebei Province of China, Grant number F2018402285 and Innovation Capability Improvement Plan of Hebei Province of China, Grant number 20540302D.
The authors declare that the research was conducted in the absence of any commercial or financial relationships that could be construed as a potential conflict of interest.
All claims expressed in this article are solely those of the authors and do not necessarily represent those of their affiliated organizations, or those of the publisher, the editors and the reviewers. Any product that may be evaluated in this article, or claim that may be made by its manufacturer, is not guaranteed or endorsed by the publisher.
The Supplementary Material for this article can be found online at: https://www.frontiersin.org/articles/10.3389/fphy.2022.822714/full#supplementary-material
1. Poon TC, Liu JP. Introduction to Modern Digital Holography with MATLAB. Cambridge: Cambridge University Press (2014).
2. Popescu G, Ikeda T, Dasari RR, Feld MS. Diffraction Phase Microscopy for Quantifying Cell Structure and Dynamics. Opt Lett (2006) 31:775–7. doi:10.1364/OL.31.000775
3. Li Y, Zhang S, Zhang J, Zhang Y, Liu D. Single-Shot Phase-Shifting Radial-Shearing Digital Holography with Fibonacci-Sieve Array Irrespective of Initial Phases. Appl Phys Lett (2021) 118:261101. doi:10.1063/5.0050681
4. Fu D, Choi W, Sung Y, Yaqoob Z, Dasari RR, Feld M. Quantitative Dispersion Microscopy. Biomed Opt Express (2010) 1:347–53. doi:10.1364/BOE.1.000347
5. Wu J, Liu K, Sui X, Cao L. High-Speed Computer-Generated Holography Using an Autoencoder-Based Deep Neural Network. Opt Lett (2021) 46:2908–11. doi:10.1364/OL.425485
6. Di J, Wu J, Wang K, Tang J, Li Y, Zhao J. Quantitative Phase Imaging Using Deep Learning-Based Holographic Microscope. Front Phys (2021) 9:113. doi:10.3389/fphy.2021.651313
7. Choi K, Yim J, Min S-W. Achromatic Phase Shifting Self-Interference Incoherent Digital Holography Using Linear Polarizer and Geometric Phase Lens. Opt Express (2018) 26:16212–25. doi:10.1364/OE.26.016212
8. Alemán-Castaneda , Luis A, Lorenzo M, Miguel AA. Shearing Interferometry via Geometric Phase. Optica (2019) 6:396–9. doi:10.1364/OPTICA.6.000396
9. Cacace T, Bianco V, Mandracchia B, Pagliarulo V, Oleandro E, Paturzo M, et al. Compact off-Axis Holographic Slide Microscope: Design Guidelines. Biomed Opt Express (2020) 11:2511–32. doi:10.1364/BOE.11.002511
10. Patel N, Trivedi V, Mahajan S, Chhaniwal V, Fournier C, Lee S, et al. Wavefront Division Digital Holographic Microscopy. Biomed Opt Express (2018) 9:2779–84. doi:10.1364/boe.9.002779
11. Agour M, Falldorf C, Bergmann RB. Spatial Multiplexing and Autofocus in Holographic Contouring for Inspection of Micro-parts. Opt Express (2018) 26:28576–88. doi:10.1364/OE.26.028576
12. Yang Y, Cheng Z-J, Zhao H-M, Yue Q-Y, Guo C-S. Quantitative Phase Imaging System with Slightly-Off-Axis Configuration and Suitable for Objects Both Larger and Smaller Than the Size of the Image Sensor. Opt Express (2018) 26:17199–208. doi:10.1364/OE.26.017199
13. Wen Y, Wang H, Anand A, Qu W, Cheng H, Dong Z, et al. .A Fast Autofocus Method Based on Virtual Differential Optical Path in Digital Holography: Theory and Applications. Opt Lasers Eng (2019) 121:133–42. doi:10.1016/j.optlaseng.2019.04.006
14. Das B, Yelleswarapu CS, Rao DVGLN. Parallel-Quadrature Phase-Shifting Digital Holographic Microscopy Using Polarization Beam Splitter. Opt Commun (2012) 285:4954–60. doi:10.1016/j.optcom.2012.07.101
15. Wang H, Dong Z, Wang X, Lou Y, Xi S. Phase Compensation in Digital Holographic Microscopy Using a Quantitative Evaluation Metric. Opt Commun (2019) 430:262–7. doi:10.1016/j.optcom.2018.08.061
16. Zheng C, Zhou R, Kuang C, Zhao G, Zhang Z, Liu X. Diffraction Phase Microscopy Realized with an Automatic Digital Pinhole. Opt Commun (2017) 404:5–10. doi:10.1016/j.optcom.2017.05.038
17. Shan M, Kandel ME, Majeed H, Nastasa V, Popescu G. White-Light Diffraction Phase Microscopy at Doubled Space-Bandwidth Product. Opt Express (2016) 24:29033–9. doi:10.1364/OE.24.029033
18. Baek Y, Lee K, Yoon J, Kim K, Park Y. White-Light Quantitative Phase Imaging Unit. Opt Express (2016) 24:9308–15. doi:10.1364/oe.24.009308
19. Bhaduri B, Edwards C, Pham H, Zhou R, Nguyen TH, Goddard LL, et al. Diffraction Phase Microscopy: Principles and Applications in Materials and Life Sciences. Adv Opt Photon (2014) 6:57–119. doi:10.1364/AOP.6.000057
20. Bhaduri B, Pham H, Mir M, Popescu G. Diffraction Phase Microscopy with white Light. Opt Lett (2012) 37:1094–6. doi:10.1364/OL.37.001094
21. Dubois F, Yourassowsky C. Full off-Axis Red-Green-Blue Digital Holographic Microscope with LED Illumination. Opt Lett (2012) 37:2190–2. doi:10.1364/OL.37.002190
22. Chowdhury S, Izatt J. Structured Illumination Diffraction Phase Microscopy for Broadband, Subdiffraction Resolution, Quantitative Phase Imaging. Opt Lett (2014) 39:1015–8. doi:10.1364/OL.39.001015
23. Jafarfard MR, Moon S, Tayebi B, Kim DY. Dual-Wavelength Diffraction Phase Microscopy for Simultaneous Measurement of Refractive index and Thickness. Opt Lett (2014) 39:2908–11. doi:10.1364/OL.39.002908
24. Talaikova NA, Kalyanov AL, Ryabukho VP. Diffraction Phase Microscopy with Transmission and Reflection Illumination for Refractive Index Measurements. Proc SPIE (2015) 9529:95291D–95296. doi:10.1117/12.2181946
25. Kumar M, Quan X, Awatsuji Y, Tamada Y, Matoba O. Single-Shot Common-Path off-Axis Dual-Wavelength Digital Holographic Microscopy. Appl Opt (2020) 59:7144–52. doi:10.1364/AO.395001
26. Hosseini P, Jin D, Yaqoob Z, So PTC. Single-Shot Dual-Wavelength Interferometric Microscopy. Methods (2018) 136:35–9. doi:10.1016/j.ymeth.2017.10.006
27. Min J, Yao B, Gao P, Guo R, Ma B, Zheng J, et al. Dual-Wavelength Slightly off-axis Digital Holographic Microscopy. Appl Opt (2012) 51:191–6. doi:10.1364/AO.51.000191
28. Tayebi B, Jeong Y, Han J-H. Dual-Wavelength Diffraction Phase Microscopy with 170 Times Larger Image Area. IEEE J Select Top Quan Electron. (2019) 25:1–6. doi:10.1109/JSTQE.2018.2863553
29. Kim MK. Wide Area Quantitative Phase Microscopy by Spatial Phase Scanning Digital Holography. Opt Lett (2020) 45(3):784–6. doi:10.1364/OL.385322
30. Frenklach I, Girshovitz P, Shaked NT. Off-Axis Interferometric Phase Microscopy with Tripled Imaging Area. Opt Lett (2014) 39(6):1525–8. doi:10.1364/OL.39.001525
31. Quan X, Matoba O, Awatsuji Y. Single-shot Incoherent Digital Holography Using a Dual-Focusing Lens with Diffraction Gratings. Opt Lett (2017) 42:383. doi:10.1364/OL.42.000383
32. Picazo-Bueno JÁ, Cojoc D, Iseppon F, Torre V, Micó V. Single-Shot, Dual-Mode, Water-Immersion Microscopy Platform for Biological Applications. Appl Opt (2018) 57:A242–A249. doi:10.1364/AO.57.00A242
33. Parshall D, Kim MK. Digital Holographic Microscopy with Dual-Wavelength Phase Unwrapping. Appl Opt (2006) 45:451–9. doi:10.1364/AO.45.000451
34. Pham HV, Edwards C, Goddard LL, Popescu G. Fast Phase Reconstruction in White Light Diffraction Phase Microscopy. Appl Opt (2013) 52(1):A97–101. doi:10.1364/AO.52.000A97
35. Jeon S, Cho J, Jin J-N., Park N-C, Park Y-P. Dual-Wavelength Digital Holography with a Single Low-Coherence Light Source. Opt Express (2016) 24:18408–16. doi:10.1364/OE.24.018408
36. Cheng DQ, Teng-Teng LI, Guo X, Bai CM, Hui XU. Improved Sift Neighborhood Voting Image Matching Algorithm. Comput Eng Des (2020) 41:162–168. doi:10.16208/j.issn1000-7024.2020.01.027
37. Liu B, Wang D, Zhu X, Wang H, Tian A, Liu W. Wavelength-Tuning Common-Path Digital Holographic Microscopy for Quantitative Phase Imaging of Functional Micro-Optics Components. Appl Sci (2020) 10:5602. doi:10.3390/app10165602
Keywords: digital holographic microscopy, dual-wavelength, twodimensional grating, common-path, off-axis
Citation: Wang J, Wang X, Dong Z, Wang H, Zhu Q, Men G, Gao Y and Wang W (2022) Single-Shot Common-Path Off-Axis Dual-Wavelength Digital Holographic Microscopy Based on Two-Dimensional Grating Diffraction. Front. Phys. 10:822714. doi: 10.3389/fphy.2022.822714
Received: 26 November 2021; Accepted: 10 January 2022;
Published: 04 February 2022.
Edited by:
Peng Gao, Xidian University, ChinaReviewed by:
Yaping Zhang, Kunming University of Science and Technology, ChinaCopyright © 2022 Wang, Wang, Dong, Wang, Zhu, Men, Gao and Wang. This is an open-access article distributed under the terms of the Creative Commons Attribution License (CC BY). The use, distribution or reproduction in other forums is permitted, provided the original author(s) and the copyright owner(s) are credited and that the original publication in this journal is cited, in accordance with accepted academic practice. No use, distribution or reproduction is permitted which does not comply with these terms.
*Correspondence: Xue Wang, eHVlLndhbmdAaGViZXUuZWR1LmNu; Zhao Dong, aGFuZGFuZG9uZ0AxNjMuY29t; Huaying Wang, cGJ4c3lpbmd6aUAxMjYuY29t
Disclaimer: All claims expressed in this article are solely those of the authors and do not necessarily represent those of their affiliated organizations, or those of the publisher, the editors and the reviewers. Any product that may be evaluated in this article or claim that may be made by its manufacturer is not guaranteed or endorsed by the publisher.
Research integrity at Frontiers
Learn more about the work of our research integrity team to safeguard the quality of each article we publish.