- 1Key Laboratory of Beam Technology of the Ministry of Education, College of Nuclear Science and Technology, Beijing Normal University, Beijing, China
- 2Beijing Radiation Center, Beijing, China
In order to draw a high-quality single-bounce capillary (SBC) to meet various applications, there is an increasing demand for detailed simulations of the SBC. In this study, a code based on the ray-tracing method was developed to simulate SBCs in detail for various X-ray sources to optimize their performances by considering factors such as attenuation of X-rays, coating, X-ray source characteristics (spot-size, distribution of energy, and intensity), surface shape errors, centerline errors, surface roughness, and absorption edges of X-rays. This code has monochrome and polychrome modes which were usually used to simulate the monoenergetic and polyenergetic performances of the SBC.
1 Introduction
The capillary X-ray optics works on total external reflection. When the grazing incidence angle of X-rays is less than the critical angle of total reflection
where
According to the number of capillaries, capillary X-ray optics is divided into poly-capillary and mono-capillary X-ray optics. The poly-capillary X-ray optics is drawn from tens of thousands to hundreds of thousands of hollow glass fibers, and each capillary points to the same focal spot, as shown in Figure 1A. Generally, the focal spot size is in the range of tens of microns to hundreds of microns, and the gain in power density can reach the order of 103 [1, 2]. The poly-capillary X-ray optics has been widely used in X-ray fluorescence (XRF) [3], X-ray diffraction (XRD) [4, 5], and X-ray absorption fine structure spectroscopy (XAFS) [6].

FIGURE 1. Sketches of capillary X-ray optics focusing X-rays. (A) is poly-capillary X-ray optics. (B), (C), and (D) are tapered, ellipsoidal, and parabolic capillaries, respectively.
The mono-capillary X-ray optics drawn by a hollow glass tube can be divided into the multi-bounce capillary (MBC) and single-bounce capillary (SBC) based on the number of total reflections of X-rays on its inner surface. The MBC is often made into tapered surface which is easier to manufacture than the SBC (e.g., parabolic and ellipsoidal capillaries), as shown in Figure 1B. However, the tapered surface capillary has smaller transmission efficiency due to the multiple reflections of X-rays on its inner wall. Compared with the tapered surface capillary, the parabolic and ellipsoidal capillaries can obtain a transmission efficiency larger than 95% by a single X-ray reflection [7], as shown in Figures 1C, D. In addition, the SBC has the advantages of long working distance and controllable divergence, and it is suitable for a larger variety of X-ray microbeam experiments such as X-ray crystallographic analysis [7], X-ray fluorescence imaging [8], and full-field transmission X-ray microscopy [9].
In practice, SBCs typically have centerline and surface shape errors. The centerline errors are the deviations of the actual centerline of the SBC from the theoretical centerline. Also, the surface shape errors are the deviations of the actual surface shape of the SBC from the theoretical surface shape. To draw a high-quality SBC to meet an application, the SBC should be designed specifically, and its various parameters, such as focal spot size, transmission efficiency, working distance, and divergence, should be optimized according to the special requirement of the application. There are some programs for simulating the SBC [10–12]; however, such programs cannot simulate the properties of an SBC with centerline and surface shape errors, and the attenuation of X-rays and X-ray source characteristics is not considered in their simulations. Therefore, a more detailed code should be designed to simulate the properties of an SBC.
In this study, a code based on the ray-tracing method was developed to simulate the SBC for various X-ray sources (e.g., synchrotron radiation source, laboratory source, and secondary X-ray source with focusing optical devices) by considering factors such as attenuation of X-rays, coating, X-ray source characteristics (spot-size, distribution of energy, and intensity), surface shape errors, centerline errors, surface roughness, and absorption edges of X-rays. To adapt to different applications, two working modes were designed. One was a monochrome mode which was usually used to simulate the mono-energetic performances of the SBC, and the other was a polychrome mode for simulating the polyenergetic performances by importing a primary spectrum of the X-ray source into the model.
2 X-ray Transmission Theory
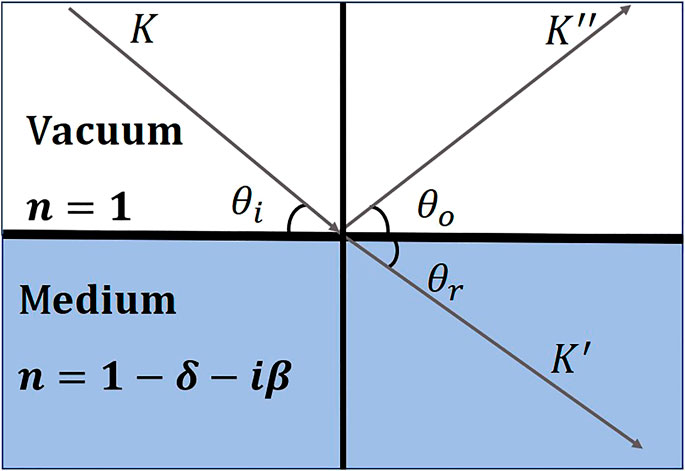
The smooth surface can totally reflect X-rays with a grazing incidence angle that is smaller than the critical angle
For X-rays, the index of refraction can be written as follows:
where the real part
Relations between the reflectivity R and the incident angle
where
The inner wall of the SBC is not completely smooth, and the corrected reflectivity
where
Because of the photoelectric interaction, Rayleigh scattering, Compton scattering, and pair production (energy≥1.02 MeV, this effect can be neglected for SBC simulation), the intensity of X-rays passing through the air attenuates. When an X-ray beam with intensity
where
3 Simulation Model
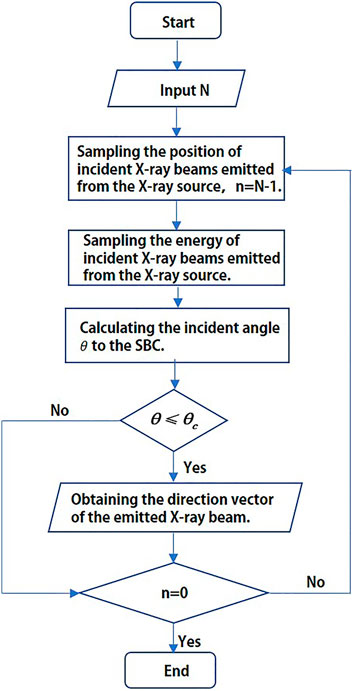
The code is built using MATLAB software. The simulation process is shown in Figure 3. First, the number N of X-ray beams emitted to the SBC was set. Then, the position coordinates, direction vectors, and the energy of the incident X-rays could be sampled. Finally, a series of ray-tracing processes were carried out. Since the ray-tracing method is a commonly used X-ray optical simulation method, it will not be repeated. The detailed description is given in reference [10].
This simulation model has two types of X-ray simulation sources: point and planar X-ray sources (Figure 4). The planar X-ray source is more in accordance with the actual X-ray source than the point X-ray source. Therefore, elliptical and rectangular planar X-ray sources were provided to meet different simulation requirements. The model can utilize both uniform and Gaussian X-ray intensity distributions.
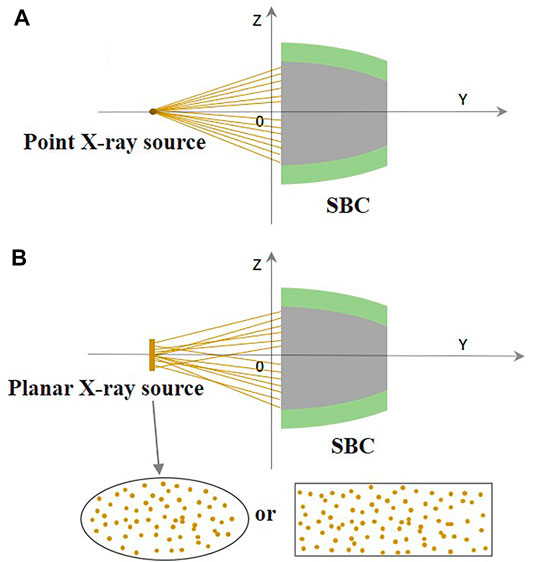
FIGURE 4. Schematic diagram of X-rays incident on the SBC. (A) X-rays from the point source are incident on the SBC. (B) X-rays from the planar source are incident on the SBC.
This simulation model has two modes: monochromatic and polychromatic. In the monochromatic mode, the mono-energetic performances of the SBC were simulated. Compared with the monochromatic mode, the primary spectrum of the X-ray source could be imported into the model to simulate the X-ray transmission in the polychromatic mode. In order to obtain the reflected energy spectrum, the primary spectrum was converted into a probability density distribution of energy E, as shown in Figure 5. The distribution law of the discrete random variable E can be given below:
where
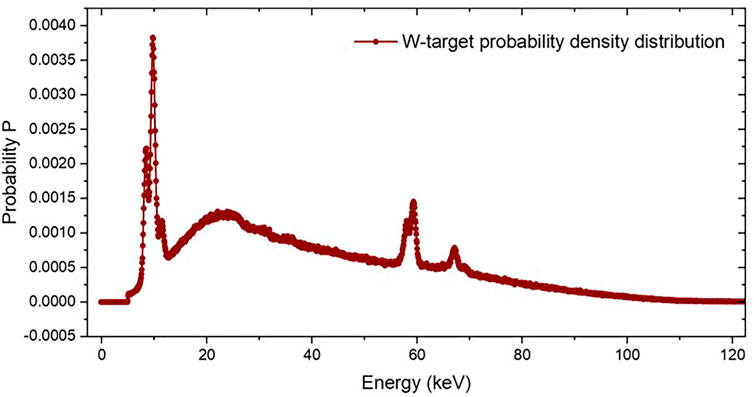
FIGURE 5. Probability density distribution of the X-ray source. Probability density distribution converted from the primary spectrum of the X-ray source.
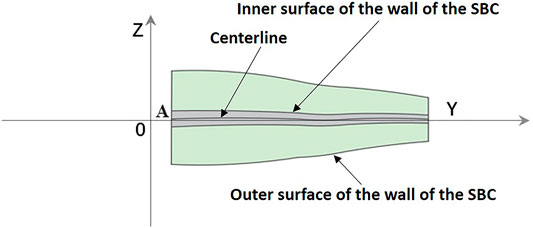
In practice, the centerline error is an important factor affecting the simulation results of the SBC. The ideal centerline of the SBC is a straight line along the y-axis; however, the actual centerline is a three-dimensional space curve, as shown in Figure 6. We assume that
where a was the semi-axis of the ideal ellipsoid in the x- and z-axis directions.
Surface shape errors can be given by
where b is the semi-axis of the ideal ellipsoid in the y-axis direction.
The model of the parabolic capillary with centerline and surface shape errors is built as follows:
where
4 Simulation
To verify the validity of the code, SBCs for three different X-ray sources were simulated by using polychromatic and monochromatic modes. We studied such parameters of the SBCs, that is, transmission efficiency, focal spot size, and divergence. The transmission efficiency
where
The parameters of the simulation X-ray sources are presented in Table 1. Sources S1 and S2 are synchrotron X-ray sources with focusing optical devices, and S3 is a W-target laboratory X-ray source.
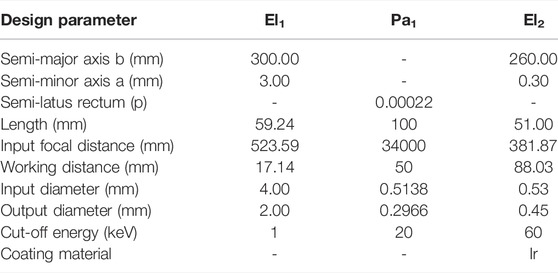
The design parameters of SBCs are shown in Table 2. The El1 is an ellipsoid capillary used for the synchrotron radiation soft X-ray source S1, and Pa1 is a parabolic capillary for the synchrotron radiation hard X-ray source S2 with a quasi-parallel beam. The laboratory X-ray source has relatively less beam flux than synchrotron radiation sources. The coated SBC has a large solid angle for receiving incident X-rays than the uncoated SBC, which improves the beam flux at the focal spot. El2 is an Ir-coated ellipsoidal capillary for the W-target laboratory X-ray source S3, with an energy range of 5–120 keV.
5 Results and Discussion
The simulated far-field image of the ellipsoid capillary El1 is presented in Figure 7. The distortion of the focusing ring is related to the centerline and the surface shape errors. If the focusing ring of the SBC has larger distortion, the SBC is of low quality and its parameters (transmission efficiency, focal spot size, and divergence) will have a large deviation from the theoretical design parameters.
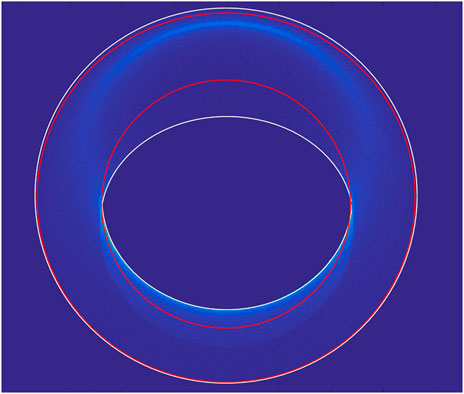
FIGURE 7. Simulated far-field image of the ellipsoid capillary El1. The two red circles represent the inner and outer boundaries of the ideal focusing ring. The two white irregular circles represent the inner and outer boundaries of the ideal focusing ring with the centerline and the surface shape errors.
The divergence angle and focal spot size of SBCs are shown in Table 3. The focal spot size was obtained by fitting the simulated focal spot data with a Gaussian function, and it is the full width at half maximum (FHWM) of the Gaussian fitting function. The synchrotron radiation hard X-ray source S2 has high collimation properties so that the focal spot size of the parabolic capillary Pa1 is smaller than that of the other two SBCs. Due to the large critical total reflection angle
Figure 8 shows the evolution of the focal spot size with the distance to the focal spot. When the incident X-ray energy is less than the cut-off energy, the focal spot characteristics are energy-independent [15]. Therefore, it was only necessary to study the focal spot characteristics of a certain energy. As shown in Figure 8A, the X-ray beams exited from the ellipsoid capillary El1 were first focused to a minimum focal spot size, and then they were rapidly defocused so that the ellipsoid capillary El1 had a shorter focal depth. The non-strictly parallel incident X-rays resulted in an asymmetry in a focal spot size of the parabolic capillary Pa1 between 0.0 and 1.0 mm and 0.0 and 1.0 mm, as shown in Figure 8B.
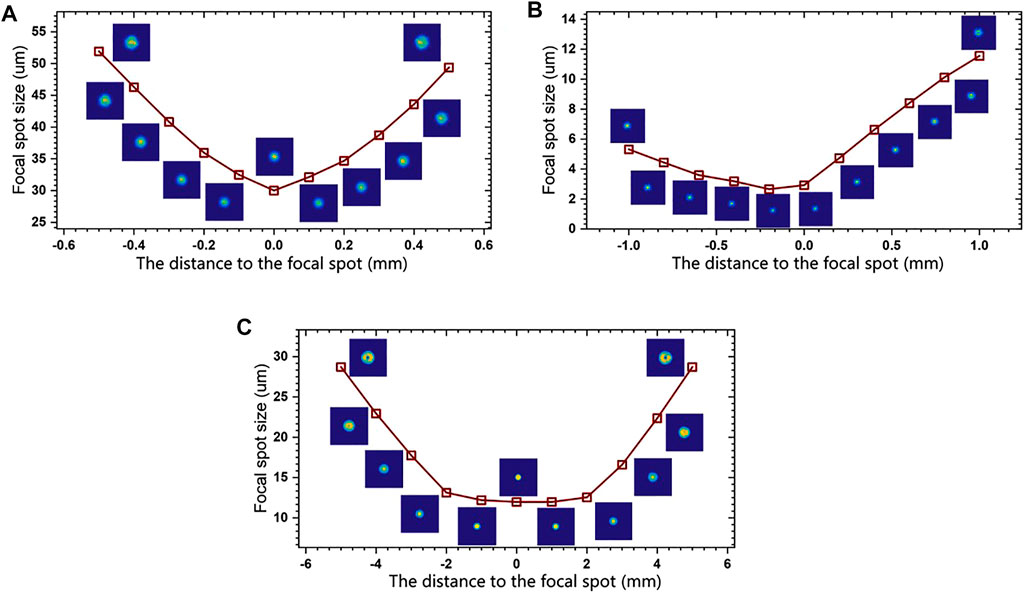
FIGURE 8. Evolution of the focal spot size with the distance to the focal spot. (A) and (C) are the ellipsoid capillaries El1 and El2, respectively. (B) is the parabolic capillary Pa1.
Figure 9 shows the energy dependence of the transmission efficiency for the ellipsoid capillary El1 and parabolic capillary Pa1. Since the SBC is usually made of borosilicate glass with a large amount of oxygen, X-rays at the absorption edge of oxygen are strongly absorbed, which can lead to lower transmission efficiency of the ellipsoid capillary El1 at an energy of 0.543 keV, as shown in Figure 9A. The transmission efficiency of the parabolic capillary Pa1 was greater than 95% in the energy range of 5–20 keV, as shown in Figure 9B. Therefore, it is necessary to consider the absorption edge effect in the simulation of the SBC for soft X-rays.
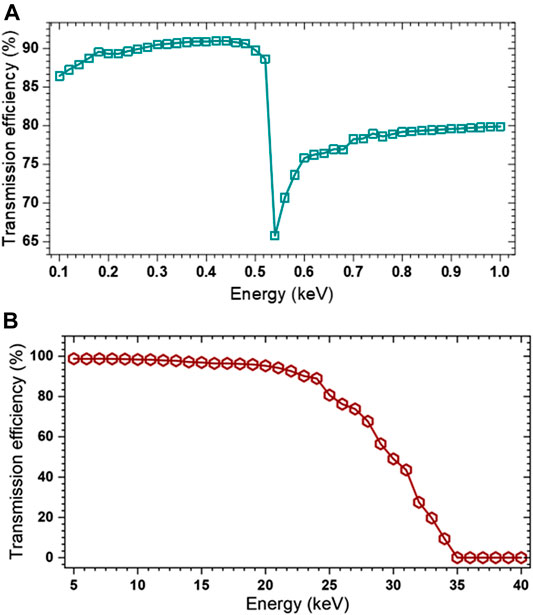
FIGURE 9. Energy dependence of the transmission efficiency. (A) and (B) are the transmission efficiency curves of the ellipsoid capillary El1 and parabolic capillary Pa1, respectively.
Figure 10 shows normalized spectrums of the reflected X-rays of the ellipsoid capillary El2. We compared the polyenergetic performances of the Ir-coated ellipsoid capillary and uncoated ones for the W-target laboratory X-ray source S3. The transmission efficiency of the uncoated ellipsoid capillary El2 rapidly decreased to zero at the energy of 20 keV. The critical angle of total reflection
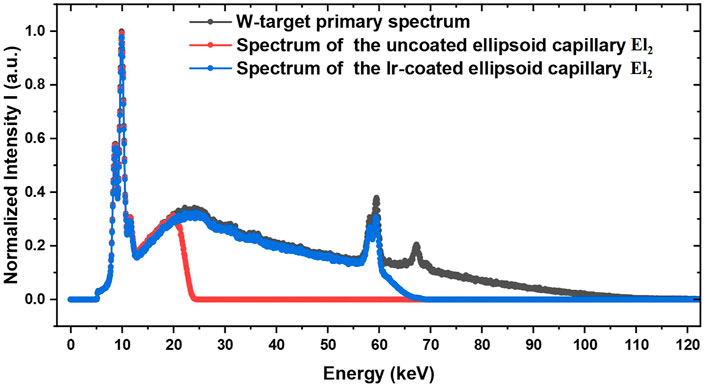
FIGURE 10. Normalized spectrums of the reflected X-rays of the ellipsoid capillary El2. The gray curve is the W-target primary normalized spectrum. The red and blue curves are the normalized reflected energy spectrums of the uncoated and Ir-coated ellipsoid capillaries, respectively.
6 Conclusion
To meet the rapid development of the SBC, a code for various types of X-ray sources was proposed to optimize their performance by considering such factors (e.g., attenuation of X-rays, roughness, coating, X-ray source characteristics, surface shape error, centerline error, surface roughness, and absorption edges of X-ray). Also, we have given two different modes: monochrome and polychrome modes. The monochromatic mode is usually used for the simulation of the SBC of the synchrotron radiation source. For the polychrome mode, the primary spectrum of the practical X-ray source can be imported into the program to simulate the SBC parameters, which is more in accordance with reality. In addition, the reflected energy spectrum can be obtained in the polychromatic mode, which can help scientists design the SBC that is most suitable for their application.
Although only the ellipsoid and parabolic capillary models are established in Sec.3, they can be easily extended to other types of capillaries, such as hyperbolic, double parabolic, and Walter-1. Relevant investigations on these topics will be carried out in the near future.
Data Availability Statement
The original contributions presented in the study are included in the article/Supplementary Material; further inquiries can be directed to the corresponding authors.
Author Contributions
SS: simulation, methodology, and writing. HL: investigation. XZ: investigation. TY: investigation. LH: investigation. XS: supervision. ZL: supervision. TS: methodology and supervision.
Funding
This work was supported by the National Natural Science Foundation of China (Grant Nos 11875087 and 12105220), the Chinese National Key Research and Development Plan (No. 2018YFF0109100), the Chinese Academy of Sciences Key Technology Research and Development Team (No. GJJSTD20170005), and the Beijing Academy of Science and Technology (No. BGS202106).
Conflict of Interest
The authors declare that the research was conducted in the absence of any commercial or financial relationships that could be construed as a potential conflict of interest.
Publisher’s Note
All claims expressed in this article are solely those of the authors and do not necessarily represent those of their affiliated organizations, or those of the publisher, the editors, and the reviewers. Any product that may be evaluated in this article, or claim that may be made by its manufacturer, is not guaranteed or endorsed by the publisher.
References
1. Guilherme A, Buzanich G, Carvalho ML. Focusing Systems for the Generation of X-ray Micro Beam: An Overview. Spectrochimica Acta B: At Spectrosc (2012) 77:1–8. doi:10.1016/j.sab.2012.07.021
2. MacDonald CA. Focusing Polycapillary Optics and Their Applications. X-ray Opt Instrumentation (2010) 2010:17. doi:10.1155/2010/867049
3. Peng S, Liu Z, Sun T, Ma Y, Ding X. Spatially Resolved In Situ Measurements of the Ion Distribution Near the Surface of Electrode in a Steady-State Diffusion in an Electrolytic Tank with Confocal Micro X-ray Fluorescence. Anal Chem (2014) 86:362–6. doi:10.1021/ac403188k
4. Sun T, Liu H, Liu Z, Peng S, Ma Y, Sun W, et al. Application of Confocal Technology Based on Polycapillary X-ray Optics in Three-Dimensional Diffraction Scanning Analysis. Nucl Instr Methods Phys Res Section B: Beam Interactions Mater Atoms (2014) 323:25–9. doi:10.1016/j.nimb.2014.01.013
5. Yamanashi M, Tsuji K. Development of Full-Field XRD (FFXRD) Imaging Method Realized in the Laboratory Using a Straight Polycapillary and In Situ Observation of the Oxidation Process of Cu by Heat Treatment. E-j Surf Sci Nanotec (2020) 18:1–7. doi:10.1380/ejssnt.2020.1
6. Sun T, Liu Z, Ding X. Characterization of a Polycapillary Focusing X-ray Lens for Application in Spatially Resolved EXAFS Experiments. Chem Phys Lett (2007) 439:412–4. doi:10.1016/j.cplett.2007.03.105
7. Bilderback DH, Huang R. X-ray Tests of Microfocusing Mono-Capillary Optic for Protein Crystallography. Nucl Instr Methods Phys Res Section A: Acc Spectrometers, Detectors Associated Equipment (2001) 467-468:970–3. doi:10.1016/s0168-9002(01)00543-5
8. Woll AR, Mass J, Bisulca C, Huang R, Bilderback DH, Gruner S, et al. Development of Confocal X-ray Fluorescence (XRF) Microscopy at the Cornell High Energy Synchrotron Source. Appl Phys A (2006) 83:235–8. doi:10.1007/s00339-006-3513-4
9. Zeng X, Duewer F, Feser M, Huang C, Lyon A, Tkachuk A, et al. Ellipsoidal and Parabolic Glass Capillaries as Condensers for X-ray Microscopes. Appl Opt (2008) 47:2376–81. doi:10.1364/ao.47.002376
10. Lin X, Liu A, Li Y, Wu P. A MATLAB Programming for Simulation of X-ray Capillaries. Appl Math Comput (2006) 172:188–97. doi:10.1016/j.amc.2005.01.150
11. Liu A. Simulation of X-ray Propagation in a Straight Capillary. Mathematics Comput Simulation (2004) 65:251–6. doi:10.1016/j.matcom.2004.01.001
12. Liu A, Lin Y. Simulation of X-ray Transmission in Capillaries with Different Profiles. Math Comput Simulation (2004) 66:577–84. doi:10.1016/j.matcom.2004.05.001
13. Takano A, Maehata K, Iyomoto N, Hara T, Mitsuda K, Yamasaki N, et al. Simulation Model of Transmitted X-Rays in Polycapillary Optics for TES Microcalorimeter EDS System on Scanning Transmission Electron Microscope. IEEE Trans Nucl Sci (2018) 65:758–65. doi:10.1109/tns.2017.2786703
14. Zymierska D. Determination of Surface Roughness Bu Grazing Incidence X-ray Reflectivity. Acta Phys Pol A (1996) 89:347–52. doi:10.12693/aphyspola.89.347
Keywords: mono-capillary X-ray optics, single-bounce capillary, simulation, X-ray, mono-capillary
Citation: Shao S, Li H, Yuan T, Zhang X, Hua L, Sun X, Liu Z and Sun T (2022) Detailed Simulation of Single-Bounce Capillaries for Various X-Ray Sources. Front. Phys. 10:816981. doi: 10.3389/fphy.2022.816981
Received: 17 November 2021; Accepted: 22 April 2022;
Published: 08 June 2022.
Edited by:
Ming Li, Institute of High Energy Physics (CAS), ChinaReviewed by:
P. S. Athiray, University of Alabama in Huntsville, United StatesManish Sharma, Pacific Northwest National Laboratory (DOE), United States
Copyright © 2022 Shao, Li, Yuan, Zhang, Hua, Sun, Liu and Sun. This is an open-access article distributed under the terms of the Creative Commons Attribution License (CC BY). The use, distribution or reproduction in other forums is permitted, provided the original author(s) and the copyright owner(s) are credited and that the original publication in this journal is cited, in accordance with accepted academic practice. No use, distribution or reproduction is permitted which does not comply with these terms.
*Correspondence: Tianxi Sun, c3R4QGJudS5lZHUuY24=
 Shangkun Shao
 Huiquan Li1,2