 Zhi-feng Deng
 Sheng-bao Zhan*
- Institute of Electronic Engineering and Intelligent Manufacturing, Anqing Normal University, Anqing, China
For spectral beam combining, an experimental system of dynamic beam quality caused by the thermal deformation of a grating has been designed and established. According to the theoretical model established, the distribution of the temperature field, as well as the thermal deformation of the grating, has been analyzed. Further, the combined beam quality and the intensity distribution have been numerically calculated in detail. The results show that the maximum temperature and the grating thermal deformation increase with the extension of irradiation time, resulting in side lobes appearing in the intensity distribution. In the experiment, the measured combined beam quality factor Mx2 was 1.29 without the thermal deformation. When the grating was heated by pump lasers at different times, Mx2 can arrive at 1.34, 1.37, and 1.41, respectively. The results reveal that the combined beam quality increases with the increase in irradiation time and changes rapidly at the beginning of heating, consistent with the theoretical analysis. The discussion and analysis of the dynamic beam quality are potentially valuable for reducing the influence of thermal deformation on the beam quality.
1 Introduction
Spectral beam combining (SBC) technology is a well-established method for high-radiance lasers, which has a broad application prospect in optical sensing, laser medical treatment, and spectral analysis [1–8]. The beam quality factor is one of the key technical indexes to evaluate the beam quality in the SBC system. However, it can be influenced by many factors, such as the spectral line width, the disturbance of the laser array, and the dispersion characteristics of the grating [9–12]. As the powers of the laser array are increased, the grating thermal deformation, which induces degeneration of the combined beam quality, becomes more significant [13–15]. Zhou et al. reported the modulation of combined beam characteristics by volume Bragg gratings with thermal deformation. The transmitted and the diffracted beams experience wave-front aberrations with different degrees, thus leading to distinct beam deterioration [16]. Yang et al. presented the influence of multilayer dielectric grating thermal deformation on the SBC system and the beam quality of the combined beam degraded with increasing incident laser-beam power density [17]. Wang et al. investigated the grating deformation under different laser heating times [18]. However, to our best knowledge, the correspondence between irradiation time and the dynamic change of the beam quality has not been found, which is necessary to further understand the dynamic change of beam quality so as to provide a method to reduce thermal deformation and improve the quality of the combined beam.
Aiming at the above situation, the temperature distribution, as well as the thermal deformation of a blazed grating, was analyzed using the finite element method, and the combined beam M2 after grating deformation was calculated using the beam propagation model of the SBC system. Further, the SBC experimental system for measuring dynamic beam quality was designed and established. The results show that beam quality increases with the increase in irradiation time, which changes rapidly at the beginning of heating.
2 Theoretical Models
2.1 The Process of Grating Thermal Deformation
The schematic illustration of the SBC system is shown in Figure 1. The grating is a key element in the system, which can combine multiple laser beams of different wavelengths into one beam. When the high-power laser irradiates the grating, the grating temperature will increase, leading to grating thermal distortion.
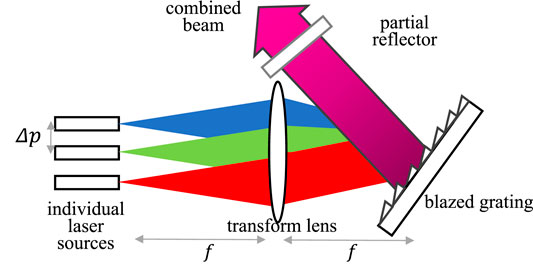
FIGURE 1. Schematic of the spectral beam combining.
For the blazed grating irradiated by laser array, the temperature distribution and the thermal deformation are mainly affected by the spot size and the intensity distribution of the laser field. Assuming that the incident laser is a Gaussian distribution, the different grooves will have different heat distributions, as shown in Figure 2. S1 is the front surface covered with a film layer, S2 is the backlit surface, and S3 is the side surface. The heat flux q (x, y, t) flowing into S1 is the laser power density absorbed by the film layer, which can be expressed as q (x, y, t) = AtI(x, y), where A represents the absorption coefficient of the film,
where T is the temperature in the location (x, y, z) at time t, k is the coefficient of heat conduction of grating, ρ is the density of grating material, c is the specific heat.
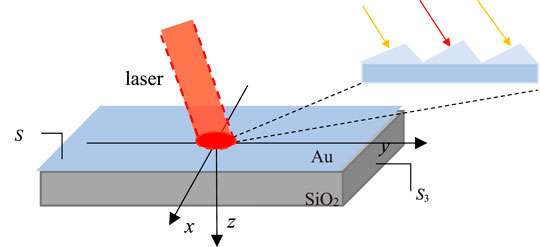
FIGURE 2. Schematic diagram of the irradiated blazed grating.
Besides the heat absorbed in the grating surface, there also exists convection to exchange heat. Therefore, the boundary condition can be written as
where h denotes convective heat transfer coefficient, T0 is the ambient temperature, and T1 is the surface temperature.
After the grating surface temperature rises, the grating begins thermal expansion, including the relief structure and substrate, as shown in Figure 3, where Δτ1(x) represents the deformation of the relief structure in different positions and Δτ2(x) represents the deformation of the substrate in different positions. As the laser power is absorbed by the grating, the groove angle, incident angle, and incident plane will change correspondingly, resulting in the change of the characteristics of the combined beam.
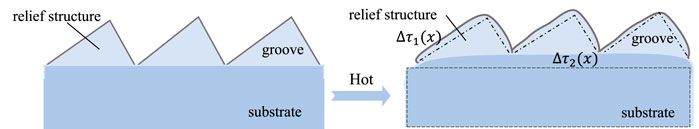
FIGURE 3. Schematic illustration of the blazed grating before and after thermal deformation.
2.2 Propagation Model of SBC Systems With Thermal Deformation
The phase change caused by the grating deformation is represented by the optical path difference, including optical path differences within or between grooves, as shown in Figure 4 and Figure 5, where α and β represent the incident angle and diffraction angle before thermal deformation, respectively, d denotes the grating period, a denotes the groove width, and φ is the angle of the groove before deformation. The x1-axis on the observation plane is perpendicular to the z1-axis. Ng and Ng′ represent the normal of the grating plane before and after the thermal deformation, respectively. Nc and Nc′ represent the normal of the groove plane before and after the thermal deformation, respectively.
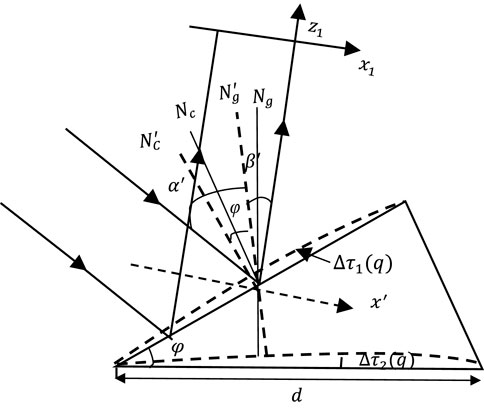
FIGURE 4. Schematic diagram of optical path difference in the groove.
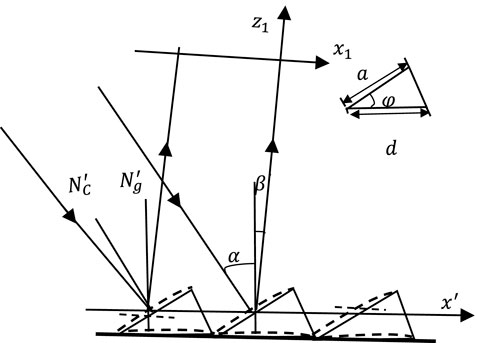
FIGURE 5. Schematic diagram of optical path difference between grooves.
The incident angle and diffraction angle of each individual element after thermal deformation can be written as
where
Because Δτ1(q) and Δτ2(q) are far less than
To simplify the calculation, assume that each groove has a virtual groove parallel to the x-axis and the center coincides with the center of the actual groove. By the virtual groove, the optical path difference of the nth groove relative to the origin after thermal deformation can be expressed with Δ1 (the optical path difference in grooves) and Δ2 (the optical path difference between the grooves) [20]:
The model of an individual beam propagating through the transform lens is given in Figure 6. The z2-axis is the main optical axis of the lens, and the x2-axis lies on the focal plane of the lens in object space. For each individual beam with a waist width of w0, the field distribution on the incident plane of the grating can be expressed as a function of grating groove number n [21]:
where kq = 2π/λq and f is the focal length of the transform lens. It is worth noting that the quartic-aberration produced by the transform lens is ignored.
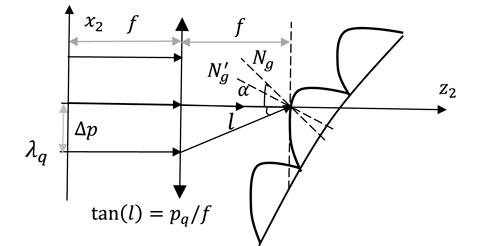
FIGURE 6. The model of an individual beam passing through a transform lens.
Additionally, the field distribution on the observation plane can be regarded as the superposition of all the diffraction fields of the virtual groove. According to the diffraction integral method [22], the field distribution after the deformation of the jt h individual beam on the observation plane can be expressed as
where Δ1+Δ2 represents the phase factor induced by the deformed blazed grating.
For the incoherent superposition, the field distribution of the combined beam can be written as
By utilizing the definition of the second-order intensity moments, after fitting the curve of the beamwidth D of the combined beam versus the propagation distance z1, the beam quality M2-factor on the x-axis can be calculated approximately by [23]
where ω means the waist width and θ means the divergence angle.
3 Simulation Results and Discussion
3.1 Parameters of Simulation
The parameters used in the simulation are divided into two parts, related to the thermal deformation of the grating and the quality of the combined beam. For the thermal deformation of the grating, the related parameters are as follows: the grating is with a side length of 5 cm, the coating thickness is 0.1 µm, the absorption coefficient of the film is 10 ppm [24], the convective heat transfer coefficient h is 5 W/(m2·K), and the ambient temperature is 20°C. The spot radius r of the irradiated grating surface is 10 mm, and the power density is 200 W/cm2. The grating with a substrate material is mainly composed of SiO2, and the relief structure made of Al is selected for thermal deformation analysis. The material constants are shown in Table 1 and Table 2, respectively [24].

TABLE 1. Material constants of SiO2.

TABLE 2. Material constants of Al.
For the quality of the combined beam, the related parameters are as follows: the line density is 1,200/mm, the groove angle φ = 14.8°, the interval between two adjacent emitters′ center Δp = 300 μm, the beam waist width of an individual laser beam ω0 = 100 μm, the focal length of the transform lens f = 10 cm, the incidence angle of the center beam α = 38°, the wavelengths (λq) of laser elements are arranged by λq = λ0+2q, q =
3.2 Dynamics of Grating Thermal Deformation
In order to solve Eq. 1 and Eq. 2, the finite element method is adopted. For different irradiation times of 10, 30, and 60 s, the temperature distribution on the grating surface is shown in Figures 7A,B,C, where the color bar from blue to red represents the Kelvin temperature from 293 to 308 K, which corresponds to 20°C and 35°C. It can be seen from Figure 7A that the temperature in the region with higher power density is higher than that in the region with lower power density, and the temperature in the region with higher power density is up to 31.3°C. With the increase in irradiation time, the temperature away from the irradiation area also increases gradually, and the maximum temperature in the central area is 33.6°C, as shown in Figure 7B. The temperature distribution after being irradiated for 60 s is shown in Figure 7C, which corresponds to the maximum temperature of 35°C. It can be demonstrated that the range of temperature diffusion is further enlarged, resulting in a larger deformation area on the grating surface. The temperature gradually increases from the edge to the center of the surface because of the Gaussian distribution of the incident laser.
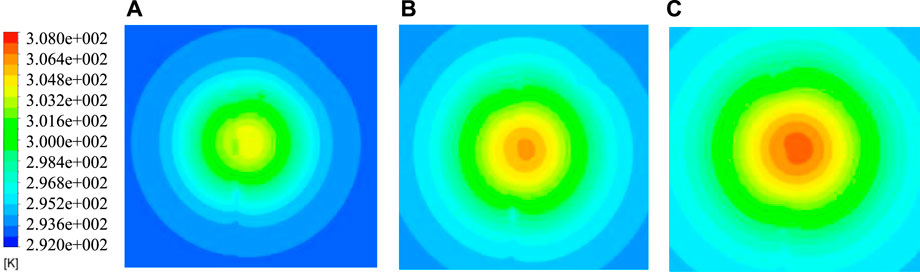
FIGURE 7. The temperature distribution of grating surface at different irradiation times: (A) 10, (B) 30, and (C) 60 s.
The thermal deformation of the substrate caused by a temperature change at the times of 10, 30, and 60 s is shown in Figures 8A,B,C, indicating that the maximum deformation value is 34.1, 48.6, and 62 nm. The results demonstrate that the thermal deformation increases with the irradiation time. In addition, the thermal deformation of the grating may increase with increasing temperature compared with Figure 7, and the deformation gradually decreases from the center to the edge of the surface.
FIGURE 8. Deformation diagram of the substrate at different irradiation times: (A) 10, (B) 30, and (C) 60 s.
The thermal deformation of the relief structure is similar to that of the substrate, as shown in Figure 9. It is worth noting that the deformation of the relief structure ignores the differences within the grooves to simplify calculations. The deformation of the substrate is greater than that of the relief structure at the same irradiation time due to the difference in the material constants. The largest thermal deformation of the substrate is 33.7, 46.5, and 59 nm at irradiation times of 10, 30, and 60 s.
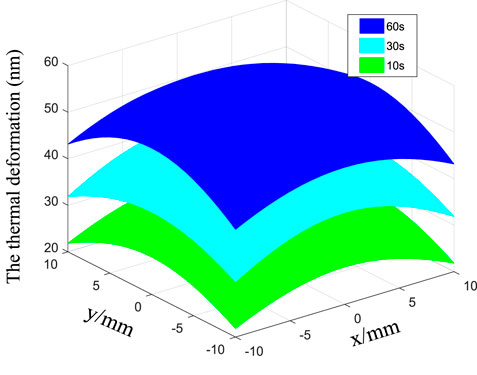
FIGURE 9. Influence of different irradiation times on the thermal deformation of the relief structure.
Figure 10 gives the change of the highest temperature rise with the irradiation time at the power density of 2 kW/cm2. The highest temperature rise increases nonlinearly with the increasing irradiation time because the heat dissipation increases with the increasing temperature of the grating surface and increases faster at the beginning of heating than after a period of time. The maximum thermal deformation of the grating surface under different laser irradiation times is shown in Figure 11, including the substrate structure and the relief structure. It can be suggested that the largest thermal deformation of the two structures increases nonlinearly with the increase in irradiation time. The deformation of the relief structure and the substrate is almost the same in the first 10 seconds. The deformation of the substrate is greater than that of the relief structure with increasing time, related to the material constants and whether being directly irradiated by the laser.
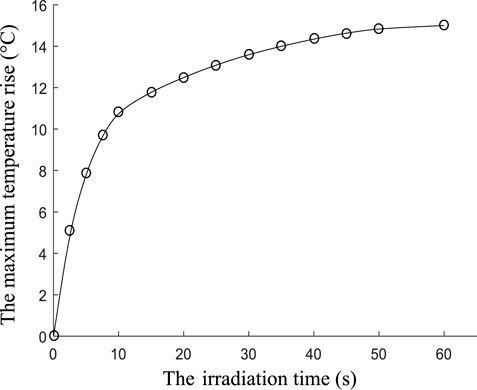
FIGURE 10. Influence of different irradiation times on the maximum temperature rise.
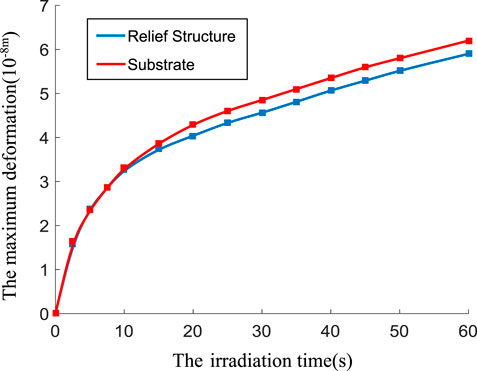
FIGURE 11. Influence of different irradiation times on the thermal deformation.
3.3 Dynamics of Beam Quality
Assuming that three individual beams can be well combined into one and the beam quality factor without grating thermal deformation is 1.00, by means of the propagation model built up in Section 2.2, the combined beam intensity distribution and the curves of M2 are shown in Figure 12A. Further, according to the grating surface deformation calculated in Section 3.1, the results for the irradiation time at 10, 30, and 60 s are depicted in Figures 12B,C,D, respectively. It can be suggested from Figure 12B that the combined beam generates the side lobes, and the calculated beam quality factor is 1.16. As the irradiation time increases, the main lobe of the combined beam becomes narrower, and the corresponding side lobes become increasingly obvious, as shown in Figure 12C. The side lobes become obvious because the diffractive angle of the beam is changed by the grating with thermal deformation and the beams passing through the grating inevitably deviate from the normal beam. Figure 12D gives the results at grating after being irradiated for 60 s, which calculated the beam quality as 1.56. The reason for the degradation of the beam quality is that the beam waist width and the divergence angle increase with the square of the beamwidth.
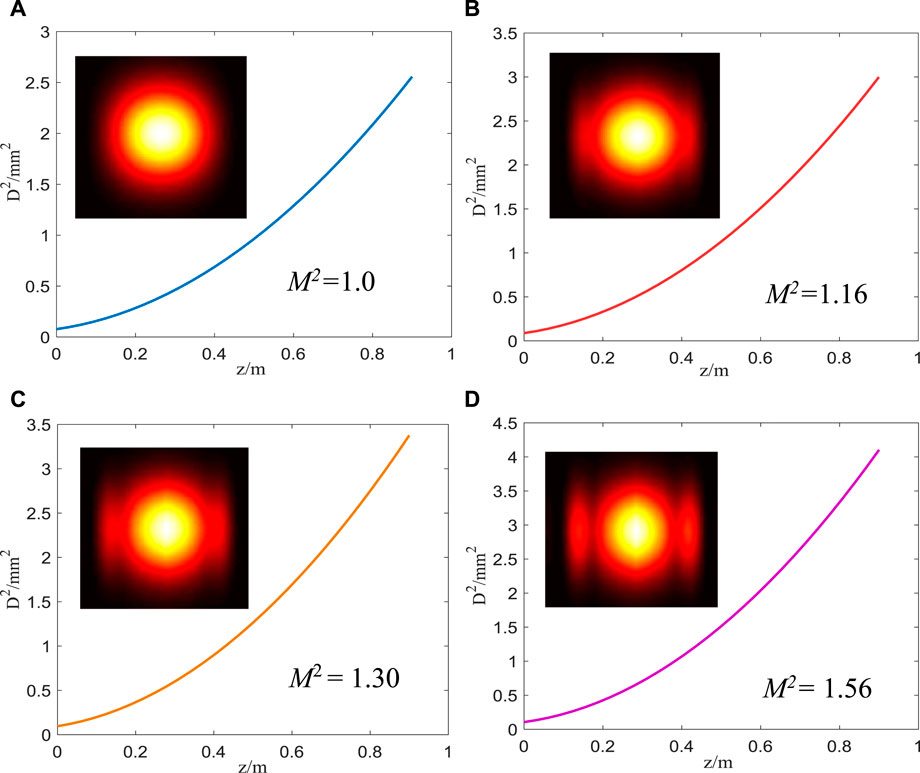
FIGURE 12. The intensity distributions and the curves of M2 of the combined beams (A) without deformation; (B) 10, (C) 30, and (D) 60 s.
Further, the variation of the beamwidth and divergence angle of the combined beam with the irradiation time are presented in Figures 13A,B. It can be seen that the beamwidths and the divergence angles of the combined beams remarkably rise with the increasing irradiation time. In addition, the divergence angle and the beamwidth increase rapidly in the first 10 seconds because the diffraction angle is affected by the thermal deformation.
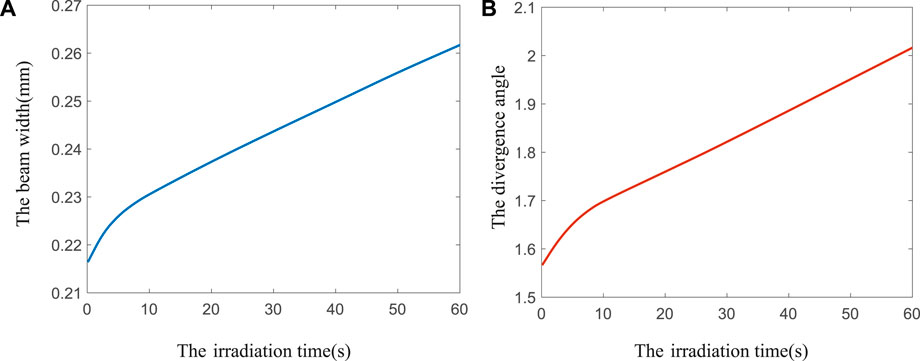
FIGURE 13. The curve of beamwidth and divergence angle of the combined beam with the irradiation time: (A) beamwidth; (B) divergence angle.
4 Experiment Setup and Results
4.1 Experimental Setup
To investigate the effect of the dynamic beam quality caused by the grating thermal deformation, an SBC experimental system was established, as shown in Figure 14. In the experiment, the pump is provided by a laser diode with a central wavelength of 976 nm through a coupled system consisting of an aspheric lens and a microscope objective. The fiber used is the Er/Yb codoped double-clad fibers named SM-EYDF-6/125-xp with lengths of 4.7 and 5.3 m. The oscillating resonator is constituted by an output coupling mirror with 10% reflectivity at 1,550 nm waveband and a dichroic mirror with 90% transmittivity for pump light and 95% reflectivity for signal light. The blazed grating with a groove frequency of 1,200 L/mm possesses no less than 60% diffraction efficiency. The Fourier transform lens is a bi-convex lens with a focal length of 50 mm. Due to the low output power of the combined beam, two pumped lasers with output power of 30 W were used to heat the grating, and the pumped lasers were adjusted to the same as the combined beam, including the beam size and irradiation area on the grating. According to the properties of thermoelastic deformation, each beam quality measurement is made after the grating is completely cooled and the measuring equipment has a delay of 15–30 s.
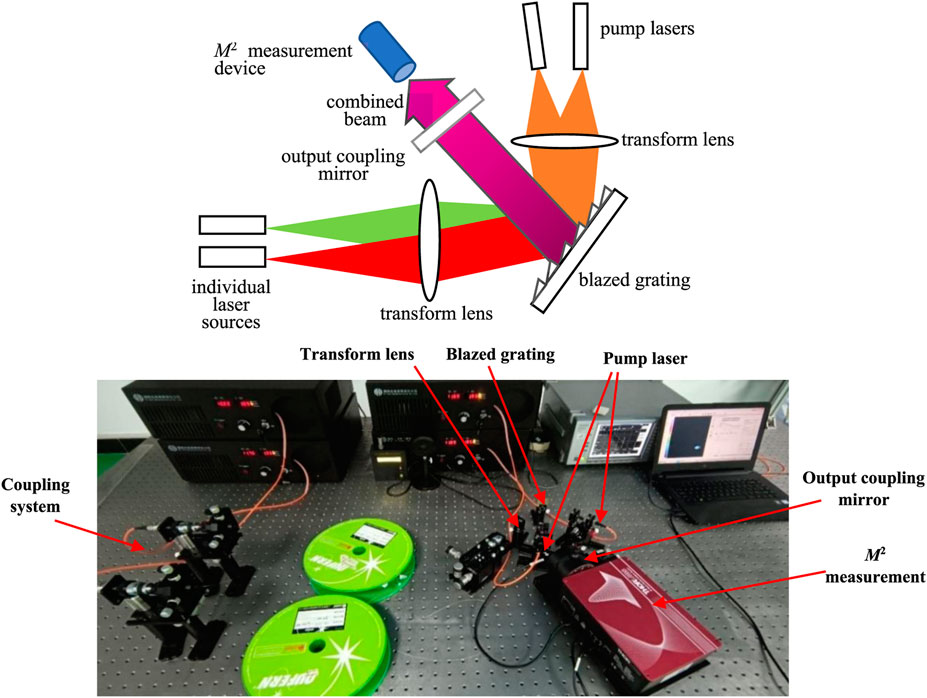
FIGURE 14. The schematic diagram of the experiments and experimental setup for grating thermal deformation.
The spectrum of the output laser is examined by a spectrometer (model: MS9740A), the beam profile of the output laser is examined by means of a beam analyzer (model: BP209-IR), and the beam quality is analyzed via a measuring system with a software (model: M2MS, Thorlabs Beam 6.0).
4.2 Experimental Results and Discussion
4.2.1 Beam Characteristics Before the Grating Heated
After establishing the SBC experimental system, the spectrum and Mx2 of a single laser element were measured, as shown in Figure 15. It can be seen that the Mx2 after grating diffraction is 1.15 and 1.17, respectively. The measured maximum output power is 332 and 296 mW, respectively.
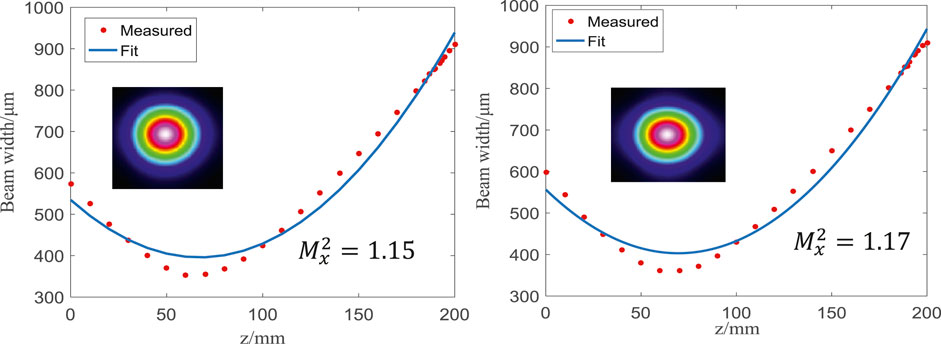
FIGURE 15. The beam characteristics of the single laser element.
The combined beam quality and spectrum are shown in Figure 16. It can be seen that two lasers can be well combined into one beam, and the peaks wavelengths were located at 1,544.8 and 1,560.4 nm with spectra separation of 17.1 nm. The measured combining power was about 448 mW, with a combining efficiency of about 71.3%. Compared with the single laser, the beam profile changes slightly, and Mx2 degrades to 1.29. The reasons for the deterioration of beam quality after combination can be summarized as 1) the grating scattering and etching errors will modulate the near field phase and 2) the lens aberration changes the intensity distribution and diffraction direction of each individual beam.
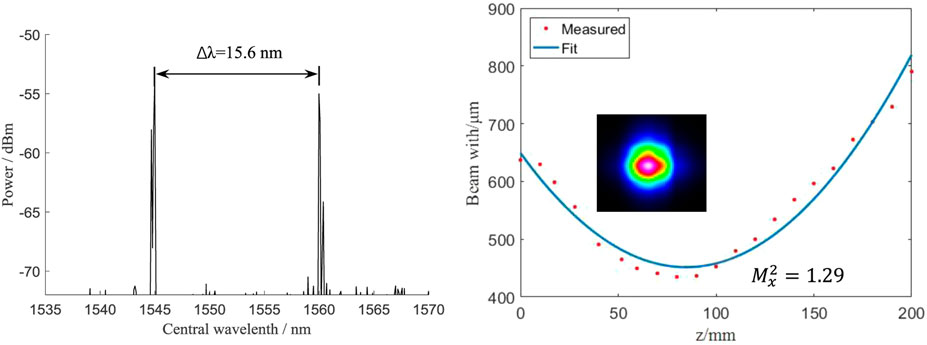
FIGURE 16. The combined beam spectral and beam quality.
4.2.2 Beam Characteristics After the Grating Heated
After the combined beam was measured, the grating was heated by two pumped lasers at different times. The measured beam profile and beam quality are shown in Figure 17. From Figure 17A, it can be seen that after grating was heated for 30 s, the measured Mx2 degraded to 1.34 and the beam profile hardly changed. The degradation of beam quality is because the grating is suddenly heated by the pumped lasers, resulting in the grating temperature gradient alters, which will cause the thermal deformation of the grating surface. Further, the diffractive angle of the beams was changed by the grating with thermal deformation.
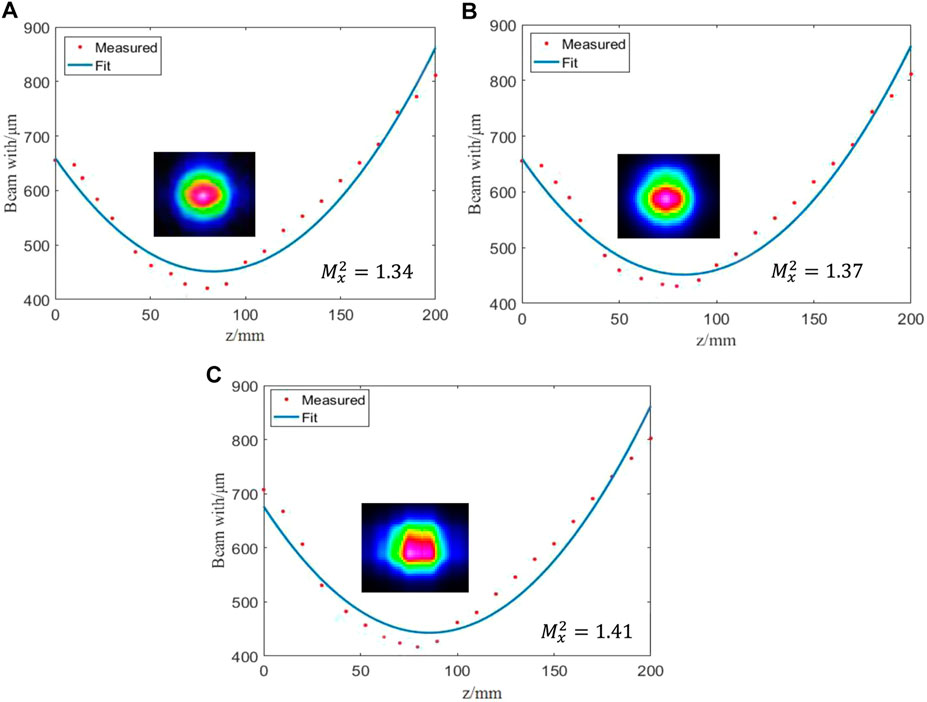
FIGURE 17. Measured beam profile and quality factor: (A) 30, (B) 60, and (C) 120 s.
Figure 17B gives the results at grating after irradiation for 60 s. Apparently, the measured Mx2 is 1.37, and the beam profile flattened in the center and widened slightly in the x-axis. The beam quality degradation is because the grating thermal deformation gradually increases with the increase in irradiation time, and both the beamwidths and the divergence angles of the combined beams rise with the thermal deformation.
Figure 17C gives the results at grating after irradiation for 120 s, indicating that the measured Mx2 is 1.41, and irregular distortion occurs in the beam profile. The reason is that the thermal deformation is further increased with the increase in irradiation time. The crosstalk intensified between adjacent elements by the beams deviating from the normal beam. Moreover, by summarizing Figures 17A–C, it can be found that the beam quality degrades continuously with the increasing irradiation time, corresponding to thermal deformation that varies with irradiation time, which is consistent with the theoretical analysis.
5 Conclusion
In this paper, the model including the thermal deformation of the grating, as well as the beam propagation of the SBC system, has been developed. By means of the model, the intensity distribution and M2 of the combined beam were analyzed in detail. The analysis indicates that the deformation of the substrate is greater than that of the relief structure in the same irradiation time as well, which is related to the material constants. This study further shows that the main lobe of the combined beam narrowed and the side lobes widened, which is the main reason for the beam quality of the combined beam degeneration. Further, the influences of the grating with thermal deformation on beam quality were investigated experimentally. The measured beam quality factor Mx2 is 1.29 without the thermal deformation. When the grating is heated at different times, Mx2 can arrive at 1.34, 1.37, and 1.41 at 30, 60, and 120 s, respectively. The experimental results indicate that the beam quality changes rapidly at the beginning of heating. Next efforts will focus on how to lower the influence of the thermal effect in the SBC system.
Data Availability Statement
The original contributions presented in the study are included in the article/Supplementary Material. Further inquiries can be directed to the corresponding author.
Author Contributions
Z-fD wrote the manuscript. S-bZ directed analysis and experiment. S-lZ and W-rL designed experiments. YW carried out experiments.
Funding
This work was supported by the National Natural Science Foundation of China (no. 41805014) and the Natural Science Foundation of Anhui Province, China (nos. 1808085MF189, KJ2019A0565, and KJ2019A0576). Natural Science Foundation of Anhui Province, China (gxbjZD2021063).
Conflict of Interest
The authors declare that the research was conducted in the absence of any commercial or financial relationships that could be construed as a potential conflict of interest.
Publisher’s Note
All claims expressed in this article are solely those of the authors and do not necessarily represent those of their affiliated organizations, or those of the publisher, the editors, and the reviewers. Any product that may be evaluated in this article, or claim that may be made by its manufacturer, is not guaranteed or endorsed by the publisher.
References
1. Ma Y, He Y, Tong Y, Yu X, Tittel FK Quartz-tuning-fork Enhanced Photothermal Spectroscopy for Ultra-high Sensitive Trace Gas Detection. Opt Express (2018) 26:32103–10. doi:10.1364/OE.26.032103
2. Liu X, Qiao S, Ma Y Highly Sensitive Methane Detection Based on Light-Induced Thermoelastic Spectroscopy with a 2.33 Μm Diode Laser and Adaptive Savitzky-Golay Filtering. Opt Express (2022) 30:1304–13. doi:10.1364/OE.446294
3. Stoev ID, Seelbinder B, Erben E, Maghelli N, Kreysing M Highly Sensitive Force Measurements in an Optically Generated, Harmonic Hydrodynamic Trap. eLight (2021) 1:7. doi:10.1186/s43593-021-00007-7
4. Qiao S, Ma Y, He Y, Patimisco P, Sampaolo A, Spagnolo V Ppt Level Carbon Monoxide Detection Based on Light-Induced Thermoelastic Spectroscopy Exploring Custom Quartz Tuning forks and a Mid-infrared QCL. Opt Express (2021) 29:25100–8. doi:10.1364/OE.434128
5. Ma Y, Hong Y, Qiao S, Lang Z, xiaonan L H-shaped Acoustic Micro-resonator Based Quartz-Enhanced Photoacoustic Spectroscopy. Opt Lett (2022). doi:10.1364/OL.449822
6. Lang Z, Qiao S, He Y, Ma Y Quartz Tuning fork-based Demodulation of an Acoustic Signal Induced by Photo-Thermo-Elastic Energy Conversion. Photoacoustics (2021) 22:100272. doi:10.1016/j.pacs.2021.100272
7. Pavel N, Dascalu T, Salamu G, Dinca M, Boicea N, Birtas A Ignition of an Automobile Engine by High-Peak Power Nd:YAG/Cr^4+:YAG Laser-Spark Devices. Opt Express (2015) 23:33028–37. doi:10.1364/OE.23.033028
8. Liu X, Ma Y. Sensitive Carbon Monoxide Detection Based on Light-Induced Thermoelastic Spectroscopy with a Fiber-Coupled Multipass Cell. Chin Opt Lett (2022) 20:031201. doi:10.3788/COL202220.031201
9. Zhou Taidou 周., Liang Xiaobao 梁., Zhao Lei 赵. 磊., Wang Lin 王. 琳., Li Chao 李. 超., Luo Yun 罗. 韵., et al. Effect of Volume Bragg Gratings Dispersion on Diffracted Beam Quality. Chin J Lasers (2017) 44(2):0201019–200. doi:10.3788/CJL201744.0201019
10. ChenZhang F, Zhang J, Ma J, Wei C, Zhu R, Han B, et al. Beam Quality Analysis and Optimization for 10 kW-Level Spectral Beam Combination System. Opt Commun (2019) 444:45–55. doi:10.1016/j.optcom.2019.03.030
11. Bourgeade A, Donval T, Gallais L, Lamaignère L, Rullier J-L Modeling Surface Defects in Fused Silica Optics for Laser Wave Propagation. J Opt Soc Am B (2015) 32:655–63. doi:10.1364/JOSAB.32.000655
12. Bai G, Shen H, Yang Y, Zhao X, Zhang J, Zhang H, et al. Theoretical Analysis of Beam Quality Degradation in Spectral Beam Combining of Fiber Laser Array with Beam Deviation. Opt Laser Techn (2018) 105:281–7. doi:10.1016/j.optlastec.2018.03.010
13. Yin S, Zhang B, Dan Y Effects of the Deformation of Reflection Volume Bragg Gratings on the M2-Factor of Super-gaussian Laser Beams. Opt Commun (2010) 283:1418–23. doi:10.1016/j.optcom.2009.12.005
14. Marchenko A, Lishman B, Wrangborg D, Thiel T Thermal Expansion Measurements in Fresh and saline Ice Using Fiber Optic Strain Gauges and Multipoint Temperature Sensors Based on Bragg Gratings. J Sensors (2016) 2016:1–13. doi:10.1155/2016/5678193
15. Peng Y, Peng F, Han J Influence of thermal Deformations of Resonators on Propagation Properties of Laser Annular Beams through Turbulent Atmosphere. Opt Laser Techn (2013) 45:272–7. doi:10.1016/j.optlastec.2012.05.039
16. Zhou TD, Liang XB, Li C, Zhao L, Wang JJ, Jing F Spectral Beam Combining of Fiber Lasers by Using Reflecting Volume Bragg Gratings. Chin Phys Lett (2016) 33:124–205. doi:10.1088/0256-307x/33/12/124205
17. Yang L, Wu Z, Zhang B Influence of thermal Deformation of a Multilayer Dielectric Grating on a Spectrally Combined Beam. Appl Opt (2016) 55(32):9091–1. doi:10.1364/AO.55.009091
18. Wang H, Song Y, Yang Y, Xian Y, You Y, Liu M, et al. Simulation and Experimental Study of Laser-Induced thermal Deformation of Spectral Beam Combination Grating. Opt Express (2020) 28(22):33334. doi:10.1364/OE.408832
19. Peng R. Influence of thermal Distortion on the Propagation of Beams in High Energy Laser Channel. Changsha, China: National University of Defense Technology (2009). p. 30–4. (in Chinese).
20. Zhang Y, Zhang B Analysis of Beam Quality for the Laser Beams after Spectral Beam Combining. Optik (2010) 121(13):1236–42. doi:10.1016/j.ijleo.2009.01.002
21. Wu Z, Yang L, Zhong Z, Zhang B. Influence of Laser Array Performance on Spectrally Combined Beam. J Mod Opt (2016) 63(19):1972–80. doi:10.1080/09500340.2016.1183056
22. Lu BD. Propagation and Control of High-Power Lasers. Beijing: National Defence Industry Press (1999). p. 23–4. ISBN: 9787118019551.
23. Chang-ming Z Investigation on the Experimental Measurement of Laser Beam Quality. Laser Technol (2000) 24(6):341–4.
Keywords: blazed grating, spectral beam combining, dynamic beam quality, grating thermal deformation, fiber laser
Citation: Deng Z-, Zhan S-, Wang Y, Le W- and Zha S- (2022) Dynamic of Grating Thermal Deformation on Beam Quality for Spectral Beam Combining. Front. Phys. 10:816734. doi: 10.3389/fphy.2022.816734
Received: 17 November 2021; Accepted: 07 January 2022;
Published: 09 February 2022.
Edited by:
Yufei Ma, Harbin Institute of Technology, ChinaReviewed by:
Zhao Shanghong, Air Force Engineering University, ChinaHanlin Peng, University of Electronic Science and Technology of China, China
Copyright © 2022 Deng, Zhan, Wang, Le and Zha. This is an open-access article distributed under the terms of the Creative Commons Attribution License (CC BY). The use, distribution or reproduction in other forums is permitted, provided the original author(s) and the copyright owner(s) are credited and that the original publication in this journal is cited, in accordance with accepted academic practice. No use, distribution or reproduction is permitted which does not comply with these terms.
*Correspondence: Sheng-bao Zhan, emhhbnNoYkBhbGl5dW4uY29t