- 1Shenzhen International Graduate School, Tsinghua University, Shenzhen, China
- 2Center for Precision Medicine and Healthcare, Tsinghua-Berkeley Shenzhen Institute, Shenzhen, China
- 3Department of Physics, Tsinghua University, Beijing, China
Mueller matrix polarimetry is exploited to find a potential polarization feature sensitive to subwavelength pore size variation in porous alumina samples. After careful analysis using standard machine learning methods, it is observed that existing Mueller matrix decomposition methods and parameters are insufficient to distinguish areas with different pore sizes. Thus, a new angular-based Mueller matrix polarimetry parameter capable of linearly separating areas with varying pore sizes is proposed. Such an angular-based parameter is novel because it is based on angular parameters, it utilizes multi-angle measurements, and it extracts physical information independent of existing decomposition methods or parameters. Hopefully this work should inspire future research on the angular parameters in Mueller matrix polarimetry and their relationships to microstructure information.
Introduction
Mueller matrix (MM) microscopy is a promising tool for scientific research and clinical application because it reveals the intrinsic optical property of objects [2–4]. When light interacts with samples, the polarization state of light may change due to scattering, absorption, refraction, and other optical phenomena; such changes in the polarization state before and after light interaction can be comprehensively described using the Mueller matrix. Scholars have exploited Mueller matrix polarimetry to analyze various materials and biological samples because the Mueller matrix encodes rich microstructure information [5–8]. Existing studies prove that Mueller matrix polarimetry can differentiate cancerous tissues [6, 7], liver fibrosis [9], selected species of algae [10], and aerosol particles [11].
The Mueller matrix encodes microstructure information, but it would still be obscure to us if the information is unextractable. Specifically, Mueller matrix polarimetry can be exploited to classify different materials, but it is often challenging to find an analytical form of such discriminating parameters. Scholars commonly start by analyzing the Mueller matrix parameters such as the Mueller matrix polar decomposition (MMPD) and Mueller matrix transformation (MMT), which are interpretable physical parameters in extremely simplified models [4, 12, 13]. This approach can be effective but not sufficient because in almost all cases, the samples are too complex to be differentiated using these simple parameters. An alternative way of extracting discriminating parameters from the Mueller matrix is using the PBP-PFP approach. Polarization basis parameters (PBPs) refer to the MMPD and MMT parameters, which are interpretable but oversimplified. PBPs are then linearly combined to create polarization feature parameters (PFPs), which are much more microstructure-specific. This approach is proven useful in pathological samples [4–6]. To differentiate more complex samples, nonlinear models in machine learning could be utilized, but such models are often uninterpretable, and the results are not generalizable.
Machine learning is a powerful tool for extracting microstructure information from polarimetric data. Given the sample data, machine learning algorithms build a model to make classification predictions or clustering decisions. Studies have shown that by utilizing machine learning, Mueller polarimetry can classify ex vivo colon cancer, hematoxylin and eosin (H&E)-stained and unstained breast cancer, H&E-stained cervical cancer, and skin cancer [5, 6, 31, 32]. Using deeper models and convolution layers that specialize on processing imagery data, the models trained using polarimetric data are capable of transforming between polarimetric imaging and brightfield imaging, synthesizing polarization-sensitive optical coherence tomography images from OCT images and classifying objects in degraded environments [33–35]. In this study, the machine learning algorithm, linear discriminant analysis, is applied to classify regions with different pore sizes using rotation-invariant parameters [29].
One of the limitations with the current microstructure feature parameter extraction methods is that they are mainly based on the rotation-invariant parameters. The orientation of the sample should not affect its microstructure information, so consequently, the microstructure feature parameters should not vary as the sample rotates. Therefore, it may seem logical to use rotation-invariant parameters as the basis parameters since their combination will also be rotation-invariant. However, polarization is sensitive to anisotropy, and such information is often contained in azimuthal parameters rather than in rotation-invariant parameters. To fully utilize Mueller matrix optics, the use of angular parameters is essential.
In this work, the idea of angular parameter-based microstructure feature parameters is explored and experimented. Using the porous anodic alumina (PAA) Mueller matrix polarimetry measurement data from the published work of Chuhui Wang [1], it is discovered that while the rotation-invariant parameters could not differentiate the pore size, the proposed parameter can not only differentiate areas with different pore sizes but also do so with a simple explicit analytical form. Through this study, we emphasized the importance of angular parameters in Mueller matrix polarimetry, demonstrated their potential for differentiating different microstructures, and hopefully inspired future research in this area.
Materials and Methods
Porous Anodic Alumina Fabrication
Porous anodic alumina (PAA) is a nanomaterial with a controllable porous aspect ratio and radius [14–17]. An electrochemically anodized alumina sheet under specific conditions will form an ordered porous alumina film on top of the thin barrier layer alumina (BLA)-covered aluminum substrate [19–24]. Its uniform pore sizes and dense distribution of pores makes PAA an idea membrane. Studies have shown that PAA can also be used as a photonic crystal [18].
Using the secondary anodization method, a PAA sample with two different pore diameters was fabricated and studied. The setup is shown in Figure 1. The fabricated sample is imaged under a scanning electron microscope, and Figure 2 shows the top and side view of the PAA sample. For the detailed fabrication process, please refer to [1].
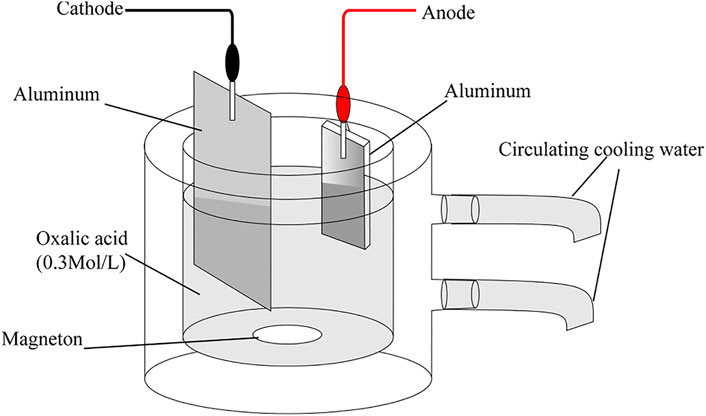
FIGURE 1. Diagram of the secondary anodization method [1]. Reprinted with permission from [1] © The Optical Society.
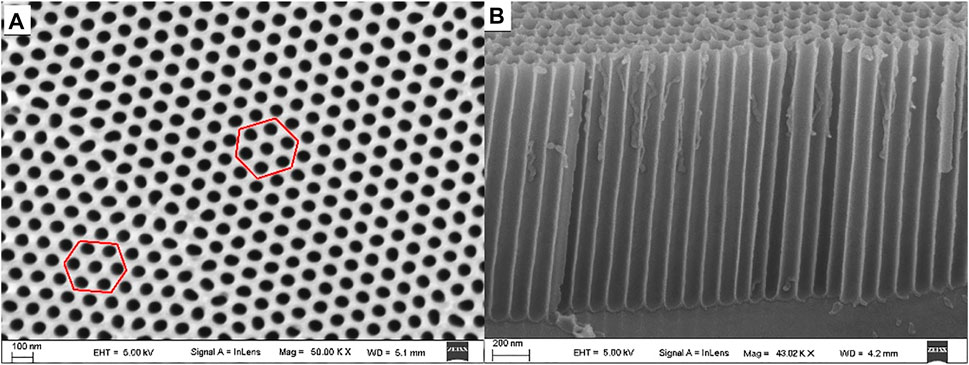
FIGURE 2. SEM images of the PAA sample, from the top view (A) and the side view (B). The hexagonal pore structure is clearly observed [1]. Reprinted with permission from [1] © The Optical Society.
Mueller Matrix Polarimetry
The dual-rotating retarder Mueller matrix measurement method is used in this study [1, 26]. An LED light source with a center wavelength of 633 nm is used. The system is calibrated using air as the standard sample, with a maximum error of 2%. Detailed information regarding the Mueller matrix imaging system can be found in [1].
The Mueller matrix images of the samples are measured at two angles: normal incidence and 32° tilting angle. At normal incidence, the pores are colinear with the light ray, so the interaction between the pores and light is relatively weak. At a tilting angle, the interaction starts becoming obvious. By comparing the Mueller matrices from two distinct tilting angles, it is possible to isolate the optical effect due to the pores. The tilting angle of 32° is selected for experimental convenience.
Analysis of Angular Parameters
The fabricated PAA sample is measured twice. With a random sample orientation, the PAA sample is first measured at normal incidence and then measured again at 32° tilting angle. At 0° tilting angle, the MMT parameter
The superscript (0) indicates that the values from the 0-degree incidence angle measurement are used for calculation. For a pure phase retarder, the MMT parameter
The superscript (32) indicates that the values from the 32-degree incidence angle measurement are used for the calculation. For a pure phase retarder, the MMT parameter δ is the phase of linear retardance [1, 4]. This parameter is sensitive to both the retardance due to the material and the pores. It is assumed that
which is experimentally observed to be valid. All the naturally formed blocks and their corresponding
Results
Figure 3 shows the measured Mueller matrix of the PAA sample. A clear vertical line separates the regions with different pore sizes. It is noted that the M12, M13, M21, and M31 elements are nearly zero, indicating the PAA exhibits a strong birefringence property. Natural formation of blocks is observed, and each block has its distinct azimuthal orientation, as indicated by the MMT parameter
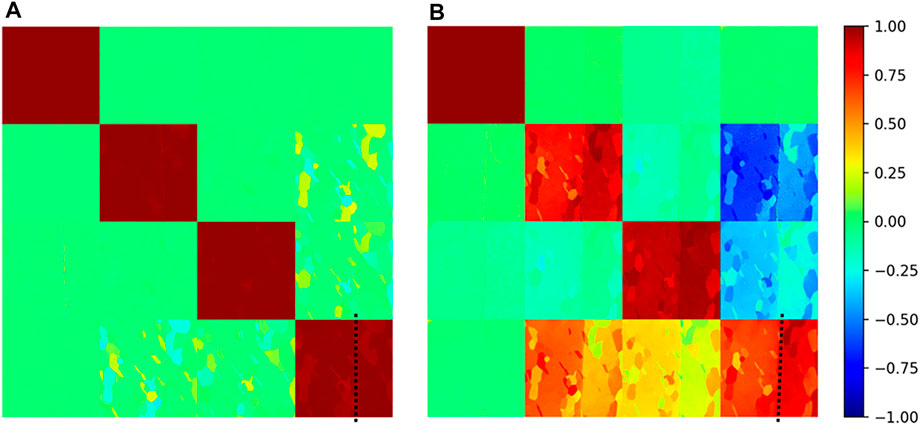
FIGURE 3. Experimentally measured Mueller matrix of the PAA sample with normal incidence (A) and 32° tilting angle (B). The black dotted line separates the regions with different pore sizes.
Now, to proceed with the analysis, we have manually selected several blocks from two regions with different pore sizes. Figure 4 shows all the blocks that we have chosen.
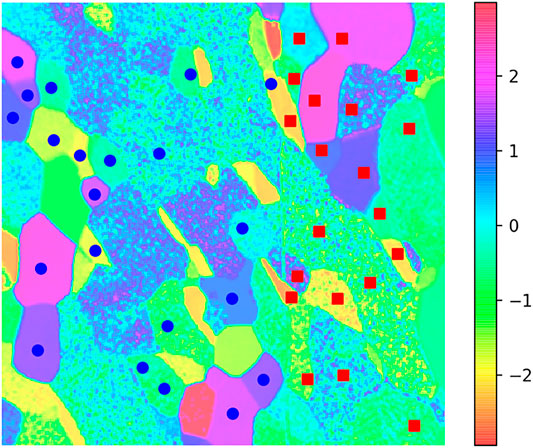
FIGURE 4. Locations of the manually selected block. The blocks from the two regions with different (query) are marked with different markers: one with blue dots and the other with red squares.
The PBP-PFP approach is first tested for reference. The rotation-invariant parameters from MMT are used as basis features, in order to linearly combine into a polarization feature parameter that can differentiate the blocks from the two regions with different pore sizes. Linear discriminant analysis is an algorithm that finds the hyperplane that separates different groups of data, given the group labels [29]. In this study, it is used to find the optimal linear combination of polarization parameters that discriminate the sets. An 8-fold cross validation method is used to determine the generalizability of the obtained PFP. The data points are partitioned into eight subgroups, and the model is evaluated eight times, each time selecting a subgroup as the testing set and the rest as the training set [30]. Using the 0-degree tilting data, the mean accuracy is 58.8%; with the 32-degree tilting data, the mean accuracy is 92.5%; the mean accuracy using data from both tilting angles is 80.4%. Such results imply that the interaction between the pores and photons is much stronger when the sample is tilted, and the rotation-invariant parameters cannot differentiate areas with different pore sizes.
An alternative approach based on angular parameters is proposed. Assuming a linear relationship between
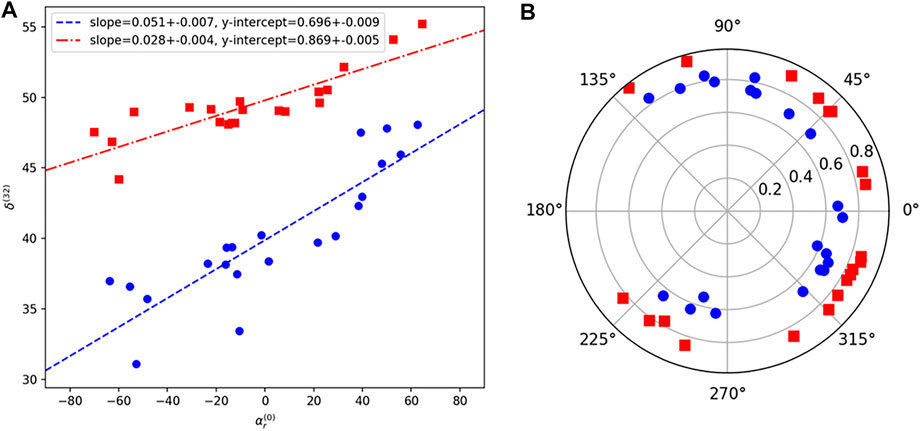
FIGURE 5. Scatter plot of
However, the zero-phase-delay assumption is unlikely to be true most of the time, depending on sample orientation. In other words, a perfect straight line is unlikely to be observed. So instead of representing the relationship between two periodic variables in the Euclidian fashion, the proper way of representing the linear relationship between
Discussion
To summarize, a pore size discriminative parameter is proposed based on the Mueller matrix angular parameter with multi-angle measurement. The parameter proposed in this study is important for three main reasons: first, it contains subwavelength pore size information; second, it extracts microstructure information outside of the existing MM parameters’ span; and finally, it proves that multi-angle measurement is necessary for decoding pore size information. All these points will be further addressed in the following paragraphs.
First, the proposed parameter can differentiate PAA regions with different sizes of nanoscale pores. The pore diameter in PAA ranges from 50 to 420 nm [21], depending on the modulating condition. Successfully discriminating regions with varying interpore diameters proves that Mueller matrix polarimetry is capable of resolving the nanostructure beyond the optical resolution limit.
Second, the proposed parameter expands outside the span of known rotation-invariant polarization parameters. Using MMT parameters as basis features, the performance of the linear model is unsatisfactory for the task of discriminating regions with different pore sizes, as shown in the last section. On the other hand, the proposed parameter can fully separate points from different pore size regions with a linear function. It implies that the polarimetric angular parameter encodes microstructure information that is not contained in rotation-invariant parameters.
Finally, the pore size information can only be extracted through multi-angle measurement. Clearly, the MMT parameters cannot fully describe pore size information through single-angle measurement since the best accuracy achieved was 92.5%. Even the newly proposed parameter needs measurement from two distinct incline angles. Therefore, it is possible that multi-angle measurement is compulsory for pore diameter extraction.
For context, there are two fields of polarimetry for the analysis of periodic nanomaterial: ellipsometry and Mueller matrix imaging. In the field of ellipsometry, experimental data are matched with theoretical simulation to obtain the physical parameters of the observed samples, such as porosity and pore size [27]. This is the idealistic approach for nanomaterial analysis since it has unrealistic assumptions for the sample, such as perfect uniformity. While on the other hand, in the field of Mueller matrix polarimetry, the decomposition/parametric approach is taken, and a non-idealistic sample is assumed. In this context, this study attempts to bridge the two fields, using the parametric approach to decode microstructural information, and attempted to obtain a feature parameter for pore size discrimination without making any unrealistic assumptions for the sample.
It is worth noticing that the linear relationship between
Despite the microstructure information it contains, the use of angular parameters for feature parameters has its limitations. The largest problem with angular parameters is unwrapping. As the sample rotates, the
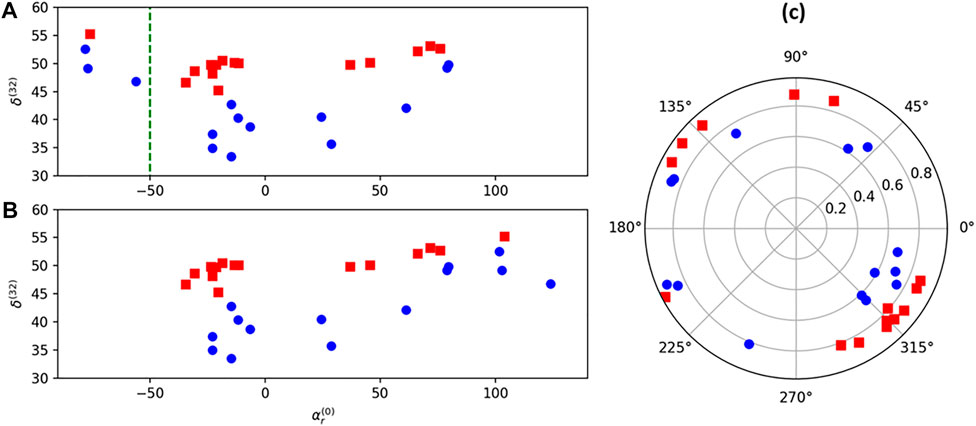
FIGURE 6. Scatter plot of
In total, the angular parameter encodes nanoscale structural information regarding the PAA pore diameter. It is proven experimentally that
Data Availability Statement
The original contributions presented in the study are included in the article/Supplementary Material, further inquiries can be directed to the corresponding author.
Author Contributions
JW analyzed the experimental data and typed the manuscript. CW (2nd author) performed the Mueller matrix experiment. CW (3rd author) fabricated the PAA sample. SS edited the manuscript and organized the PAA fabrication experiment. HM supervised the entire study.
Conflict of Interest
The authors declare that the research was conducted in the absence of any commercial or financial relationships that could be construed as a potential conflict of interest.
The handling editor declared a past co-authorship with one of the authors HM.
Publisher’s Note
All claims expressed in this article are solely those of the authors and do not necessarily represent those of their affiliated organizations, or those of the publisher, the editors, and the reviewers. Any product that may be evaluated in this article, or claim that may be made by its manufacturer, is not guaranteed or endorsed by the publisher.
References
1. Wang C, Qin P, Lv D, Wan J, Sun S, Ma H. Characterization of Anisotropy of the Porous Anodic Alumina by the Mueller Matrix Imaging Method. Opt Express (2020) 28:6740–54. doi:10.1364/oe.380070
2. He H, Sun M, Zeng N, Du E, Liu S, Guo Y, et al. Mapping Local Orientation of Aligned Fibrous Scatterers for Cancerous Tissues Using Backscattering Mueller Matrix Imaging. J Biomed Opt (2014) 19(10):106007. doi:10.1117/1.JBO.19.10.106007
3. Alali S, Vitkin A. Polarized Light Imaging in Biomedicine: Emerging Mueller Matrix Methodologies for Bulk Tissue Assessment. J Biomed Opt (2015) 20(6):061104. doi:10.1117/1.JBO.20.6.061104
4. Li P, Dong Y, Wan J, He H, Aziz T, Ma H. Polaromics: Deriving Polarization Parameters from a Mueller Matrix for Quantitative Characterization of Biomedical Specimen. J Phys D: Appl Phys (2022) 55:034002. in press. doi:10.1088/1361-6463/ac292f
5. Dong Y, Wan J, Si L, Meng Y, Dong Y, Liu S, et al. Deriving Polarimetry Feature Parameters to Characterize Microstructural Features in Histological Sections of Breast Tissues. IEEE Trans Biomed Eng (2021) 68(3):881–92. doi:10.1109/TBME.2020.3019755
6. Dong Y, Wan J, Wang X, Xue J-H, Zou J, He H, et al. A Polarization-Imaging-Based Machine Learning Framework for Quantitative Pathological Diagnosis of Cervical Precancerous Lesions. IEEE Trans Med Imaging (2021) 40:3728–38. doi:10.1109/TMI.2021.3097200
7. Du E, He H, Zeng N, Sun M, Guo Y, Wu J, et al. Mueller Matrix Polarimetry for Differentiating Characteristic Features of Cancerous Tissues. J Biomed Opt (20142014) 19(7):076013. doi:10.1117/1.JBO.19.7.076013
8. Antonelli M-R, Pierangelo A, Novikova T, Validire P, Benali A, Gayet B, et al. Mueller Matrix Imaging of Human colon Tissue for Cancer Diagnostics: How Monte Carlo Modeling Can Help in the Interpretation of Experimental Data. Opt Express (2010) 18:10200–8. doi:10.1364/oe.18.010200
9. Dubreuil M, Babilotte P, Martin L, Sevrain D, Rivet S, Le Grand Y, et al. Mueller Matrix Polarimetry for Improved Liver Fibrosis Diagnosis. Opt Lett (2012) 37:1061–3. doi:10.1364/ol.37.001061
10. Svensen Ø, Stamnes JJ, Kildemo M, Aas LMS, Erga SR, Frette Ø. Mueller Matrix Measurements of Algae with Different Shape and Size Distributions. Appl Opt (2011) 50:5149–57. doi:10.1364/ao.50.005149
11. Chen Y, Zeng N, Chen S, Zhan D, He Y, Ma H. Study on Morphological Analysis of Suspended Particles Using Single Angle Polarization Scattering Measurements. J Quantitative Spectrosc Radiative Transfer (2019) 224:556–65. doi:10.1016/j.jqsrt.2018.12.006
12. Lu S-Y, Chipman RA. Interpretation of Mueller Matrices Based on Polar Decomposition. J Opt Soc Am A (1996) 13:1106–13. doi:10.1364/josaa.13.001106
13. He H, Zeng N, Du E, Guo Y, Li D, Liao R, et al. A possible quantitative Mueller matrix transformation technique for anisotropic scattering media/Eine mögliche quantitative Müller-Matrix-Transformations-Technik für anisotrope streuende Medien. Photon Lasers Med (2013) 2(2):129–37. doi:10.1515/plm-2012-0052
14. Evans PR, Kullock R, Hendren WR, Atkinson R, Pollard RJ, Eng LM. Optical Transmission Properties and Electric Field Distribution of Interacting 2D Silver Nanorod Arrays. Adv Funct Mater (2008) 18(7):1075–9. doi:10.1002/adfm.200701289
15. Gerein NJ, Haber JA. Effect of Ac Electrodeposition Conditions on the Growth of High Aspect Ratio Copper Nanowires in Porous Aluminum Oxide Templates. J Phys Chem B (2005) 109(37):17372–85. doi:10.1021/jp051320d
16. Itoh N, Tomura N, Tsuji T, Hongo M. Strengthened Porous Alumina Membrane Tube Prepared by Means of Internal Anodic Oxidation. Microporous Mesoporous Mater (1998) 20(4-6):333–7. doi:10.1016/s1387-1811(97)00043-7
17. Musselman KP, Mulholland GJ, Robinson AP, Schmidt-Mende L, MacManus-Driscoll JL. Low-Temperature Synthesis of Large-Area, Free-Standing Nanorod Arrays on ITO/Glass and Other Conducting Substrates. Adv Mater (2008) 20(23):4470–5. doi:10.1002/adma.200801253
18. Masuda H, Yamada M, Matsumoto F, Yokoyama S, Mashiko S, Nakao M, et al. Lasing from Two-Dimensional Photonic Crystals Using Anodic Porous Alumina. Adv Mater (2006) 18:213–6. doi:10.1002/adma.200401940
19. Jessensky O, Gösele F, Gosele U. Self-Organized Formation of Hexagonal Pore Arrays in Anodic Alumina. Appl Phys Lett (1998) 72:1173–5. doi:10.1063/1.121004
20. Li F, Zhang L, Metzger RM. On the Growth of Highly Ordered Pores in Anodized Aluminum Oxide. Chem Mater (1998) 10:2470–80. doi:10.1021/cm980163a
21. Li AP, Müller F, Birner A, Nielsch K, Gösele U. Hexagonal Pore Arrays with a 50-420 Nm Interpore Distance Formed by Self-Organization in Anodic Alumina. J Appl Phys (1998) 84:6023–6. abs/. doi:10.1063/1.368911
22. Chen W, Wu J-S, Yuan J-H, Xia X-H, Lin X-H. An Environment-Friendly Electrochemical Detachment Method for Porous Anodic Alumina. J Electroanalytical Chem (2007) 600:257–64. doi:10.1016/j.jelechem.2006.10.022
23. Chen W, Wu J-S, Xia X-H. Porous Anodic Alumina with Continuously Manipulated Pore/Cell Size. ACS Nano (2008) 2:959–65. doi:10.1021/nn700389j
24. Gâlcă AC, Kooij ES, Wormeester H, Salm C, Leca V, Rector JH, et al. Structural and Optical Characterization of Porous Anodic Aluminum Oxide. J Appl Phys (2003) 94(7):4296–305. doi:10.1063/1.1604951
25. Wang G, Wang C, Shao R, Sun S. Fabrication of Orderly Porous Anodic Alumina Optical Waveguide Sensor via Interface Hydrophilic Treatment for the Detection of Small and Large Molecules. Adv Mater Inter (2020) 7(15):2000622–7350. doi:10.1002/admi.202000622
26. Goldstein DH. Mueller Matrix Dual-Rotating Retarder Polarimeter. Appl Opt (1992) 31(31):6676–83. doi:10.1364/AO.31.006676
27. Ngo D, Liu H, Sheth N, Lopez-Hallman R, Podraza NJ, Collin M, et al. Spectroscopic Ellipsometry Study of Thickness and Porosity of the Alteration Layer Formed on International Simple Glass Surface in Aqueous Corrosion Conditions. Npj Mater Degrad (2018) 2:20. doi:10.1038/s41529-018-0040-7
28. Lai TL, Robbins H, Wei CZ. Strong Consistency of Least Squares Estimates in Multiple Regression. Proc Natl Acad Sci (1978) 75(7):3034–6. doi:10.1073/pnas.75.7.3034
29. Suresh B, Ganapathiraju A. Linear Discriminant Analysis-A Brief Tutorial. Inst Signal Inf Process (1998) 18:1–8.
30. Fushiki T. Estimation of Prediction Error by Using K-fold Cross-Validation. Stat Comput (2011) 21:137–46. doi:10.1007/s11222-009-9153-8
31. Ivanov D, Dremin V, Genova T, Bykov A, Novikova T, Ossikovski R, et al. Polarization-based Histopathology Classification of Ex Vivo colon Samples Supported by Machine Learning. Front Phys (2022). doi:10.3389/fphy.2021.814787in press
32. Dremin V, Sieryi O, Borovkova M, Näpänkangas J, Meglinski I, Alexander B. Histological Imaging of Unstained Cancer Tissue Samples by Circularly Polarized Light. ECBO, OSA Tech Dig (2021). doi:10.1117/12.2614468paper EM3A.3
33. Lu S, Li N, Huang T, Du S, Yang D, Yao Y, et al. Computational Image Translation from Mueller Matrix Polarimetry to Bright-Field Microscopy. J Biphotonics (2021). doi:10.1002/jbio.202100242in press
34. Sun Y, Wang J, Shi J, Boppart SA. Synthetic Polarization-Sensitive Optical Coherence Tomography by Deep Learning. Npj Digit Med (2021) 4:105. doi:10.1038/s41746-021-00475-8
Keywords: Mueller matrix polarimetry, polarization, stokes vector, angular parameter, Mueller matrix imaging
Citation: Wan J, Wang C, Wang C, Sun S and Ma H (2022) Angular-Based Mueller Matrix Polarimetry Parameters for Subwavelength Pore Size Differentiation. Front. Phys. 10:815539. doi: 10.3389/fphy.2022.815539
Received: 15 November 2021; Accepted: 03 February 2022;
Published: 04 March 2022.
Edited by:
Ji Qi, Imperial College London, United KingdomReviewed by:
Igor Meglinski, Aston University, United KingdomXiuguo Chen, Huazhong University of Science and Technology, China
Daqian Wang, Hefei University of Technology, China
Copyright © 2022 Wan, Wang, Wang, Sun and Ma. This is an open-access article distributed under the terms of the Creative Commons Attribution License (CC BY). The use, distribution or reproduction in other forums is permitted, provided the original author(s) and the copyright owner(s) are credited and that the original publication in this journal is cited, in accordance with accepted academic practice. No use, distribution or reproduction is permitted which does not comply with these terms.
*Correspondence: Hui Ma, bWFodWlAdHNpbmdodWEuZWR1LmNu
 Jiachen Wan
 Chuhui Wang2
 Chunnan Wang
 Shuqing Sun
 Hui Ma