
94% of researchers rate our articles as excellent or good
Learn more about the work of our research integrity team to safeguard the quality of each article we publish.
Find out more
ORIGINAL RESEARCH article
Front. Phys., 25 March 2022
Sec. Medical Physics and Imaging
Volume 10 - 2022 | https://doi.org/10.3389/fphy.2022.812115
This article is part of the Research TopicCapturing biological complexity and heterogeneity using multidimensional MRIView all 9 articles
 Samo Lasič1,2*
 Nadira Yuldasheva3
 Filip Szczepankiewicz4,5,6
 Markus Nilsson4
 Matthew Budde7Erica Dall’Armellina3Jürgen E. Schneider3
 Irvin Teh3†
 Henrik Lundell1†
Diffusion encoding with free gradient waveforms can provide increased microstructural specificity in heterogeneous tissues compared to conventional encoding approaches. This is achieved by considering specific aspects of encoding, such as b-tensor shape, sensitivity to bulk motion and to time-dependent diffusion (TDD). In tensor-valued encoding, different b-tensor shapes are used, such as in linear tensor encoding (LTE) or spherical tensor encoding (STE). STE can be employed for estimation of mean diffusivity (MD) or in combination with LTE to probe average microscopic anisotropy unconfounded by orientation dispersion. While tensor-valued encoding has been successfully applied in the brain and other organs, its potential and limitations have not yet been fully explored in cardiac applications. To avoid artefacts due to motion, which are particularly challenging in cardiac imaging, arbitrary b-tensors can be designed with motion compensation, i.e. gradient moment nulling, while also nulling the adverse effects of concomitant gradients. Encoding waveforms with varying degrees of motion compensation may however have significantly different sensitivities to TDD. This effect can be prominent in tissues with relatively large cell sizes such as in the heart and can be used advantageously to provide further tissue information. To account for TDD in tensor-valued encoding, the interplay between asynchronous gradients simultaneously applied along different directions needs to be considered. As the first step toward in vivo cardiac applications, our overarching goal was to explore the feasibility of acceleration compensated tensor-valued encoding on preclinical and clinical scanners ex vivo. We have demonstrated strong and predictable variation of MD due to TDD in mouse and pig hearts using a wide range of LTE and STE with progressively increasing degrees of motion compensation. Our preliminary data from acceleration compensated STE and LTE at high b-values, attainable on the preclinical scanner, indicate that TDD needs to be considered in experiments with varying b-tensor shapes. We have presented a novel theoretical framework, which enables cell size estimation, helps to elucidate limitations and provides a basis for further optimizations of experiments probing both mean diffusivity and microscopic anisotropy in the heart.
Diffusion weighted MRI provides non-invasive contrast sensitive to tissue microstructure. For unbiased assessments, confounding factors need to be considered, some of which include: bulk motion of organs, orientation dispersion of anisotropic tissue micro-environments found within imaging voxels due to the limited spatial resolution, and time-dependent diffusion (TDD) effects becoming significant in larger cells, when diffusion encoding times are comparable to characteristic time required for spins to diffuse across intracellular spaces. Addressing these effects can enable increased specificity of tissue assessments and provide further microstructural information.
In diffusion tensor imaging (DTI), diffusion is encoded along several directions to obtain mean diffusivity (MD) and fractional anisotropy (FA) [1]. In cardiac imaging, DTI has been used to probe microstructural changes in diseases such as myocardial infarction [2], hypertrophy [3], fibrosis [4] and dilated cardiomyopathy [5]. In recent years, multidimensional diffusion encoding or tensor-valued encoding [6–16], underwent rapid conceptual and experimental development gaining traction as a technique capable of providing increased microstructural specificity unprecedented by DTI. This can be achieved by varying the encoding direction during the diffusion weighting, thus yielding b-tensors of various shapes. Special cases include the traditional linear tensor encoding (LTE), planar tensor encoding, also known as the double diffusion encoding [17], and spherical tensor encoding (STE) yielding isotropic diffusion weighting [9,13,18–20]. STE can be used to accelerate estimation of MD [19,21,22] and can be combined with LTE to probe microscopic anisotropy from data at higher diffusion weighting (b-values), which is unconfounded by orientation dispersion [6,7,23]. While tensor-valued encoding has been successfully applied in the human brain [10,15,24–26] and other organs [27–30], its potential and limitations are only beginning to be explored in the heart [31].
Due to bulk motion artefacts, diffusion MRI is particularly challenging in the heart. To avoid motion artefacts, cardiac-triggering has been applied with stimulated echo (STEAM) [32]. This method can easily achieve high diffusion encoding strengths (b-values) but suffers from signal loss [33,34], sensitivity to myocardial strain [35] and the need for breath-holding. Furthermore, the TDD effects vary with cardiac cycle, which cannot be independently controlled. The limitations of triggered STEAM can be largely avoided by using motion-compensated spin-echo (SE) methods, which can null gradient moments up to the first order (M1-nulling), i.e. velocity compensated [36] or second order (M2-nulling), i.e., velocity and acceleration compensated [37]. Nulling increasingly higher moments requires longer echo times, reducing the efficiency of waveforms with M3-nulling and beyond even on preclinical scanners [38]. Importantly, it has been shown that M2-nulling can significantly decrease motion artefacts compared to M1-nulling [37] and M2-nulling is favourable for in vivo cardiac diffusion imaging [38].
A method for designing b-tensors of arbitrary shapes with nulled gradient moments up to the 2nd order and beyond while also nulling the adverse effects of concomitant gradients was recently proposed [39,40]. In the initial in vivo and ex vivo measurements of diffusion in the heart myocardium, significant variation of MD values from encoding waveforms with varying degrees of motion compensation was observed [39]. Based on the previous experience with LTE using pulsed and oscillating gradients applied in ex vivo mouse heart [41], it was hypothesized that the MD variations are likely caused by differences in sensitivity to time-dependent diffusion (TDD) [42–48]. At high b-values, these effects may bias estimation of microscopic anisotropy [48,49] or they can be used advantageously to simultaneously assess cell size and anisotropy [48]. The effects of TDD in tensor-valued encoding can be understood based on our recent frequency-domain analysis [50] and the intuitive concepts of spectral tuning and spectral anisotropy. Tuning refers to the overall similarities in encoding power distributions between different b-tensors, where well-tuned b-tensors have similar encoding spectra and yield similar apparent mean diffusivities also for TDD. Spectral anisotropy, on the other hand, can only be ascribed to b-tensors beyond LTE, which have more than one non-zero eigenvalues. It refers to the encoding power distribution differences between different encoding axes within any single b-tensor, which may affect attenuation also at higher b-values (kurtosis). Here we focus mainly on the concept of tuning relevant for MD estimation.
The overarching goal of this study was to explore the feasibility of acceleration compensated LTE and STE on preclinical and clinical scanners ex vivo as the first step toward in vivo applications in the heart. Our aim was to examine MD bias caused by anisotropy and TDD, estimate cell sizes in the myocardium, and assess potential and limitations for probing microscopic anisotropy. To address these aims, we performed experiments on mouse and pig hearts using a wide range of LTE and STE with progressively increasing degrees of motion compensation. We have developed a novel theoretical framework, which enables us to understand the MD bias and estimate cell sizes. We suggest a frequency scaling useful for comparing encoding and diffusion spectra, and introduce the normalized cumulative encoding power as a low-pass filtered b-value useful for comparing size sensitivities across different encoding waveforms. Our results thus help to elucidate limitations and provide a basis for further optimizations of experiments probing both MD and microscopic anisotropy in the heart.
In this section we provide the theoretical framework for analyzing the apparent MD and discuss the relative frequency scaling of diffusion and encoding spectra, which is relevant for comparing size sensitivities across different encoding waveforms. We use spectral-domain signal analysis [45,50], which provides an effective way to study TDD at moderate diffusion weighting and for arbitrary encoding waveforms without well-defined diffusion times. The novelty of this framework is the identification of the spectral trace as the key encoding property affecting MD, which can be applied to arbitrary b-tensor shape. This property provides means of gauging tuning differences between different b-tensors. Furthermore, we introduce the normalized cumulative encoding power and the derived concepts of the differential size sensitivity and the “relative detection size” scale.
Within Gaussian approximation of cumulant expansion, the single compartment signal decay is mono-exponential. We thus consider negligible any effects of intra-compartmental kurtosis, which may at high b-values yield deviations from mono-exponential decay even for a single restricted diffusion compartment [12,51].
Consider the dephasing waveform given by
where γ is the gyromagnetic ratio and g(t) is the effective gradient waveform accounting for polarity change after each successive 180° RF pulse. At the time of spin-echo, the normalized signal is approximated by E ≈ exp( − β), with attenuation factor
Here we used the diffusion spectrum, Dij(ω), which is the velocity cross power spectral density and is given by the Fourier transform of velocity cross-correlation tensor [50]. We also define components of dephasing cross power spectral density, which we simply call encoding spectrum,
and are given by the Fourier transform of the dephasing waveforms,
The total encoding power, also known as the b-tensor is given by
Note that the trace of b-tensor is given by
where we introduced the spectral trace as
The spectral trace, s(ω), provides complete encoding information needed for predicting MD in powder-samples comprising multi-compartment time-dependent anisotropic diffusion within randomly oriented compartments.
Restricted diffusion in simple geometries can be accounted for by considering eigen-spectra, i.e., diffusion spectra along the principle compartment axes [45], λk(ω). The diffusion spectrum can thus be expressed with rotation matrices, R, as
At low b-values, rotation-averaged signal decay is given by the average attenuation factor, obtained by combining Eqs 2, 8 as
where
Here we also accounted for averaging over compartments with potentially different diffusivities, marked by the overline symbol. Isotropic diffusion spectra for various restricted geometries are shown as a function of restriction radii in Figure 1.
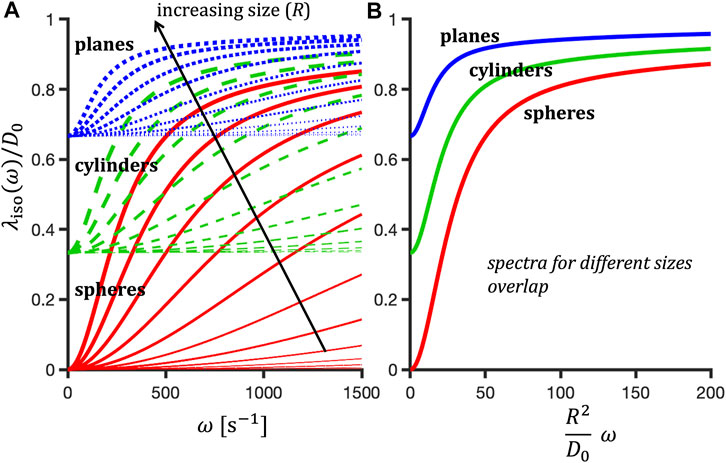
FIGURE 1. Normalized isotropic diffusion spectra, λiso(ω)/D0, for randomly oriented restrictions of varied shapes and sizes shown as a function of frequency (A) or the normalized frequency
The deviation from mono-exponential decay for rotation-averaged signals in multi-compartment systems is to the first order given by diffusion variance as b2V = ⟨β2⟩ − ⟨β⟩2 (see Eqs. 2.119 and 2.134-2.137 in [50]). By changing the shape of the b-tensor, the variance can be separated to contributions due to the variance of isotropic apparent diffusivities (tensor traces) and average diffusion anisotropy [7,53–55]. This encoding strategy can be used to estimate average diffusion anisotropy not confounded by the underlying orientation dispersion of individual compartments. However, TDD can affect both the initial signal decay (MD) and the deviations from mono-exponential decay (V). While MD is affected by the spectral trace of b-tensors (the tuning handle), the variance is affected also by the differences in encoding power distribution along different b-tensor axes, which may be called spectral anisotropy [48,50,56–59]. This effect has been previously noted by realizing that isotropic diffusion encoding may be rotation dependent [60,61]. While preliminary measurements in the human brain on a clinical scanner did not show rotational dependence of STE [57], the effect was very strong in fixed monkey brain on a preclinical scanner with much shorter encoding times [58].
Here we focus on the differences in spectral tuning across LTE and STE waveforms with varying degrees of motion compensation, which can predict differences in apparent MD values, enabling estimation of cell size. We also estimate the effects of TDD on rotation-averaged signals at higher b-values, which is relevant for assessment of microscopic anisotropy.
Compared to free (Gaussian) diffusion with a flat spectrum, restricted diffusion spectrum has a characteristic high-pass (Lorentzian) shape, i.e., contributing minimum attenuation (Eq. 9) at low frequencies (long times). The low-frequency expansion of λ(ω) is given by
where R is pore radius and
is the geometric factor determined by d = 1, 2, 3 for planar, cylindrical and spherical pores, respectively, and ζi are zeros of Bessel function of the first kind [45,62].
Within the limit of the low-frequency approximation, which depends on pore size and shape, Eq. 11 can be inserted in Eq. 9, suggesting a size sensitivity measure in terms of the second frequency moment of encoding spectra [63] (cf. Eqs 2.108 and 2.154 in [50] 1. However, note that for a given geometry, the full-range diffusion spectra for different R coincide at equal values of R2ω (see Figure 1). This suggests a common unitless scale given by
Alternatively, the “relative detection size” axis Rω could be used, defined as
which corresponds to the pore size at Ω = 1 from Eq. 13. While Rω is not an absolute scale, it allows comparing size sensitivities across waveforms with different degrees of motion compensation.
In contrast to the diffusion spectrum, the encoding power is limited to a low-frequency band, with the bandwidth depending on the oscillatory nature of various gradient waveforms. The upper encoding frequency limits can be compared across different waveforms by considering the normalized cumulative encoding power (see dashed lines in Figures 2, 3 and the Supplementary Figure S1),
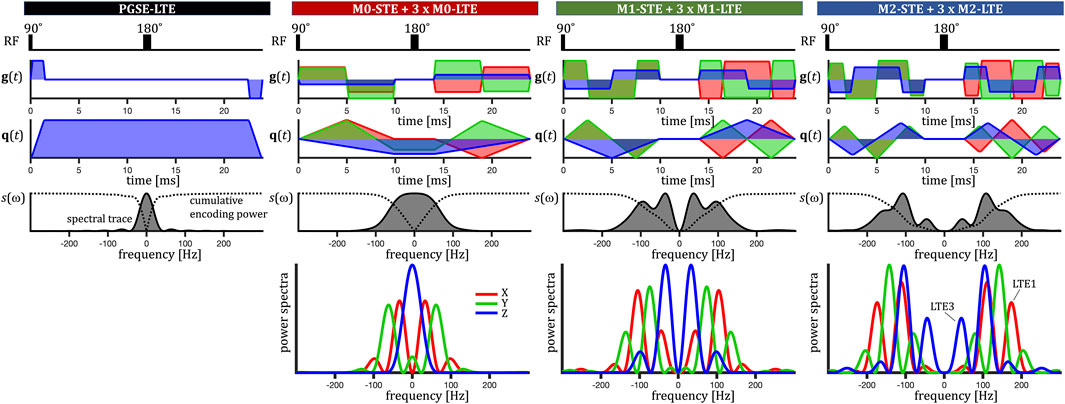
FIGURE 2. Encoding on the preclinical scanner. Radio frequency (RF) pulses, effective gradient waveforms g(t), dephasing waveforms q(t), normalized spectral trace s(ω) (grey shaded) and diagonal components of the dephasing cross power spectral density. The normalized cumulative encoding power
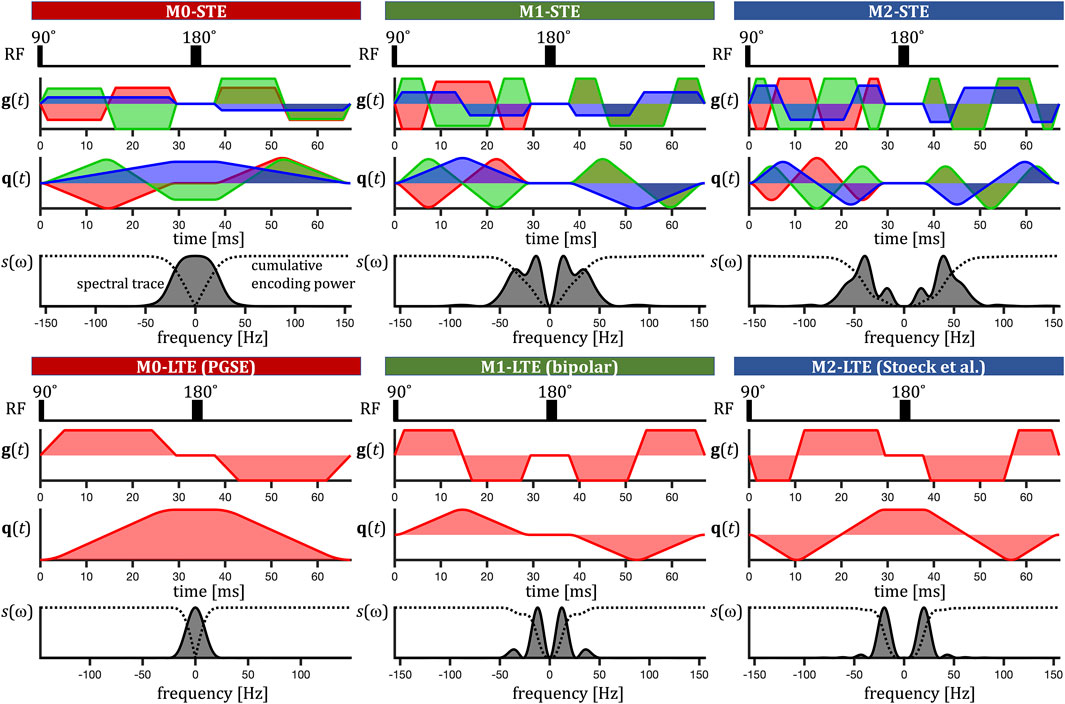
FIGURE 3. Encoding on the clinical scanner. Radio frequency (RF) pulses, effective gradient waveforms g(t), dephasing waveforms q(t) (XYZ in red, green, blue) and normalized spectral trace s(ω) (grey shaded). The normalized cumulative encoding power
The frequency window in which two encoding waveforms are expected to yield different MD values due to restricted diffusion (Eq. 9) is given by the difference in cumulative encoding power
To explore the feasibility of motion compensated linear and spherical tensor encoding, we have performed pilot experiments on preclinical and clinical scanners ex vivo. The main goal was to assess effects of TDD on MD estimation from different diffusion encodings and estimate sizes of cells in the myocardium. The second goal was to explore signal attenuation differences between acceleration compensated LTE and STE in the range of higher b-values (kurtosis), which could be used for assessment of microscopic anisotropy in vivo.
Two mouse hearts were arrested in slack state, perfusion fixed, excised, immersion fixed in PFA and embedded in 1% agarose PBS gel for MRI. All animal procedures were performed in accordance with United Kingdom Home Office authorization and the University of Leeds Animal Welfare and Ethical Review Committee.
Multi-shot 3D DW EPI data were acquired at 28°C on a Bruker Biospec 7T MRI scanner (Gmax = 1.5 T/m) using a custom diffusion waveform sequence: TR = 2 s, TE = 34.8 ms, NSA = 1, FOV = 10.8 × 9, ×, 9 mm, resolution = 225 × 225 × 450 μm. Twelve different diffusion encoding waveforms, i.e., LTE (3) + STE (1) with all gradient moments nulled up to zeroth, first and second order (M0, M1, M2) were applied with the encoding time τ = 24 ms and b = 50, 800 s/mm2. Note that the encoding time here represents total waveform duration. We additionally used the conventional non motion compensated PGSE with the same b-values and encoding time (Figure 2). To assess the potential for in vivo assessment of microscopic anisotropy, we performed pilot experiments with acceleration compensated (M2) encoding and an extended range of b-values, b = 50, 400, 800, 1200, 1600, 2000 s/mm2. LTE was in all cases applied in 6 non collinear directions and STE was not rotated and repeated 6 times.
Due to sample preparation and data acquisition issues related to heart 1, only a small region of heart one was viable for analysis, and we had to exclude the M0-LTE2 data point. Encoding waveform details are given below.
Two pig hearts were obtained from a local butcher, embedded in 1% agarose PBS gel, and scanned at room temperature. MRI data were acquired on a Siemens Prisma 3T clinical scanner using a prototype single-shot spin-echo EPI [64]: TR = 5 s, TE = τ + 22 ms, in-plane resolution = 3 × 3 mm2, partial-Fourier = 6/8, slice thickness = 8 mm, FOV = 320, ×, 118 mm2 with ZOOM-IT excitation. Six different diffusion encoding waveforms, i.e., LTE and STE with all gradient moments nulled up to zeroth, first and second order (M0, M1, M2) were applied with three different encoding times (τ = 46, 57, 67 ms) and b-values of 0.1 and 0.45 ms/μm2. In all cases, LTE was applied along 3 orthogonal directions repeated 4 times for each rotation, while STE was not rotated and repeated 12 times. In Figure 3, the time and frequency scales correspond to the encoding with the longest τ.
We have used a wide range of diffusion encoding waveforms with varying encoding times τ, degrees of motion compensation (M0, M1, M2) and b-tensor shapes (STE, LTE). These waveforms were designed to simultaneously null arbitrary gradient moments and concomitant gradients [39] 2. We would like to emphasize that the employed STE was only “K-nulled” [39,40], meaning that they can null effects of concomitant gradients only under a specific rotation, as applied in this study. The employed gradient waveforms, however, have varying sensitivities to restricted diffusion, characterized by their encoding spectra (see Figures 2, 3).
On the preclinical scanner we obtained LTE by using single channels (XYZ, LTE123) from the corresponding STE for each degree of motion compensation (see Figure 2). To extend the sensitivity to TDD at long diffusion times, we additionally applied a traditional pulsed gradient spin-echo (PGSE). At higher frequencies, relevant for restricted diffusion, the encoding power spectra for the LTE3 have significantly less power compared to LTE1, LTE2 and STE. Consequently, LTE3 waveforms are expected to yield lower MD values. For an unbiased anisotropy assessment, LTE would ideally be equally sensitive to TDD compared to STE, and thus yield equal MD values. Such waveforms could be considered perfectly tuned. However, this was not fulfilled in our encoding, where LTE3 is “less tuned” to STE than LTE1 and LTE2, the latter two being rather “similarly tuned.”
On the clinical scanner we used similarly designed STE as on the preclinical scanner and compared it with the b-value maximizing LTEs from the PGSE sequence (M0), bipolar (M1) and the waveform by Stoeck et al. [37] (M2). See Figure 3. We selected the viable encodings at varied encoding times τ to achieve identical b-values. A summary of all encodings used on preclinical and clinical scanners can be found in Table 1.
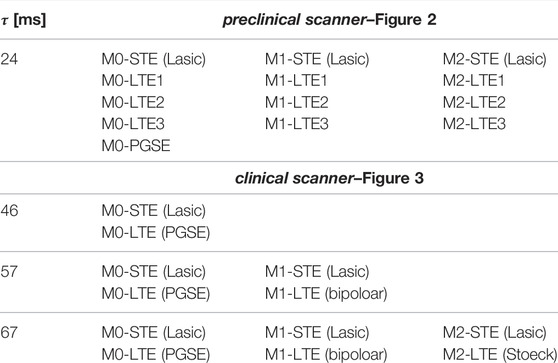
TABLE 1. Summary of all diffusion encodings at different encoding times τ, degrees of motion compensation (M0, M1, M2) and b-tensor shapes (STE, LTE) on preclinical (Figure 2) and clinical (Figure 3) scanners. For each degree of motion compensation, the preclinical LTE1/LTE3 waveforms yield similar/different MD compared to the STE waveforms (see Figure 2).
Significant MD differences observed with different diffusion encoding schemes motivated data modeling and cell size estimation. Further aim was to validate our theoretical predictions and assess the range of diffusion encoding times where TDD effects are expected to affect MD in the myocardium.
The myocardium was manually segmented based on the low b-value image and the ROI-average MD values were calculated as
where Nacq is the total number of acquisitions (directions and averages), which where identical for LTE and STE. To estimate cell sizes, we used a simple tissue model consisting of hindered and restricted compartments,
where fR is the apparent signal fraction associated with restricted diffusion, MDcyl(R, D0) is the rotation-averaged apparent diffusivity for cylinders (using Eq. 9 with λiso(ω) shown in Figure 1) and Dh is the hindered Gaussian diffusion coefficient. For each MDexp data we used the corresponding encoding spectral trace (see Figures 2, 3) and calculated MDcyl(R, D0) for 500 cylinder radii between 1-50 μm. The bulk diffusivity D0 was adjusted according to the temperatures in preclinical and clinical experiments, i.e. 2.48 μm2/ms at 28°C and 2.0 μm2/ms at 20°C, respectively3.
The hindered-restricted diffusion model was fitted globally to the ROI-average MDexp from 13 (preclinical) or 12 (clinical) different waveforms. MDcalc were calculated for each MDcyl(R, D0) and for fR between 0-1 (500 values) and Dh/D0 between 0.05-1 (500 values). The optimal fit was then found by searching for the minimal mean square difference between the MDcalc and MDexp values. The goodness of fit is thus reflected by the root mean square error (RMSE). Calculations and data fitting where implemented in MATLAB (The MathWorks, Natick, MA). Data, fitting and simulation code is publicly available at {https://doi.org/10.5518/1094} {Stay on the beat with tensor-valued encoding [Dataset and Code]: https://doi.org/10.5518/1094}.
The aim of noise simulations was to assess differential sensitivity to TDD for different encoding schemes. This provides an overview of expected contrast-to-noise ratios for different waveforms, noise conditions and cell sizes.
Noise simulations were implemented in MATLAB (The MathWorks, Natick, MA). We used close form expressions for diffusion eigen-spectra in simple geometries (spheres and cylinders) [45,48,50]. In the cases of eccentric cylinders and axisymmetric spheroids we used the corresponding eigen-spectra with two different restriction sizes. This approximation has been previously used and validated by simulations [48,65].
Average signals or signal differences (see Figures 8–13) were obtained by averaging Eq. 2 over a limited set of rotations, i.e., 15 for axisymmetric restrictions [6,7,48] and 60 for eccentric cylinders [23,66]. Note that we did not employ the known analytical expression for the diffusion variance of rotation-averaged signal [50] (mean kurtosis representation).
We used substrates with a mixture of restricted and hindered Gaussian diffusion compartments with varying signal fractions fR. Rician noise, corresponding to varying signal-to-noise ratios (SNR at b0 for each rotation), was added to signals from different substrate rotations in 1000 iterations. To have comparable SNRs between calculations with different number of rotations (15 and 60), the SNRs were rescaled according to
Differences between rotation-averaged signals from different encoding waveforms (STE and LTE or different LTE) were calculated, yielding average and standard deviation values subject to noise, ΔS and σΔS, respectively. The contrast-to-noise ratio ΔS/σΔS was used for evaluation in Figures 10–13.
The two-compartment hindered-restricted model (Eq. 17) fits experimental data from mouse and pig hearts well in all four pilot experiments both on preclinical and clinical scanners. The results are summarized in Table 2. Cell size estimates are consistent between mouse and pig hearts, suggesting diameters in the interval 11.6-15.6 μm (minimum to maximum estimated value). The apparent restricted signal fraction fR was in the interval 0.19-0.34 and the hindered diffusivities were around 1 μm2/ms for the mouse hearts and around 0.37 μm2/ms for pig hearts.

TABLE 2. Summary of results from the global fitting of the two compartment hindered-restricted model (Eq. 17) to MD values from all encoding waveforms applied on preclinical (mouse) and clinical (pig) scanners. The estimated parameters are: cell radius R, restricted signal fraction fR, hindered diffusivity Dh and the root mean square error (RMSE). For pig hearts, additional results are shown from a selected dataset only using long encoding times, τ = 67 ms.
For mouse hearts, ROI-average MD was in the interval 0.91-1.28 μm2/ms for heart 1 and 1.04-1.27 μm2/ms for heart 2 (see Figure 4). The TDD contrast was significant and consistent also at longer diffusion times (lower encoding frequencies) attainable on a clinical scanner for the pig hearts (Figure 3). In this case, the ROI-average MD values were consistently lower in the interval 0.55-0.8 μm2/ms (Figure 5) in both pig hearts, however yielding similar size estimates as for the mouse hearts.
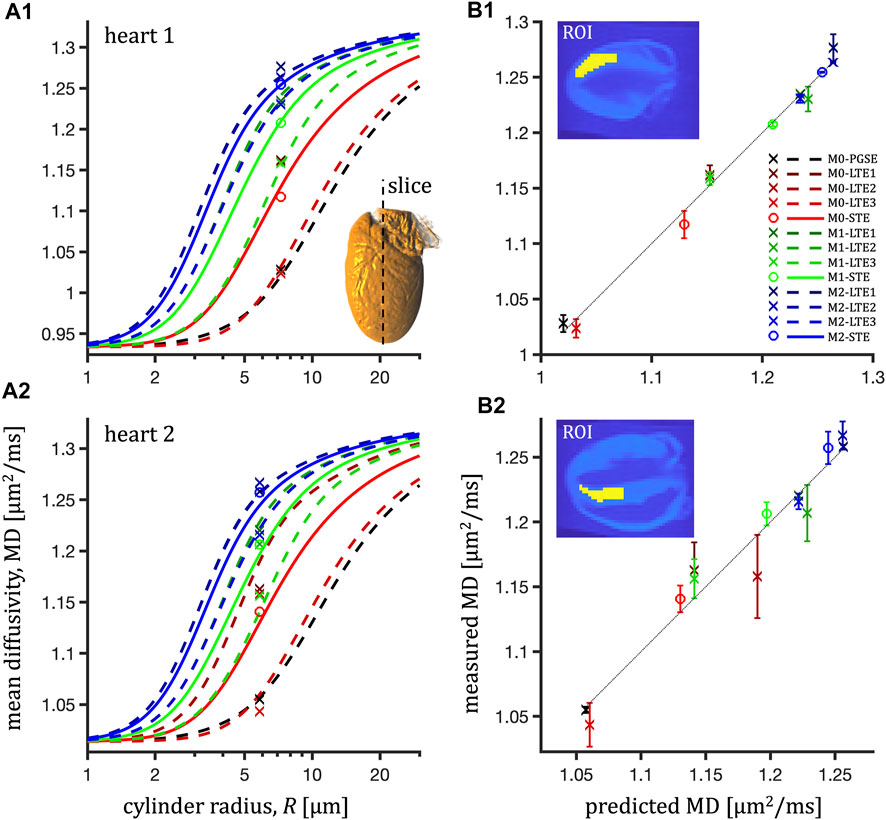
FIGURE 4. ROI-average mean diffusivity in the left ventricle myocardium in the central slice (long-axis view) of two mouse hearts (1-top, 2-bottom) and prediction of the hindered-restricted model. Left column (A1,A2): measured MD (markers) and prediction (lines) vs. cylinder radius, R. Right column (B1,B2): measured MD vs. prediction with error bars corresponding to the distance between measurement and prediction (dotted line for unity relation). For every degree of motion compensation (M0, M1, M2), the LTE waveforms correspond to the X,Y,Z channels of the STE waveforms.
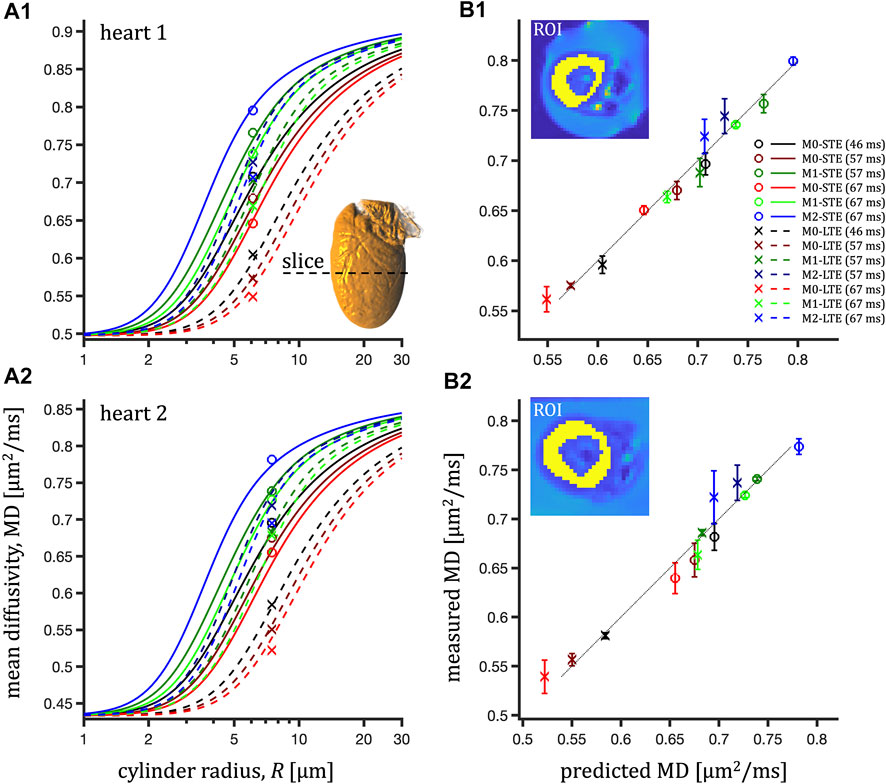
FIGURE 5. ROI-average mean diffusivity in the left ventricle myocardium in the central slice (short-axis view) of two pig hearts (1, 2-bottom) and prediction of the hindered-restricted model. Left column (A1,A2): measured MD (markers) and prediction (lines) vs. cylinder radius, R. Right column (B1,B2): measured MD vs. prediction with error bars corresponding to the distance between measurement and prediction (dotted line for unity relation).
Fitting only MD values probed at long encoding times yielded comparable results (τ = 67 ms in Table 2, Supplementary Figure S2). For pig hearts, a small tendency toward negative fit residuals was observed from LTE data (Figure 5). Fitting only STE data but accounting for residuals from the entire dataset yields comparable root mean square errors (RMSE) of 0.013 and 0.026 μm2/ms but large negative sums of residuals (−0.055 and −0.164 μm2/ms).
ROI-average signals from M2-LTE and M2-STE with b-values up to 2000 s/mm2 are shown in Figure 6. In both hearts a small deviation between the STE and LTE is visible, which can be attributed to microscopic anisotropy. However, also clearly visible is a deviation between LTE1 and LTE3, while LTE1 and LTE2 coincide well. These differences are well above the noise level, indicating a significant effect of TDD corresponding to the differences in encoding power spectra. The largest deviation from STE is seen for LTE3, which has more power at low frequencies compared to LTE1 and LTE2 waveforms. See Figure 2.
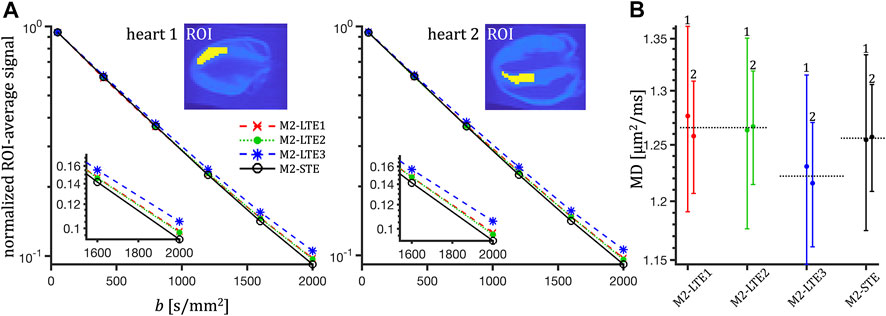
FIGURE 6. ROI and rotation-averaged signals from mouse hearts measured with acceleration compensated waveforms (M2-LTE and M2-STE) at high b-values (A) and MD estimates (B). The LTE waveforms correspond to the individual channels from the STE. In panel A, a small deviation can be seen between signals measured with STE and LTE, attributed to microscopic anisotropy. The signals for LTE1 and LTE2 coincide well. The largest deviation from STE occurs for LTE3, which has more encoding power at low frequencies (see Figure 2). In panel B we can see the differences between the MD estimates for the three encodings in both hearts (labelled 1 and 2). Note the similar values for LTE1 and LTE2 and the relatively lower values for LTE3, which is related to spectral anisotropy of the STE. Even though the MD values are higher for LTE1 and LTE2 compared to STE (as expected from the encoding power distributions), the signals at higher b-values are clearly less attenuated for LTE compared to STE, supporting the inference of diffusion anisotropy.
To examine size sensitivity differences between different LTE and STE waveforms (Figure 4), we calculated the differences in normalized cumulative encoding power spectra as a function of Rω (Eq. 14), which we call differential size sensitivity
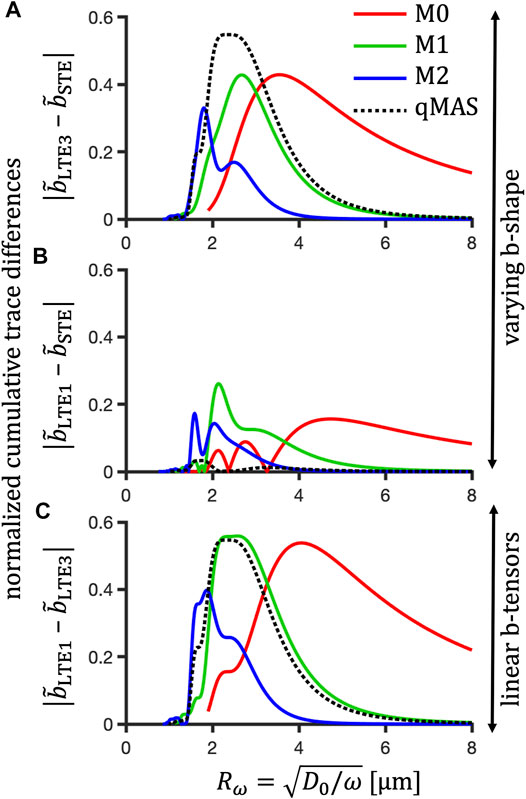
FIGURE 7. Differential size sensitivity for different degrees of motion compensation. Absolute differences in normalized cumulative encoding power between STE and LTE3 (A), STE and LTE1 (B), and between LTE3 and LTE1 for the preclinical M0 (red), M1 (green) and M2 (blue) waveforms. As a reference, a comparison between the “detuned” LTE and STE, “tuned” LTE and STE and between “tuned” and “detuned” LTE are shown for qMAS (black doted lines) in panels A, B and C, respectively. The x-axis shows the “relative detection size” Rω for D0 = 2.5 μm2/ms. Note that the maxima shift to smaller sizes (higher frequencies) from M0 to M2. The relatively high values for qMAS in panel A indicate poor tuning, while the low values in panel B indicate good tuning between STE and LTE waveforms. The differential sensitivity for qMAS is similar to that of the M1 waveforms, which is particularly visible in panels A and C. Large values in panel C are indicative of large spectral anisotropy for the preclinical STE. Note that the differential sensitivity tends to generally decrease with the degree of motion compensation, which is characterized by increasing power at higher frequencies.
Figure 8 shows the theoretical prediction for rotation-averaged normalized signal vs. b-value encoded with the preclinical M0, M1 and M2 waveforms (Figure 2, Table 1) for a substrate of randomly oriented impermeable cylinders with varying radii (1, 2.5, 5 μm). While in this single-compartment example STE always yields mono-exponential signal decay regardless of size, microscopic anisotropy can cause deviation from mono-exponential decay for LTE, which is particularly visible for smaller sizes (1 μm). In this case, the results among LTEs are approximately matching while deviating from STE. This illustrates the first potential source of MD bias when comparing estimations from LTE and STE data at increasing b-values. The second source of MD bias is due to TDD, which becomes dominant for larger restrictions, where different initial slopes or ”true” apparent MD values (dashed lines) are expected from LTE and STE data. This effect is due to the different sensitivities to restricted diffusion. A pronounced deviation from STE attenuation is visible for the LTE3 (red lines), while the LTE1 approximately matches the STE.
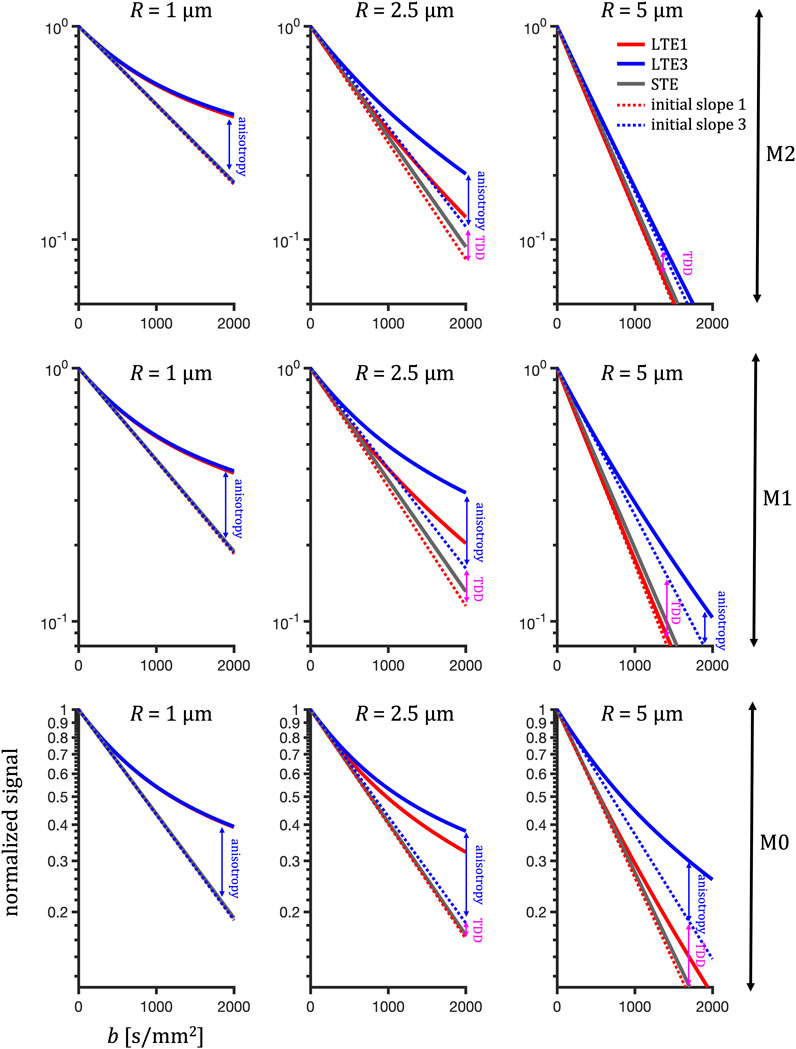
FIGURE 8. Predicted signal vs. b-value illustrating the competing effects of anisotropy and TDD at different sizes. Rotation-average signals are calculated from apparent diffusivities in 15 randomly oriented cylinders (D0 = 2.48 μm2/ms, radius R) probed by the preclinical encoding waveforms LTE1 (red), LTE3 (blue) and STE (grey) with varying degrees of motion compensation (M0-M2, bottom to top rows). Dotted lines indicate attenuation in the limit of low b-values. Arrows mark the differences due to anisotropy and TDD (visible at intermediate and large sizes). For small restrictions, the initial attenuations coincide and the signal deviation between LTE and STE at higher b-value is due to compartment anisotropy. With increasing cylinder radius the difference between size sensitivities of different encoding waveforms become visible. Note the higher signals for the LTE3 compared to the LTE1 and similar initial slopes for LTE1 and STE. For very large cylinders, the anisotropic diffusion variance (mean kurtosis) is overshadowed by an increased MD and can no longer be detected (for M1 and M2). However, the effect of TDD on MD remains clearly visible.
The MD bias is shown as the ratios MDLTE3/MDSTE and MDLTE1/MDSTE in Figure 9 vs. b-value and size of randomly oriented cylinders for the preclinical M0, M1 and M2 waveforms. The relative size scale
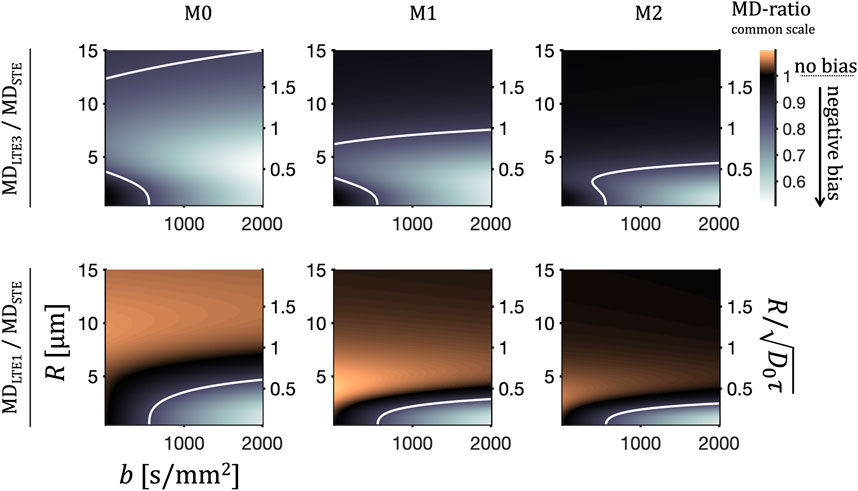
FIGURE 9. MD bias due to anisotropy and TDD. Apparent diffusivities were calculated for cylinders and for a range of radii R and b-values as in Figure 8. Shown are the ratios between MD values from LTE3 and STE, MDLTE3/MDSTE (upper row) and between LTE1 and STE, MDLTE1/MDSTE (bottom row) for the preclinical M0, M1 and M2 waveforms (left to right), which shown in Figure 2. The normalized size scale is shown on the right, where the normalization constant represents a characteristic diffusion distance during encoding time τ and
What signal differences, and thus restriction sizes, can be reliably detected is determined not only by the relative encoding and diffusion power spectra but also by SNR. We thus considered the contrast-to-noise ratio, ΔS/σΔS in Figures 10–13.
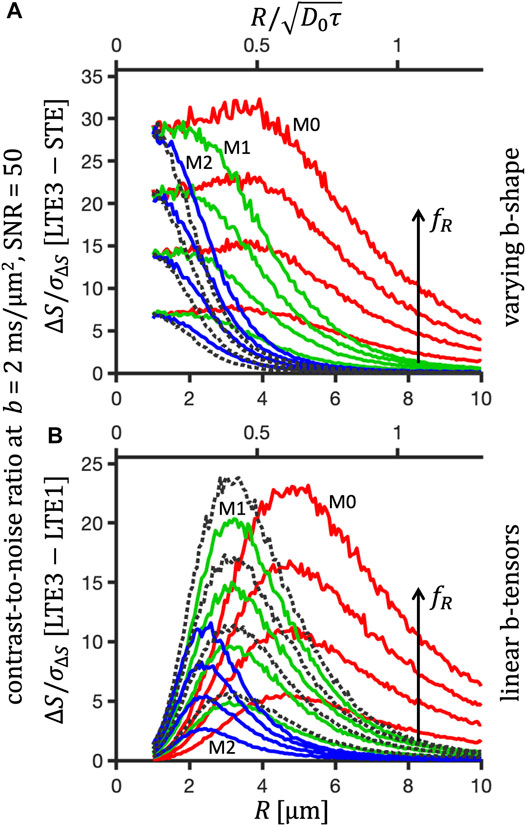
FIGURE 10. Size sensitivity for cylindrical pores at SNR = 50 and varying signal fractions fR. Contrast-to-noise ratio, ΔS/σΔS at b = 2 ms/μm2 for diffusion restricted within cylindrical pores of varying radii R encoded with the M0- (red), M1- (green), M2- (blue) LTE1, LTE3 and STE preclinical waveforms and for the tuned, detuned and STE qMAS waveforms (black dotted). Substrate consists of compartments with hindered Gaussian (Dh = 1 μm2/ms) and restricted diffusion (D0 = 2.48 μm2/ms), with varying signal fractions fR = 0.25, 0.5, 0.75, 1 corresponding to increasing signal differences. Differences between rotation-averaged signals from LTE3 (or detuned qMAS) and STE (A) and from LTE1 and LTE3 (or tuned and detuned qMAS) (B) were calculated, yielding average and standard deviation values subject to noise, ΔS and σΔS, the ratios of which are shown in A and B.

FIGURE 11. Size sensitivity for cylindrical pores at varying SNR. Contrast-to-noise ratio, ΔS/σΔS at b = 2 ms/μm2 (as in Figure 10) and for fR = 0.5 is shown for M0-, M1-, and M2- (left to right) LTE and STE waveforms. Two common colour scales are used to show contrast-to-noise ratios for rotation-averaged signals from LTE3 and STE (top row) and from LTE1 and LTE3 (bottom row). Contour lines indicate ΔS/σΔS = 3.

FIGURE 12. Size sensitivity for eccentric cylindrical pores at SNR = 25. Contrast-to-noise ratio, ΔS/σΔS at b = 2 ms/μm2 and for fR = 0.5 is shown for M0-, M1-, and M2- (left to right) LTE and STE waveforms as a function of mean radius R and eccentricity ϵ. For ellipsoidal cross-section with semi-axes R1 and R2 < R1, we have
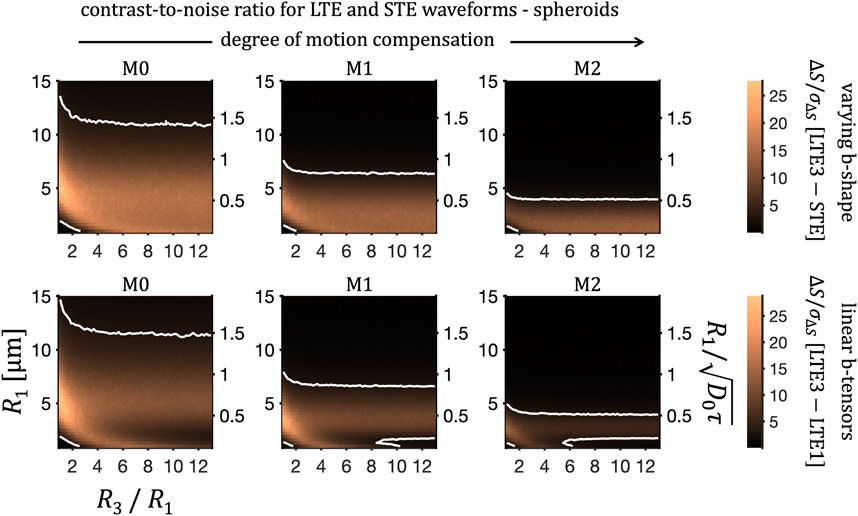
FIGURE 13. Size sensitivity for spheroidal pores at SNR = 50. Contrast-to-noise ratio, ΔS/σΔS at b = 2 ms/μm2 (as in Figure 12) and for fR = 0.5 is shown for M0-, M1-, and M2- (left to right) LTE and STE waveforms as a function of semi-axis R1 = R2 and ratio R3/R1. Two common colour scales are used to show contrast-to-noise ratios for rotation-averaged signals from LTE3 and STE (top row) and from LTE1 and LTE3 (bottom row). Contour lines indicate ΔS/σΔS = 3.
The frequency shift in cumulative encoding power differences shown in Figure 7 is reflected in Figure 10, where we consider a substrate of randomly oriented cylinders with varying fractions of restrictions measured at a large b-value. When comparing signals from LTE and STE (Figure 10A), the differences can be seen to vanish for large cylinder radii, when diffusion becomes Gaussian and less anisotropic. On the other hand, the anisotropy is maximized in the limit of small sizes, reflected by large signal differences. When comparing differently tuned LTEs (Figure 10B), the signal difference is maximized at intermediate sizes, depending on the degree of motion compensation, and vanishes in the limits of large and small sizes when diffusion becomes Gaussian. This observation is similar as for the MD-bias shown in Figure 9. Varying the fraction of restrictions resulted mainly in modulation of the contrast magnitude not causing any relative shifts along the size axis. We thus show results for a single fraction fR = 0.5 in Figures 11–13.
Figure 11 illustrates the feasibility of detecting signal differences for varying cylinder radii and at various SNR levels. Contour lines, shown at the contrast-to-noise value of 3, can be used to identify the range of detectable sizes. For completeness, we performed a similar analysis for eccentric cylinders and prolate spheroidal pores. For eccentric cylinders (Figure 12) and spheroids (Figure 13), two different diffusion eigen-spectra, associated with different pore dimensions, can in principle be sensed. For eccentric cylinders, size sensitivity as a function of geocentric mean pore radius is largely not affected by eccentricity. Only for eccentricities larger than approximately 0.8 a significant broadening of the size sensitivity band can be seen. As noted in our previous work [48], due to imperfect tuning the signal differences do not vanish in the intermediate size range even in the limit of spherical pores, R3/R1 = 1 (Figure 13). For large anisotropies, signal differences between differently tuned LTEs (lower row) trace two sensitivity bands, which are diverging with increasing anisotropy. One of the bands, related to the long R3 axis, can be seen drifting “out of sight” accessible to the applied encoding spectra.
This study was motivated by the potential of using motion compensated tensor-valued diffusion encoding for microstructure assessment of the heart. Our main objectives were to explore the experimental feasibility of various diffusion encodings and develop a theoretical framework accounting for TDD. Different encodings yielded significantly different MD values, which can be fitted with the hindered-restricted diffusion model and allow for cell size estimation. Acceleration compensated encoding can be applied with high b-values on a preclinical scanner and the signal differences from STE and differently tuned LTE can be understood in terms of anisotropy and varying sensitivity to TDD. Also our contrast-to-noise assessments based on simulations with various substrates and encodings suggest that sensitivity to TDD in the myocardium is expected within the experimentally feasible range.
While STE can be employed for microstructure imaging, when combined for example with LTE, it can also be used to accelerate MD estimation [19,21,22]. If gradient waveforms are allowed to be asymmetric with respect to the refocusing pulse in spin-echo sequences, they can be optimised with the benefit of shorter TE and higher SNR, as suggested for M2-nulled LTE encoding [67]. This strategy can be applied also for optimizations of tensor-valued encoding [68]. However, if not accounted for, asymmetric waveforms are prone to adverse effects of concomitant gradients leading to signal bias and image artefacts [14]. This consideration has been central in our tensor-valued encoding design featuring arbitrary gradient moment nulling as well as the suppression of concomitant gradient effects[39], which has been further optimized for maximum b-values and SNR [40].
In terms of sensitivity to time-dependent diffusion, STE can be advantageous compared to OGSE-LTE, due to its efficient q-trajectories capable of achieving high b-values at short diffusion times (high frequencies), thus extending the size resolution limit [63]. The gradient waveforms applied in our experiments comprised a similar range of diffusion times (encoding power in the frequency range up to about 200 Hz) compared to a previous mouse heart study with PGSE and OGSE [41] (Figure 2). We remark however that our experiments were not optimized for probing size, since the encoding spectra of various waveforms were broad and overlapping. Nevertheless, we obtained reasonable size estimates and provide insights useful to optimize size measurements.
The frequency-domain analysis allows gauging sensitivity to restricted diffusion for LTE and STE gradient waveforms, each comprising broadly distributed diffusion times (Figures 2, 3). This enables global fitting of apparent mean diffusivities from 13 different waveforms and thus provides estimates for ROI-average cell sizes. As predicted, a significant variation of MD estimates, encoded with a wide range of waveforms, was observed in mouse and pig hearts measured on preclinical and clinical scanners, respectively (Figures 4, 5). Consistently lower MD values for pig hearts on the clinical scanner were due to the lower temperature compared to the preclinical scanner (20 vs. 28°C). Accounting for different encoding spectra, the MD values could be globally fitted with the hindered-restricted diffusion model. The results suggest that the range of encoding waveforms applied on preclinical and clinical scanners had nearly optimal diffusion times for detecting restricted TDD effects in the heart. The resulting size estimates are consistent between mouse and pig hearts, suggesting cell diameters in the interval 11.6-15.6 μm, which correspond well to the cells in human heart estimated with microscopy and Coulter Channelyzer [69]. While some variation of cardiomyocytes size in mammals may be expected, similar sizes have been reported in calf (12-13 μm) [70], rat (18-21 μm) [71], pig (12-22 μm) [72,73] and human (10-25 μm) [74]. These size range estimates are however often from small sample sizes and prone to preparation artefacts.
The restricted signal fractions deduced here were lower than that deduced by a two-compartment model in the calf heart [70] and a range of two-compartment models in ex vivo mouse heart [75], and likely underestimate the cell volume fraction. This may arise from the presence of sheetlet gaps, cell dispersion, permeability and relaxation effects that were not explicitly modeled. The lower hindered diffusivities Dh observed in pig hearts cannot be explained only by lower temperature. This could be a consequence of handling and storage before the hearts were obtained from the butcher. Lower RMSE values for the pig hearts reflect a comparably better fitting of the hindered-restricted model, which could potentially be associated with higher restricted signal fractions or with a more optimal range of diffusion encoding times used on the clinical scanner. Interestingly, the M0 waveforms and the longer encoding time used on the clinical scanner (Figure 5) appears to be advantageous for detecting the inferred relatively large cells. Indeed, using only the subset of data from the clinical scanner, employing waveforms with the longest encoding times (67 ms), yields similar results as from the entire dataset.
A small tendency toward negative fit residuals observed from LTE data (Figure 5) could potentially be a consequence of diffusion anisotropy, which causes higher signals for LTE compared to STE at larger b-values leading to negatively biased MD values. On the preclinical scanner, b-values up to 2000 s/mm2 could be reached with M2 waveforms and the echo-time of 34.8 ms (encoding time of 24 ms). At this range of b-values, deviations between STE and LTE rotation-average signals attributed to microscopic anisotropy can be seen (Figure 6A). Although the deviations are small, indicating small anisotropy, they are well above noise.
We remark that multi-exponential signal attenuation is not necessarily related to microscopic anisotropy and could arise due to distribution of diffusivities within a voxel. To reiterate, microscopic anisotropy can only be disentangled from the isotropic diffusion variance by varying b-tensor shape. Presence of anisotropy can be inferred from the experimental results in Figure 6. Similar MD values were measured for LTE1 and LTE2 and the relatively lower values for LTE3. These MD differences are consistent with the differences in encoding power spectra (Figure 2). Since the LTEs where constructed from individual channels of the STE, the observed MD differences are related to spectral anisotropy of STE [50,58]. Even though the MD values are higher for LTE1 and LTE2 compared to STE, the signals at higher b-values are clearly less attenuated for LTE compared to STE. This could only be explained by anisotropic diffusion.
Simulation results (Figure 8) mimic well the experimental observations and thus also suggest the presence of anisotropy. These results clearly illustrate the need for careful tuning of STE and LTE in microscopic anisotropy measurements. Comparably larger signal deviations could be observed in fixed monkey brain tissue [48] using velocity compensated qMAS STE and tuned/detuned LTEs. As suggested previously, we speculate that the prominent sensitivity to TDD in the heart could also be used to probe correlations between cell sizes and anisotropy by combining tuned and detuned encoding while also varying b-tensor shape.
Internal or “background” magnetic field gradients may arise for example due to heterogeneous magnetic susceptibility within the tissue, which would be exacerbated at higher external fields. Coupling between the encoding gradients and background gradients give rise to undesired “cross-terms” [76], which are a well-known source of potential bias in the quantification of MD and other DTI metrics as well as kurtosis [77]. Effects of the cross-terms can be corrected or estimated by employing encoding pairs along antipodal directions [76,78,79]. A novel encoding waveform design strategy for eliminating or minimizing the cross-terms has been recently proposed, which can be applied to tensor-valued encoding sequences with arbitrary configurations of RF pulses [80]. The effect is quantified in terms of the “cross-term sensitivity” index. We report this index for the employed encodings in the Supplementary Figure S3. The cross-term sensitivity varies significantly and is relatively low or nulled for M0-LTE1, M0-LTE2, M1-LTE2, M1-LTE3, M2-LTE1 and M2-LTE2. Note that the cross-term sensitivity is largely affected by the encoding gradient symmetry around the refocusing pulse. The sensitivity is commonly lower for motion compensated encoding and for waveforms with more encoding power at higher frequencies, as can also be seen in our analysis (Supplementary Figure S3). To further assess the effect of background gradients, we have simulated signals for randomly oriented cylinders (as in Figure 8) in the presence of relatively strong background gradients (3, 10 and 30 mT/m) applied in 50 evenly distributed directions (Supplementary Figure S4). In addition, we have considered an example of isotropic Gaussian diffusion (Supplementary Figure S5), similar as presented by Szczepankiewicz and Sjölund [80]. The effects of background gradients decrease with increasing degree of motion compensation and they are expected to be negligible for our M1 and M2 encodings even at relatively strong background gradient magnitudes. This is however not a general conclusion, since cross-term sensitivity also depends on the configuration of RF pulses. Importantly, the differences between the rotation-averaged signals due to time-dependent anisotropic diffusion are expected to remain prominent for our encoding also in the presence of background gradients. Given stronger fields and gradients on preclinical systems, the effect of cross-terms at equal b-values is generally lower in preclinical compared to clinical MRI (see Supplementary for details).
The differential size sensitivity, given by the difference between cumulative encoding powers of different waveforms as a function of frequency (Figure 2), provides a probe into diffusion spectrum characteristic for TDD. The differential sensitivity is manifested in the measured signal differences yielding different MD values, thus enabling estimation of cell sizes. This is shown in Figure 7 as a function of
Interestingly, even though the differential size sensitivity is independent of the biophysical model, it reflects well the size ranges shown in Figures 9, 10 for simulations of diffusion in cylindrical restrictions as well as for eccentric cylinders (Figure 12) and spheroidal pores (Figure 13) probed by the preclinical waveforms. To enable comparison of encodings with different durations τ, the relative size scale
Figure 8 illustrates two potentially competing sources of MD bias, i.e., anisotropy and TDD, based on calculations for randomly oriented impermeable cylinders. While the effect of anisotropy is dominant for small sizes, effects of TDD prevail for larger sizes. TDD causes signal differences for differently tuned encodings at low b-values and affects apparent anisotropic diffusion variances from LTEs at higher b-values. In the limit of large sizes, the signal attenuation becomes mono-exponential. Comparison of these calculations and the measured signal attenuations (Figure 6) suggest that our simple model can indeed quite adequately predict signals at higher b-values. However, one possibility to improve our model would be to introduce size dispersion. This would yield multi-exponential signal decay, since mostly signal from smaller cells would contribute to the attenuation at larger b-values. Another important factor to consider is molecular exchange, which could homogenize the system, leading from a multi-compartment towards a mono-compartment scenario, characterized by a strong intrinsic kurtosis [12,51]. In the case of effective compartmental mixing, the Gaussian approximation of cumulant expansion used in our calculations could become invalid in the range of higher b-values [81, 82]. However, we still expect our predictions of MD, estimated from low b-values, to be valid, while tuning of different waveforms will impact signals both at low and high b-values. In light of the multi-exponential signal decay observed experimentally (Figure 6), the results of our noise simulations (Figures 10–13) might be considered rather conservative in terms of SNR, i.e. skewed towards higher SNR, but more elaborate biophysical models would be needed to assess the contrast-to-noise ratio more accurately.
In this study we have developed a novel theoretical framework to predict the effects of time-dependent diffusion (TDD) in tensor-valued encoding using arbitrary gradient waveforms. The theory can be used to predict bias in measurements of apparent mean diffusivities (MD) and estimate cell sizes. To asses accessible ranges for detecting diffusion restricted in simple anisotropic geometries, we have performed noise simulations using various encoding schemes. The theory was applied on experimental data from ex vivo hearts using linear and spherical tensor encoding (LTE and STE) with simultaneous nulling of concomitant fields and all gradient moments up to progressively higher orders (M0, M1, M2). Furthermore, to prepare for in vivo measurements of microscopic anisotropy, we have assessed the feasibility and limitations of acceleration compensated LTE and STE at high b-values.
The presented theoretical framework is based on the frequency-domain analysis of tensor-valued diffusion encoding with arbitrary gradient waveforms, which, in contrast to the narrow gradient pulses, encode diffusion at a wide range of diffusion times. The sensitivity to TDD can be effectively gauged by the encoding power spectra. Our experimental results confirm that the spectral trace (the tuning handle) is the key encoding feature needed to predict apparent MD due to the effects of time-dependent anisotropic diffusion. Furthermore, our results indicate that proper tuning is necessary also for unbiased assessment of microscopic anisotropy in the heart when using variable b-tensor shapes, as for example in q-space trajectory imagining. As has been previously demonstrated, almost perfect tuning could be achieved with qMAS encoding, exemplified by overlapping signals at high b-values from LTE and STE in isotropic yeast cells [48]. However, the tuning was much less favourable in the encoding applied in this study. We believe that achieving good tuning is both feasible and necessary for microstructure assessment, particularly when quantifying low anisotropies at short encoding times (high frequencies). The goal of achieving ideal tuning will be a subject of future work.
The simple two-compartment hindered-restricted diffusion model yields cell size estimates that are consistent across mouse and pig hearts measured on preclinical and clinical scanners and correspond well to cells sizes in the human heart. However, revised biophysical models would be needed to accurately predict signals at higher b-values. Such models may require including size polydispersity, effects of exchange, and considering signal attenuation beyond Gaussian phase approximation. Furthermore, no histological images were acquired in this study, which could provide valuable validation and additional information needed for more realistic tissue modelling.
In conclusion, our pilot ex vivo experiments are a first step toward a range of potential applications employing motion compensated tensor-valued encoding in vivo. We have demonstrated strong and predictable TDD effects in the myocardium. Our results are important for unbiased MD and microscopic anisotropy assessment. The presented theoretical framework could be employed in future optimizations of diffusion encoding protocols. We are therefore encouraged to further explore applications of MD and microscopic anisotropy assessment both ex vivo and in vivo on healthy and diseased hearts.
Data, fitting and simulation code is publicly available at https://doi.org/10.5518/1094. Stay on the beat with tensor-valued encoding [Dataset and Code]: https://doi.org/10.5518/1094.
The animal study was reviewed and approved by University of Leeds Animal Welfare and Ethical Review Committee.
Theory by SL and HL, experiment design, data analysis and manuscript writing by SL, IT, HL, simulations by SL, sample preparation by IT, NY, MRI data acquisition by MB, FS, IT, critical review of manuscript by All.
This project has received funding from the European Research Council (ERC) under the European Union’s Horizon 2020 research and innovation programme (grant agreement No 804746). This work was supported by the British Heart Foundation, United Kingdom (PG/19/1/34076, SI/14/1/30718). SL is supported by Random Walk Imaging. Random Walk Imaging was not involved in the study design, collection, analysis, interpretation of data, the writing of this article or the decision to submit it for publication.
SL was employed by Random Walk Imaging. SL and MN are shareholders in Random Walk Imaging, which holds patents related to this work (WO 2013/165312, WO 2015/119569, WO 2018/088954, WO 2018/088955, WO 2020/218966, WO 2019/050462). SL, FS, MN, IT and HL are inventors on the related patents.
The remaining authors declare that the research was conducted in the absence of any commercial or financial relationships that could be construed as a potential conflict of interest.
All claims expressed in this article are solely those of the authors and do not necessarily represent those of their affiliated organizations, or those of the publisher, the editors and the reviewers. Any product that may be evaluated in this article, or claim that may be made by its manufacturer, is not guaranteed or endorsed by the publisher.
We wish to acknowledge Leah Khazin, Joanna Koch-Paszkowski and Beata Wereszczyńska for their help with sample preparation.
The Supplementary Material for this article can be found online at: https://www.frontiersin.org/articles/10.3389/fphy.2022.812115/full#supplementary-material
1Errata for Ref. [50]: Eq. 2.108 is missing ω2 term and the definition of effective size sensitivity after Eq. 2.155 is missing 4-th power in
2Code for generating motion compensated b-tensor encoding waveforms.
3Diffusion Coefficients of Water.
4“Good tuning” reflects similar encoding power distribution in the frequency range where diffusion spectrum varies most with frequency, consequently yielding similar apparent MD values.
1. Basser PJ, Mattiello J, LeBihan D. MR Diffusion Tensor Spectroscopy and Imaging. Biophysical J (1994) 66:259–67. doi:10.1016/S0006-3495(94)80775-1
2. Wu M-T, Tseng W-YI, Su M-YM, Liu C-P, Chiou K-R, Wedeen VJ, et al. Diffusion Tensor Magnetic Resonance Imaging Mapping the Fiber Architecture Remodeling in Human Myocardium after Infarction. Circulation (2006) 114:1036–45. doi:10.1161/CIRCULATIONAHA.105.545863
3. Tseng W-YI, Dou J, Reese TG, Wedeen VJ. Imaging Myocardial Fiber Disarray and Intramural Strain Hypokinesis in Hypertrophic Cardiomyopathy with MRI. J Magn Reson Imaging (2006) 23:1–8. doi:10.1002/jmri.20473
4. Nguyen C, Lu M, Fan Z, Bi X, Kellman P, Zhao S, et al. Contrast-free Detection of Myocardial Fibrosis in Hypertrophic Cardiomyopathy Patients with Diffusion-Weighted Cardiovascular Magnetic Resonance. J Cardiovasc Magn Reson (2015) 17:1–7. doi:10.1186/s12968-015-0214-1
5. Abdullah OM, Drakos SG, Diakos NA, Wever-Pinzon O, Kfoury AG, Stehlik J, et al. Characterization of Diffuse Fibrosis in the Failing Human Heart via Diffusion Tensor Imaging and Quantitative Histological Validation. NMR Biomed (2014) 27:1378–86. doi:10.1002/nbm.3200
6. Lasič S, Szczepankiewicz F, Eriksson S, Nilsson M, Topgaard D. Microanisotropy Imaging: Quantification of Microscopic Diffusion Anisotropy and Orientational Order Parameter by Diffusion MRI with Magic-Angle Spinning of the Q-Vector. Front Phys (2014) 2:1–14. doi:10.3389/fphy.2014.00011
7. Szczepankiewicz F, Lasič S, van Westen D, Sundgren PC, Englund E, Westin C-F, et al. Quantification of Microscopic Diffusion Anisotropy Disentangles Effects of Orientation Dispersion from Microstructure: Applications in Healthy Volunteers and in Brain Tumors. NeuroImage (2015) 104:241–52. doi:10.1016/j.neuroimage.2014.09.057
8. Eriksson S, Lasič S, Nilsson M, Westin C-F, Topgaard D. NMR Diffusion-Encoding with Axial Symmetry and Variable Anisotropy: Distinguishing between Prolate and Oblate Microscopic Diffusion Tensors with Unknown Orientation Distribution. J Chem Phys (2015) 142:104201. doi:10.1063/1.4913502
9. Westin C-F, Knutsson H, Pasternak O, Szczepankiewicz F, Özarslan E, van Westen D, et al. Q-space Trajectory Imaging for Multidimensional Diffusion MRI of the Human Brain. Neuroimage (2016) 135:345–62. doi:10.1016/j.neuroimage.2016.02.039
10. Szczepankiewicz F, van Westen D, Englund E, Westin C-F, Ståhlberg F, Lätt J, et al. The Link between Diffusion MRI and Tumor Heterogeneity: Mapping Cell Eccentricity and Density by Diffusional Variance Decomposition (DIVIDE). NeuroImage (2016) 142:522–32. doi:10.1016/j.neuroimage.2016.07.038
11. Topgaard D. Multidimensional Diffusion MRI. J Magn Reson (2017) 275:98–113. doi:10.1016/j.jmr.2016.12.007
12. Topgaard D. NMR Methods for Studying Microscopic Diffusion Anisotropy. In: R Valiullin, editor. Diffusion NMR of Confined Systems: Fluid Transport in Porous Solids and Heterogeneous Materials, New Developments In NMR No. 9. Cambridge, United Kingdom: Royal Society of Chemistry (2017).
13. Topgaard D. Diffusion Tensor Distribution Imaging. NMR Biomed (2019) 32:e4066–12. doi:10.1002/nbm.4066
14. Szczepankiewicz F, Westin CF, Nilsson M. Maxwell‐compensated Design of Asymmetric Gradient Waveforms for Tensor‐valued Diffusion Encoding. Magn Reson Med (2019) 82:1424–37. doi:10.1002/mrm.27828
15. Nilsson M, Szczepankiewicz F, Brabec J, Taylor M, Westin CF, Golby A, et al. Tensor‐valued Diffusion MRI in under 3 minutes: an Initial Survey of Microscopic Anisotropy and Tissue Heterogeneity in Intracranial Tumors. Magn Reson Med (2020) 83:608–20. doi:10.1002/mrm.27959
16. de Almeida Martins JP, Tax CMW, Reymbaut A, Szczepankiewicz F, Chamberland M, Jones DK, et al. Computing and Visualising Intra‐voxel Orientation‐specific Relaxation-Diffusion Features in the Human Brain. Hum Brain Mapp (2020) 42:310–28. doi:10.1002/hbm.25224
17. Cory DG, Garrow AN. Measurement of Translational Displacement Probabilities by NMR: An Indicator of Compartmentation. Magn Reson Med (1990) 14:435–44. doi:10.1002/mrm.1910140303
18. Wong EC, Cox RW, Song AW. Optimized Isotropic Diffusion Weighting. Magn Reson Med (1995) 34:139–43. doi:10.1002/mrm.1910340202
19. Mori S, Van Zijl PCM. Diffusion Weighting by the Trace of the Diffusion Tensor within a Single Scan. Magn Reson Med (1995) 33:41–52. doi:10.1002/mrm.1910330107
20. Eriksson S, Lasic S, Topgaard D. Isotropic Diffusion Weighting in PGSE NMR by Magic-Angle Spinning of the Q-Vector. J Magn Reson (2013) 226:13–8. doi:10.1016/j.jmr.2012.10.015
21. de Graaf RA, Nicolay K, Nicolay K. Single-shot Diffusion trace1H NMR Spectroscopy. Magn Reson Med (2001) 45:741–8. doi:10.1002/mrm.1101
22. Valette J, Giraudeau C, Marchadour C, Djemai B, Geffroy F, Ghaly MA, et al. A New Sequence for Single-Shot Diffusion-Weighted NMR Spectroscopy by the Trace of the Diffusion Tensor. Magn Reson Med (2012) 68:1705–12. doi:10.1002/mrm.24193
23. Jespersen SN, Lundell H, Sønderby CK, Dyrby TB. Orientationally Invariant Metrics of Apparent Compartment Eccentricity from Double Pulsed Field Gradient Diffusion Experiments. NMR Biomed (2013) 26:1647–62. doi:10.1002/nbm.2999
24. Andersen KW, Lasič S, Lundell H, Nilsson M, Topgaard D, Sellebjerg F, et al. Disentangling white-matter Damage from Physiological Fibre Orientation Dispersion in Multiple Sclerosis. Brain Commun (2020) 2. doi:10.1093/braincomms/fcaa077
25. Lampinen B, Zampeli A, Björkman‐Burtscher IM, Szczepankiewicz F, Källén K, Compagno Strandberg M, et al. Tensor‐valued Diffusion MRI Differentiates Cortex and white Matter in Malformations of Cortical Development Associated with Epilepsy. Epilepsia (2020) 61:1701–13. doi:10.1111/epi.16605
26. Li S, Zheng Y, Sun W, Lasič S, Szczepankiewicz F, Wei Q, et al. Glioma Grading, Molecular Feature Classification, and Microstructural Characterization Using MR Diffusional Variance Decomposition (DIVIDE) Imaging. Eur Radiol (2021) 31:8197–207. doi:10.1007/s00330-021-07959-x
27. Nery F, Szczepankiewicz F, Kerkelä L, Hall MG, Kaden E, Gordon I, et al. In Vivo demonstration of Microscopic Anisotropy in the Human Kidney Using Multidimensional Diffusion MRI. Magn Reson Med (2019) 82:2160–8. doi:10.1002/mrm.27869
28. Langbein BJ, Szczepankiewicz F, Westin C-F, Bay C, Maier SE, Kibel AS, et al. A Pilot Study of Multidimensional Diffusion MRI for Assessment of Tissue Heterogeneity in Prostate Cancer. Invest Radiol (2021) 56:845–53. doi:10.1097/rli.0000000000000796
29. Naranjo ID, Reymbaut A, Brynolfsson P, Lo Gullo R, Bryskhe K, Topgaard D, et al. Multidimensional Diffusion Magnetic Resonance Imaging for Characterization of Tissue Microstructure in Breast Cancer Patients: A Prospective Pilot Study. Cancers (2021) 13:1606–17. doi:10.3390/cancers13071606
30. Nilsson M, Eklund G, Szczepankiewicz F, Skorpil M, Bryskhe K, Westin CF, et al. Mapping Prostatic Microscopic Anisotropy Using Linear and Spherical B‐tensor Encoding: A Preliminary Study. Magn Reson Med (2021) 86:2025–33. doi:10.1002/mrm.28856
31. Teh I, Lasič S, Lundell H, Wereszczy B, Budde M, Armellina ED, et al. Multidimensional Diffusion MRI in the Ex Vivo Mouse Heart. Proc 29th Intl Soc Magn Reson Med (2021) 3618.
32. Edelman RR, Gaa J, Wedeen VJ, Loh E, Hare JM, Prasad P, et al. In Vivo measurement of Water Diffusion in the Human Heart. Magn Reson Med (1994) 32:423–8. doi:10.1002/mrm.1910320320
33. Frahm J, Merboldt KD, Hänicke W, Haase A. Stimulated echo Imaging. J Magn Reson (1969) (1985) 64:81–93. doi:10.1016/0022-2364(85)90033-2
34. von Deuster C, Stoeck CT, Genet M, Atkinson D, Kozerke S. Spin echo versus Stimulated echo Diffusion Tensor Imaging of the In Vivo Human Heart. Magn Reson Med (2016) 76:862–72. doi:10.1002/mrm.25998
35. Stoeck CT, Kalinowska A, Von Deuster C, Harmer J, Chan RW, Niemann M, et al. Dual-phase Cardiac Diffusion Tensor Imaging with Strain Correction. PLoS ONE (2014) 9:e107159–12. doi:10.1371/journal.pone.0107159
36. Gamper U, Boesiger P, Kozerke S. Diffusion Imaging of the In Vivo Heart Using Spin Echoes-Considerations on Bulk Motion Sensitivity. Magn Reson Med (2007) 57:331–7. doi:10.1002/mrm.21127
37. Stoeck CT, Von Deuster C, GeneT M, Atkinson D, Kozerke S. Second-order Motion-Compensated Spin echo Diffusion Tensor Imaging of the Human Heart. Magn Reson Med (2016) 75:1669–76. doi:10.1002/mrm.25784
38. Welsh CL, Dibella EVR, Hsu EW, Hsu EW. Higher-Order Motion-Compensation for In Vivo Cardiac Diffusion Tensor Imaging in Rats. IEEE Trans Med Imaging (2015) 34:1843–53. doi:10.1109/TMI.2015.2411571
39. Lasič S, Szczepankiewicz F, Dall'Armellina E, Das A, Kelly C, Plein S, et al. Motion‐compensated B‐tensor Encoding for In Vivo Cardiac Diffusion‐weighted Imaging. NMR Biomed (2020) 33:e4213. doi:10.1002/nbm.4213
40. Szczepankiewicz F, Sjölund J, Dall’Armellina E, Plein S, Schneider JE, Teh I, et al. Motion‐compensated Gradient Waveforms for Tensor‐valued Diffusion Encoding by Constrained Numerical Optimization. Magn Reson Med (2021) 85:2117–26. doi:10.1002/mrm.28551
41. Teh I, Schneider JE, Whittington HJ, Dyrby TB, Lundell H. Temporal Diffusion Spectroscopy in the Heart with Oscillating Gradients. Proc Intl Soc Mag Reson Med (2017) 25:3114.
42. Woessner DE. N.M.R. Spin-echo Self-Diffusion Measurements on Fluids Undergoing Restricted Diffusion. J Phys Chem (1963) 67:1365–7. doi:10.1021/j100800a509
43. Stejskal EO, Tanner JE. Spin Diffusion Measurements: Spin Echoes in the Presence of a Time‐Dependent Field Gradient. J Chem Phys (1965) 42:288–92. doi:10.1063/1.1695690
44. Latour LL, Svoboda K, Mitra PP, Sotak CH. Time-dependent Diffusion of Water in a Biological Model System. Proc Natl Acad Sci (1994) 91:1229–33. doi:10.1073/pnas.91.4.1229
46. Parsons EC, Does MD, Gore JC. Modified Oscillating Gradient Pulses for Direct Sampling of the Diffusion Spectrum Suitable for Imaging Sequences. Magn Reson Imaging (2003) 21:279–85. doi:10.1016/S0730-725X(03)00155-3
47. Lundell H, Sønderby CK, Dyrby TB. Diffusion Weighted Imaging with Circularly Polarized Oscillating Gradients. Magn Reson Med (2015) 73:1171–6. doi:10.1002/mrm.25211
48. Lundell H, Nilsson M, Dyrby TB, Parker GJM, Cristinacce PLH, Zhou F-L, et al. Multidimensional Diffusion MRI with Spectrally Modulated Gradients Reveals Unprecedented Microstructural Detail. Sci Rep (2019) 9:1–12. doi:10.1038/s41598-019-45235-7
49. Ianuş A, Jespersen SN, Serradas Duarte T, Alexander DC, Drobnjak I, Shemesh N. Accurate Estimation of Microscopic Diffusion Anisotropy and its Time Dependence in the Mouse Brain. NeuroImage (2018) 183:934–49. doi:10.1016/j.neuroimage.2018.08.034
50. Lundell H, Lasic S. Chapter 2. Diffusion Encoding with General Gradient Waveforms. In: D Topgaard, editor. Advanced Diffusion Encoding Methods in MRI: New Developments in NMR, 24. Cambridge, UK: Royal Society of Chemistry (2020). p. 12–67. doi:10.1039/9781788019910-00012
51. Henriques RN, Jespersen SN, Shemesh N. Correlation Tensor Magnetic Resonance Imaging. NeuroImage (2020) 211:116605. doi:10.1016/j.neuroimage.2020.116605
52. Henriques RN, Palombo M, Jespersen SN, Shemesh N, Lundell H, Ianuş A. Double Diffusion Encoding and Applications for Biomedical Imaging. J Neurosci Methods (2020) 2020:108989. doi:10.1016/j.jneumeth.2020.108989
53. Westin C-F, Szczepankiewicz F, Pasternak O, Özarslan E, Topgaard D, Knutsson H, et al. Measurement Tensors in Diffusion MRI: Generalizing the Concept of Diffusion Encoding. Med Image Comput Comput Assist Interv (2014) 17:209–16. doi:10.1007/978-3-319-10443-0_27
54. Nilsson M, Szczepankiewicz F, Lampinen B, Ahlgren A, de Almeida Martins JP, Lasič S, et al. An Open-Source Framework for Analysis of Multidimensional Diffusion MRI Data Implemented in MATLAB. Proc Intl Soc Mag Reson Med (2018) 26:5355.
55. Topgaard D. Multiple Dimensions for Random Walks. J Magn Reson (2019) 306:150–4. doi:10.1016/j.jmr.2019.07.024
56. Lundell H, Nilsson M, Westin C-F, Topgaard D, Lasič S. Spectral Anisotropy in Multidimensional Diffusion Encoding. Proc Intl Soc Mag Reson Med (2018) 26:0887.
57. Szczepankiewicz F, Lasic S, Nilsson M, Lundell H, Westin C-F, Topgaard D. Is Spherical Diffusion Encoding Rotation Invariant? an Investigation of Diffusion Time- Dependence in the Healthy Brain. Proc Intl Soc Mag Reson Med (2019) 27:0223.
58. Lasič S, Szczepankiewicz F, Nilsson M, Dyrby TB, Lundell H. The Spectral Tilt Plot (STP) - New Microstructure Signatures from Spectrally Anisotropic B-Tensor Encoding. Proc 29th Intl Soc Magn Reson Med (2021) 0297. doi:10.1002/mrm.27959
59. Lasič S, Lundell H. Tissue Microstructure by Ellipsoidal Tensor Encoding with Independently Varying Spectral Anisotropy and Tuning. Proc 29th Intl Soc Magn Reson Med (2021) 2459. doi:10.1002/mrm.27959
60. De Swiet TM, Mitra PP. Possible Systematic Errors in Single-Shot Measurements of the Trace of the Diffusion Tensor. J Magn Reson Ser B (1996) 111:15–22. doi:10.1006/jmrb.1996.0055
61. Jespersen SN, Olesen JL, Ianuş A, Shemesh N. Effects of Nongaussian Diffusion on "isotropic Diffusion" Measurements: An Ex-Vivo Microimaging and Simulation Study. J Magn Reson (2019) 300:84–94. doi:10.1016/j.jmr.2019.01.007
62. Lasič S, Åslund I, Topgaard D. Spectral Characterization of Diffusion with Chemical Shift Resolution: Highly Concentrated Water-In-Oil Emulsion. J Magn Reson (2009) 199:166–72. doi:10.1016/j.jmr.2009.04.014
63. Nilsson M, Lasič S, Drobnjak I, Topgaard D, Westin C-F. Resolution Limit of cylinder Diameter Estimation by Diffusion MRI: The Impact of Gradient Waveform and Orientation Dispersion. NMR Biomed (2017) 30:e3711–13. doi:10.1002/nbm.3711
64. Szczepankiewicz F, Sjölund J, Ståhlberg F, Lätt J, Nilsson M. Tensor-valued Diffusion Encoding for Diffusional Variance Decomposition (DIVIDE): Technical Feasibility in Clinical MRI Systems. PLoS ONE (2019) 14:e0214238–20. doi:10.1371/journal.pone.0214238
65. Nielsen JS, Dyrby TB, Lundell H. Magnetic Resonance Temporal Diffusion Tensor Spectroscopy of Disordered Anisotropic Tissue. Sci Rep (2018) 8. doi:10.1038/s41598-018-19475-y
66. Gräf M, Potts D. Sampling Sets and Quadrature Formulae on the Rotation Group. Numer Funct Anal Optimization (2009) 30:665–88. doi:10.1080/01630560903163508
67. Aliotta E, Wu HH, Ennis DB. Convex Optimized Diffusion Encoding ( CODE ) Gradient Waveforms for Minimum echo Time and Bulk Motion-Compensated Diffusion‐weighted MRI. Magn Reson Med (2017) 77:717–29. doi:10.1002/mrm.26166
68. Sjölund J, Szczepankiewicz F, Nilsson M, Topgaard D, Westin C-F, Knutsson H. Constrained Optimization of Gradient Waveforms for Generalized Diffusion Encoding. J Magn Reson (2015) 261:157–68. doi:10.1016/j.jmr.2015.10.012
69. Gerdes AM, Kellerman SE, Moore JA, Muffly KE, Clark LC, Reaves PY, et al. Structural Remodeling of Cardiac Myocytes in Patients with Ischemic Cardiomyopathy. Circulation (1992) 86:426–30. doi:10.1161/01.cir.86.2.426
70. Kim S, Chi-Fishman G, Barnett AS, Pierpaoli C. Dependence on Diffusion Time of Apparent Diffusion Tensor of Ex Vivo Calf Tongue and Heart. Magn Reson Med (2005) 54:1387–96. doi:10.1002/mrm.20676
71. Du Y, Plante E, Janicki JS, Brower GL. Temporal Evaluation of Cardiac Myocyte Hypertrophy and Hyperplasia in Male Rats Secondary to Chronic Volume Overload. Am J Pathol (2010) 177:1155–63. doi:10.2353/ajpath.2010.090587
72. Laguens R, Meckert PC, Janavel GV, Valle Hd., Lascano E, Negroni J, et al. Entrance in Mitosis of Adult Cardiomyocytes in Ischemic Pig Hearts after Plasmid-Mediated rhVEGF165 Gene Transfer. Gene Ther (2002) 9:1676–81. doi:10.1038/sj.gt.3301844
73. Gadeberg HC, Bond RC, Kong CHT, Chanoit GP, Ascione R, Cannell MB, et al. Heterogeneity of T-Tubules in Pig Hearts. PLoS ONE (2016) 11:e0156862–16. doi:10.1371/journal.pone.0156862
74. Opie LH. Heart Physiology: From Cell to Circulation. 4th ed. Baltimore: Lippincott Williams & Wilkins (2004).:
75. Farzi M, Mcclymont D, Whittington H, Zdora M-C, Khazin L, Lygate CA, et al. Assessing Myocardial Microstructure with Biophysical Models of Diffusion MRI. IEEE Trans Med Imaging (2021) 40:3775–86. doi:10.1109/tmi.2021.3097907
76. Jara H, Wehrli FW. Determination of Background Gradients with Diffusion MR Imaging. J Magn Reson Imaging (1994) 4:787–97. doi:10.1002/jmri.1880040608
77. Palombo M, Gentili S, Bozzali M, Macaluso E, Capuani S. New Insight into the Contrast in Diffusional Kurtosis Images: Does it Depend on Magnetic Susceptibility? Magn Reson Med (2015) 73:2015–24. doi:10.1002/mrm.25308
78. Neeman M, Freyer JP, Sillerud LO. A Simple Method for Obtaining Cross-term-free Images for Diffusion Anisotropy Studies in NMR Microimaging. Magn Reson Med (1991) 21:138–43. doi:10.1002/mrm.1910210117
79. Nair G, Hu XP. Manifestation and Post Hoc Correction of Gradient Cross-Term Artifacts in DTI. Magn Reson Imaging (2012) 30:764–73. doi:10.1016/j.mri.2012.02.021
80. Szczepankiewicz F, Sjölund J. Cross-term-compensated Gradient Waveform Design for Tensor-Valued Diffusion MRI. J Magn Reson (2021) 328:106991. doi:10.1016/j.jmr.2021.106991
81. Ning L, Nilsson M, Lasič S, Westin C-F, Rathi Y. Cumulant Expansions for Measuring Water Exchange Using Diffusion MRI. J Chem Phys (2018) 148:074109. doi:10.1063/1.5014044
Keywords: tensor-valued diffusion encoding, b-tensor, time-dependent restricted diffusion, cardiac MRI, motion compensation, mean diffusivity, microscopic anisotropy, isotropic diffusion weighting
Citation: Lasič S, Yuldasheva N, Szczepankiewicz F, Nilsson M, Budde M, Dall’Armellina E, Schneider JE, Teh I and Lundell H (2022) Stay on the Beat With Tensor-Valued Encoding: Time-Dependent Diffusion and Cell Size Estimation in ex vivo Heart. Front. Phys. 10:812115. doi: 10.3389/fphy.2022.812115
Received: 09 November 2021; Accepted: 15 February 2022;
Published: 25 March 2022.
Edited by:
Jana Hutter, King’s College London, United KingdomReviewed by:
Silvia Capuani, National Research Council (CNR), ItalyCopyright © 2022 Lasič, Yuldasheva, Szczepankiewicz, Nilsson, Budde, Dall’Armellina, Schneider, Teh and Lundell. This is an open-access article distributed under the terms of the Creative Commons Attribution License (CC BY). The use, distribution or reproduction in other forums is permitted, provided the original author(s) and the copyright owner(s) are credited and that the original publication in this journal is cited, in accordance with accepted academic practice. No use, distribution or reproduction is permitted which does not comply with these terms.
*Correspondence: Samo Lasič, c2Ftb2xAZHJjbXIuZGs=
†These authors have contributed equally to this work and share last authorship
Disclaimer: All claims expressed in this article are solely those of the authors and do not necessarily represent those of their affiliated organizations, or those of the publisher, the editors and the reviewers. Any product that may be evaluated in this article or claim that may be made by its manufacturer is not guaranteed or endorsed by the publisher.
Research integrity at Frontiers
Learn more about the work of our research integrity team to safeguard the quality of each article we publish.