- 1School of Mechanical Engineering, Southeast University, Nanjing, China
- 2State Key Laboratory of Mechanics and Control of Mechanical Structures, Nanjing University of Aeronautics and Astronautics, Nanjing, China
As an autonomous mobile robot, the unmanned intelligent vehicle is often installed with sensors to collect the road environment information, and then process the information and control the speed and steering. In this study, vehicle-mounted camera, laser scanning radar and other sensors were equipped to collect real-time environmental information to efficiently process and accurately detect the specific location and shape of the obstacle. This study then investigated the impact of two In-Vehicle Information Systems (IVISS) on both usability and driving safety. Besides, the laser perception sensing technology was applied to transmit the information of the surrounding around the real-time driving area to the vehicle system. Simulating vehicle checkerboard and hierarchical IVIS interface layouts, we also examined their usability based on task completion time, error rate, NASA-TLX, and System Usability Scale (SUS). It was suggested that the results offer a supporting evidence for further design of IVIS interface.
1 Introduction
With the ongoing economic and social development, vehicles on the road have soared dramatically in the recent decades, which created various problems such as traffic congestion, excessive energy consumption, environmental pollution, property damage and heavy casualty, and exposed the conflict between the existing transport infrastructure and the vehicles [1]. Many countries have thus initiated research projects to develop intelligent transportation systems [2] based on the latest technologies in the fields of information, automation, computer and management. Their common goal is to improve the efficiency of vehicles and transportation, enhance safety, minimize environmental pollution and expand the capacity of existing traffic [3]. The research of intelligent vehicle targets to address the abovementioned problems by reducing the human workload in driving tasks with the adoption of new technologies in lane warning monitoring, driver fatigue detection, automatic speed cruise control, etc. [4].
The key technology for driverless intelligent vehicles is the recognition and detection of obstacles [5], and the result of the detection determines the stability and safety of the intelligent vehicle driving [6]. Current obstacle detection methods include vision-based detection, radar-based detection and ultrasonic-based detection [7], which differentiate each other in their detection accuracy. Vision-based detection simply uses vehicle-mounted HD cameras to capture images of obstacles and environments. The exact location of an obstacle can then be calculated according to its position in the image, and its parameter values estimated by the camera. Vision-based detection is robust, allowing real time analysis, but susceptible to light and other external factors [8]. Radar-based detection is just the opposite, having fairly strong resistance to external influences [9]. For example, three-dimensional LIDAR, though expensive, provides three-dimensional information about the obstacle during scanning and imaging, while 2D LIDAR, with a simple and stable system and fast response time, only scans a flat surface [10]. Ultrasound-based detection technology, with low resolution and accuracy, is seriously limited in providing comprehensive boundary data and obtaining environmental information, thus scarcely used in driverless intelligent vehicles [11].
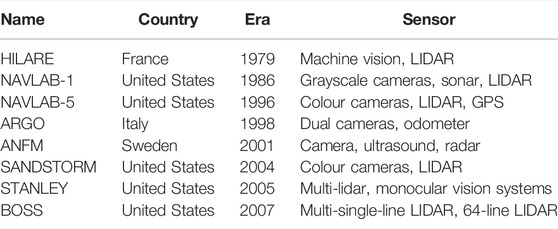
However, there is no one-size-fits-all sensor perfect for obstacle detection by intelligent vehicles [12], although the commonly used sensors in intelligent vehicles contain inertial navigation, laser scanning radar, millimeter wave radar and on-board cameras [13]. Single sensors are unstable and incomprehensive when it comes to obtaining information about their surroundings. They need to complement each other [14], and now multi-sensor-based technology fusion has become a trend in intelligent vehicle research [15], which shows its advantages in obtaining target information, extracting the sensing area and finally completing the detection of obstacles [16]. Currently, convergence-based detection has developed to converge the data of multiple sensors. Reviewing the literature concerning the sensors used in unmanned intelligent vehicles that are developed in different countries as shown in Table 1, we found that the countries had made different trade-offs and improvements in technology selection based on their existing problems. Nevertheless, in China, the technology of this type of sensors still falls behind the developed countries.
In this study, we used a vehicle-mounted camera in conjunction with a laser scanning radar for obstacle recognition and detection [17], and developed a computational model for a theoretical framework to cognize visual and auditory information that allows high-speed real-time computation. This framework converged the information from multiple sensors, including the vision system, the Global Positioning System (GPS), the speed detection system and the laser scanning radar system, and endowed a driverless vehicle platform with natural environment perception and automatic decision-making capabilities in various road conditions. Aiming for the application in the driverless intelligent vehicle platform, this study also expects to achieve 1) autonomous driving along prescribed routes, 2) driving along lanes according to road signs and markings, as well as 3) autonomous obstacle avoidance, acceleration, and deceleration [18].
2 Methods, Experiments and Result Analysis
The collection of information about the external environment is the key to designing an unmanned intelligent vehicle, and the various data collection sensors installed on the vehicle are equivalent to the driver’s eyes [19]. Only the timely and proper acquisition and processing of external environment data can ensure the safe and stable driving [20]. Considering that a single sensor cannot be complete or reliable for external environment information collection, this study thus used two sensors equipped with a laser scanning radar and on-board cameras to detect and recognize obstacles, and combined the data from both sensors, which is conducive to improving the accuracy and reliability of obstacle recognition [21].
2.1 Data Collection and Processing
In this study, the image processing was mainly implemented using the algorithmic functions of OpenCV, which is an open-source computer vision library based on the Open Source Computer Vision Library developed by Intel Corporation. Composed of a series of C functions and some C classes, OpenCV supports the execution of different common algorithms in digital image processing and computer vision systems, which are highly portable and accessible to multiple operating systems without code modification and thus widely used in object recognition, image segmentation and machine vision. Besides, it runs in real time and can be compiled and linked to generate executable programs [22]. The modules of OpenCV adopted in this study are listed as follows:
OpenCV_core: Core functional modules, including basic structures, algorithms, linear algebra, discrete Fourier transforms, etc. OpenCV_imgproc: Image processing module, including filtering, enhancement, morphological processing, etc.
OpenCV_feature2d: 2D feature detection and description module, including image feature value detection, description matching, etc.
OpenCV_video: Video module, including optical flow method, motion templates, target tracking, etc.
OpenCV_objdetect: Target detection modules.
OpenCV_calib3d: 3D module, including camera calibration, stereo matching, etc.
2.2 Multi-Sensor Data Convergence
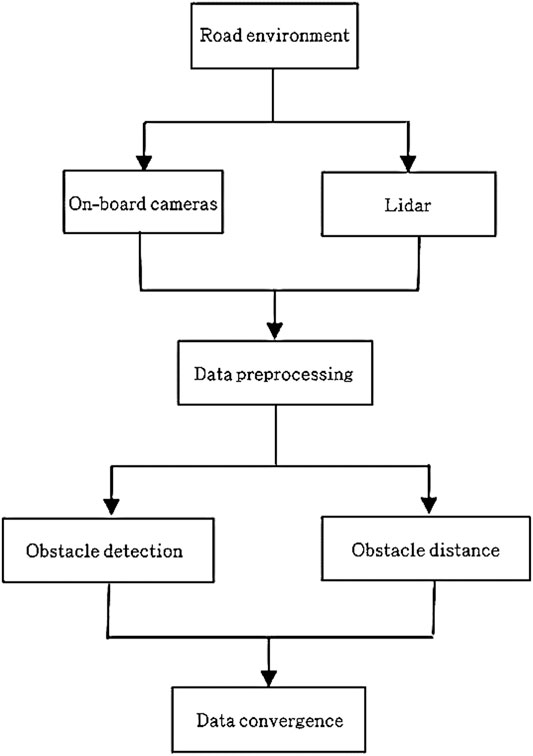
Data convergence from multiple sensors in the research of unmanned intelligent vehicles is a technology for comprehensive analysis, processing and optimisation of the information acquired by multiple sensors [23]. Under certain guidelines, the collected data was integrated, utilized and synthesized in time and space to refine the target information and then improve the control system. Data convergence brings a linkage of each other in a certain way and then the optimization of all the collected data [24]. The process of data convergence is shown in Figure 1.
In this study, laser scanning radar and vehicle-mounted camera sensors were used for obstacle detection, and the information collected by the two sensors was converged and matched in time and space to maintain consistency in the collected data. Data convergence has a number of advantages in intelligent control as follows:
1) Providing the data collected by the whole system with a higher accuracy and reliability;
2) Enabling the system to obtain more information in the same amount of time;
3) Reducing the impact of natural external factors on the multi-sensor system;
4) Accelerating data processing and increasing information reuse.
2.2.1 Principle of Multi-Sensor Data Convergence
To fully utilize the information collected by multiple sensors, and then rationally process and analyze the collected data, this study formulated some principles to converge and match the redundant or complementary information of multiple sensors in space or time. The principles are as follows:
1) Multiple sensors of different types are used to collect data information of the detection target;
2) Feature values are extracted from the output data of the sensors;
3) The extracted feature values (e.g., clustering algorithms, adaptive neural networks or other statistical pattern recognition methods that can transform feature vectors into target attribute judgments, etc.) are processed by pattern recognition to complete the recognition of the target by each sensor;
4) The data from each sensor are converged using data convergence algorithms to maintain consistency in the interpretation and description of the detection target [25].
2.2.2 Multi-Sensor Data Convergence Algorithms
The selection of an effective data convergence method in a study is determined by the specific application context. The frequently-employed methods for multi-sensor data convergence include weighted averaging, Kalman filtering and multi-Bayesian estimation [26].
1) Weighted averaging
The weighted averaging method is the simplest and most intuitive of the algorithms for data convergence. It takes the redundant information provided by a group of sensors and weights the average, with the result being the data convergence value, which is a direct manipulation of the data source.
2) Kalman filtering
The Kalman filtering method is primarily used to converge redundant data from low-level real-time dynamic multi-sensors. The algorithm uses recursion of the statistical properties of the measurement model to determine the optimal convergence and data estimation in a statistical sense. In the model, the dynamical equations, i.e., the state equations [27], are used to describe the dynamics of the detection target. If the dynamical equations are known and the system and sensor errors fit the Gaussian white noise model, the Kalman filter will provide the optimal estimate of the converged data in a statistical sense. The recursive nature of the Kalman filter allows the system to process without the need for extensive data storage and computation.
3) Bayesian estimation
Bayesian estimation is one of the common methods for synthesizing high level information from multiple sensors in a static environment. It enables sensor information to combine according to probabilistic principles, with measurement uncertainties expressed as conditional probabilities. Bayesian estimation is adopted in the case that sensor measurements have to be converged indirectly [28]. Treating each sensor as a Bayesian estimate, Multi Bayesian estimation synthesizes the associated probability distribution of each individual object into a joint posterior probability distribution function. It provides a final fused value of the multi-sensor information by using the likelihood function of the joint distribution function as the minimum and synthesizing the information with a prior model of the environment providing a characterisation of the whole environment.
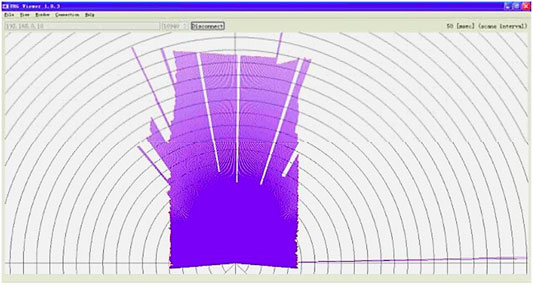
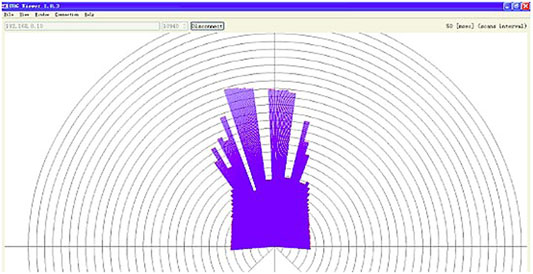
In this study, Bayesian estimation was employed, based on the fact that n sensors of different types were involved to detect the same target. To ensure the target to identify m attributes, we proposed m hypotheses or propositions Ai, i = 1...m. The steps for the implementation of the Bayesian convergence algorithm are explicated as follows (Figures 2–4): Firstly, to n times observe B1, B2...Bn given by n sensors; secondly, to calculate the probability of each sensor’s observation under each hypothesis being true; thirdly, to calculate the posterior probability of each hypothesis being true under multiple observations according to Bayesian formula; finally, to determine the result.
2.3 Radar and Camera Data Matching
2.3.1 Temporal Matching
Temporal matching of data is the process of synchronising the data collected by each sensor. The sampling frequency of different sensors is different, thus causing a variation among the collected data even although synchronously acquired. With the time variable as a parameter, the process of data synchronisation can be completed by granting different GPS times to different sensors, which is featured by a relatively high accuracy convergence of data and a strong impact on the real-time nature of data.
Considering that the sensors selected in this study differ greatly from each other in their sampling frequency, the firstly ensured was the synchronization of the information from LIDAR with that from camera during the data acquisition [29]. Then, two separate data collection threads were produced for the two sensors (the laser scanning radar and the camera) to collect the data from the two sensors at the same interval each time and then synchronise the two sets of data in time, i.e., matching the data.
2.3.2 Spatial Matching
Data matching in space is a multi-level and multi-side processing of the collected data, including the steps of automatic detection, correlation, estimation and combination of data and information from multiple sources. It aims to obtain more reliable and accurate information as well as most reliable information-based decision, i.e., to optimize the value of the target location based on the multi-source observations. Spatial matching of data is to unify the transformation relationship between the sensor coordinate system, image coordinate system and vehicle coordinate system in space. Once the constraint of equations for the camera parameters is removed, the interconversion relationships of the four coordinate systems can be determined, and then the data points scanned by the LIDAR can be projected onto the image coordinate system using the established camera model. Based on the previous theoretical model, the conversion relationship between the point in space p(xs, ys, zs) and the corresponding point in the image coordinate system p(xt, yt) is expressed as:
Where ρ is the distance from the LIDAR laser beam to the spatial point (xs, ys, zs), β is the angle swept by the LIDAR, α is the pitch angle of the LIDAR installation, h is the LIDAR installation height and p is a 3 × 4 matrix. This change allows the data collected by the LIDAR to accurately mirror in the image data space, thus enabling the spatial conversion between the two sets of data.
Spatial matching of data have some advantages. First, it is conducive for the control system to making the most accurate judgment on the specific distance and location of the obstacle. Second, data matching in space facilitates the LIDAR scanned data to converge the image, then to form the target area on the image coordinate system in real time, and finally the recognition of the obstacle [30].
2.4 Radar-Based Obstacle Detection
2.4.1 Radar Data Pre-Processing
UXM-30LX-EW laser scanning radar was employed to pre-process the data in this study. It has the advantages of great detection range, large measuring range, high measurement accuracy and angular resolution. As the range of the laser scanning radar increases, the measurement accuracy will decrease. The scanning plane angle of the LIDAR was set at 190° horizontally, greater than the maximum angle captured by the camera. Unnecessary laser points have to be removed during the data convergence process to ensure the accuracy of the final results. Thus, in this study, we first removed the laser beam falling outside this angle according to the camera’s shooting angle, which accelerates the operating, and then made judgment and analysis using the pre-processed radar data.
2.4.2 Obstacle Detection
The detection and identification of obstacles was performed in this study by the LIDAR installed in the front of the vehicle and the camera on the roof. To ensure the safety in roads, the control system of a vehicle must be able to control the braking or steering in an emergency when an obstacle such as a vehicle and pedestrian is found. However, when the vehicle is turning or travelling in a straight line, the scope for determining the presence of an obstacle in the area in front of the vehicle will change. For example, when a vehicle turns according to the traffic light, the obstacles in the area directly in front of the vehicle are not easy to be detected and thus mistreated, leading to a sharp braking by the driverless intelligent vehicle and even a failure in fulfilling the required tasks such as turning [31]. Hereby, three actual road conditions were analysed and discussed.
1) When an unmanned vehicle is travelling straight ahead
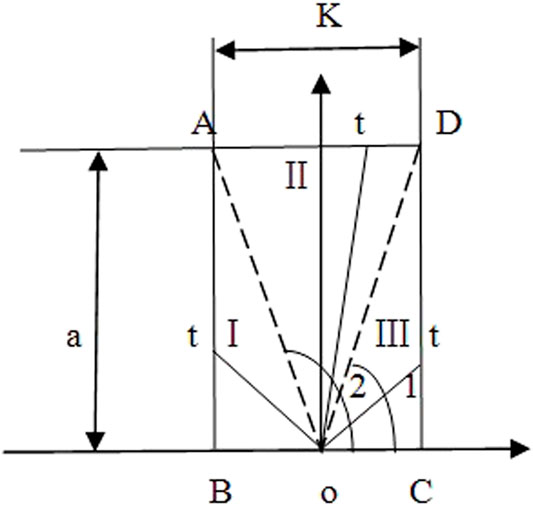
In this situation, the area to be determined in this case is well defined. As shown in Figure 5, a rectangular area with length of a and width of k in front of the vehicle is the detection area, divided into three blocks marked as I, II and III.
2)When no one is turning right
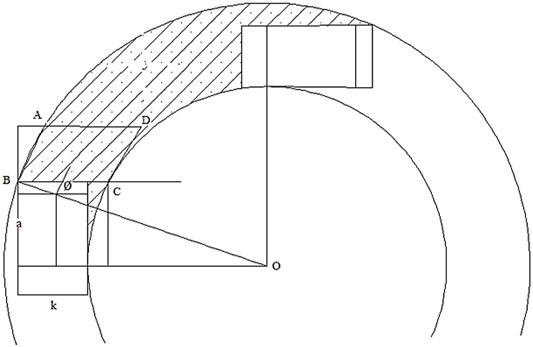
Figure 6 shows the smart car right turn schematic. As is seen, the shaded part of the vehicle is the area through which the steering wheel of the unmanned vehicle turns to the right at a certain angle through an all-round corner, where the sensing area detected by the LiDAR is located. The quadrilateral ABCD was chosen as the sensing area in order to maximise the overlapping area between the sensing area and the shaded area. The distance between AD and BC is marked as s, which on the one hand determines the size of the shaded area, and on the other hand is a function of the speed (marked as v) and determined by it, i.e., s = f (v). Thus, it can be concluded that the shape of the quadrilateral ABCD obtained varies with the angle of rotation of the front wheels, and the area of this quadrilateral is the manifestation of the function of the speed and the angle of rotation of the front wheels.
2.5 Camera-Based Vision Detection of Obstacles
2.5.1 Image Data Preprocessing
During the capture and transmission of images, the data signal is very susceptible to the external environment, which brings image noise, variations in the quality of the captured images, and finally a direct influence on the recognition of obstacles and the convergence of other data. Therefore, the captured image in this study was pre-processed, such as image denoising, to provide a clear depiction of the real road conditions and then improve the accuracy of the obstacle detection recognition. The main methods for image pre-processing adopted in this process include image greyscaling, image denoising, image segmentation and the application of image morphology [32], for noise removal in image processing neighbourhood averaging, and median filtering, and for image segmentation threshold-based segmentation, region-based growth and merge segmentation, and eigenvalue space clustering-based segmentation.
2.5.2 Identification of Road Environment
Nowadays, the road system is very complicated especially after lane lines marked, thus becoming a great change for the vision system of driverless intelligent vehicles. Road recognition becomes a key to the obstacle detection system of these vehicles. It then necessitates the collection of lane recognition images and the identification of real obstacles in the lanes [33]. Considering this as well as the requirement for a high degree of accuracy in time and obstacle description, this study employed two main algorithms for lane recognition: 1) The overall road surface algorithm, mainly for the entire road surface gray detection and achieved using the area detection method; 2) the lane detection algorithm, achieved through the recognition of the edge or lane separation.
2.5.3 Extraction of Interested Obstacle Areas
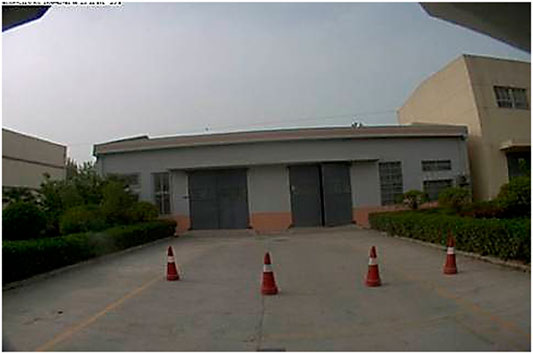
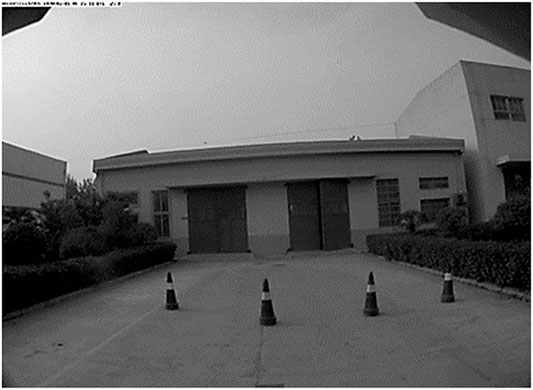
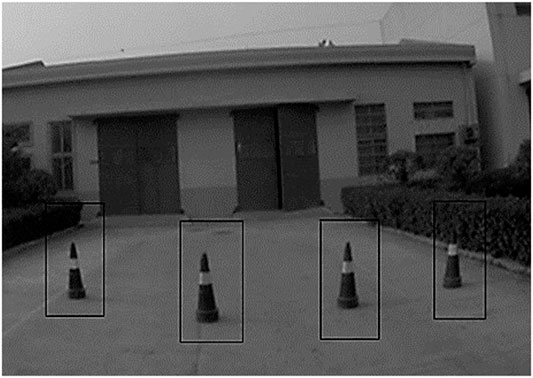
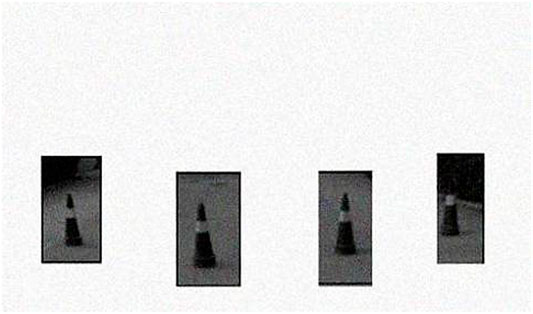
For the images acquired by the camera, we only extracted the sensing area to avoid processing unnecessary parts of the image, then reduce the processing time of the system, and finally ensure the real-time performance of the system. Based on the data transmitted by the LIDAR, a fixed value was set to detect the location of the general area where the cone ahead was located, and the results are shown in Figures 7–9.
2.5.4 Obstacle Detection
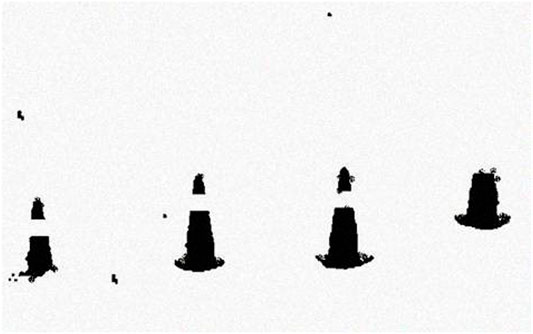
The image segmentation technique is to segment the target from the image and contributed to providing convenience for the subsequent image processing. Spatial eigenvalues were adopted to extract the obstacle from the image during the obstacle detection of the captured by camera. Figure 10 shows the image of the identified obstacle in the sensing area, where the grey scale value of the other parts of the image was placed at 0, and Figure 11 the final results after image segmentation. As is seen in Figure 11, on the edge of the image exist some burrs and unsmooth points. Hereby, the image morphology of the open operation was introduced to remove the burrs and points, and then the region growth segmentation to segment the image, identify the information of the obstacle segmentation and finally recognize the basic information of the real obstacle, as shown in Figure 12. It is noted that when the specific information is detected, the system will transmit it to the planning and decision-making part of the intelligent vehicle, which then will plan a safe route to bypass the recognized obstacle and command the control system to follow the planned.
3 Conclusion
Multi-sensor technology is becoming more efficient, and has been increasingly employed in driverless intelligent vehicles in recent years. Multi-sensor data convergence includes the integration of vision systems with ultrasonic technology and laser scanning radar with vision systems. This technology in the study of unmanned intelligent vehicle obstacle detection effectively solved the problems of insufficient data collection by a single sensor and unstable unmanned intelligent vehicle [33]. OpenCV algorithm functions were proposed to achieve the detection of obstacles as well as the principle and algorithm of multi-sensor data convergence. This paper firstly introduced the method of obstacle identification and detection by laser scanning radar during the process of obstacle detection, including the pre-processing of laser data, and then elaborated the process of obstacle identification based on camera, the acquisition of the pre-processing of images, road recognition and finally detection of lane edges and obstacle detection [34].
The technical approaches to obstacle detection in this study can be summarised as follows: e current commonly used technology in driverless intelligent vehicles: LIDAR-based detection, vision system-based detection, ultrasonic-based detection and multi-sensor-based data convergence detection. The technical solution was proposed to determine according to the actual situation.
1) The multi-sensor data convergence involves the conversion of coordinates and data between sensors. In this study, the vehicle body coordinate system, sensor coordinate system and image coordinate system were designed as three separate coordinate systems, and the interconversion relationship among them was analysed, laying a foundation for the later processes.
2) In the radar obstacle detection, the collected data was firstly pre-processing to eliminate some camera shooting range outside the point, thereby improving the efficiency of the processing. Then, based on the driving condition of the vehicle in straight, left- and right-turn, three situations of the intelligent vehicle in front of the sensing area were discussed to determine the location of the obstacle in the sensing area, which is the preparation for the subsequent obstacle target extraction.
3) In view of the enormousness of the amount of the information contained in the camera-captured images of the road environment, it is a great challenge to reduce the processing time and enhance the efficiency of the system. Thus, in this study image pre-processing was first performed on the collected original pictures, the process of which includes image greyscaling, image denoising and other processing to retain the original information. Besides, the data from the laser scanning radar and the on-board camera were converged temporally and spatially, then the sensing area extracted and the obstacle detection completed in the sensing area, which reduces the amount of and ensures the real-time performance of the algorithm and the robustness of the system.
Based on the above analysis, LIDAR or camera feature oriented data convergence is suggested to realize a more accurate identification and detection of obstacles. Moreover, a joint calibration of the radar and camera and error analysis will be helpful to improve the accuracy of the data acquisition [35, 36].
Data Availability Statement
The raw data supporting the conclusion of this article will be made available by the authors, without undue reservation.
Author Contributions
YW: Conceptualization (lead); writing—original draft (lead); formal analysis (lead); writing—review and editing (equal). YZ: Software (lead); writing—review and editing (equal). HL: Methodology (lead); writing—review and editing (equal).
Conflict of Interest
The authors declare that the research was conducted in the absence of any commercial or financial relationships that could be construed as a potential conflict of interest.
Publisher’s Note
All claims expressed in this article are solely those of the authors and do not necessarily represent those of their affiliated organizations, or those of the publisher, the editors and the reviewers. Any product that may be evaluated in this article, or claim that may be made by its manufacturer, is not guaranteed or endorsed by the publisher.
References
1. Mitsopoulos-Rubens E, Trotter MJ, Lenné MG. Effects on Driving Performance of Interacting with an In-Vehicle Music Player: a Comparison of Three Interface Layout Concepts for Information Presentation. Appl Ergon (2011) 42:583–91. doi:10.1016/j.apergo.2010.08.017
2. Kim H, Song H. Evaluation of the Safety and Usability of Touch Gestures in Operating In-Vehicle Information Systems with Visual Occlusion. Appl Ergon (2014) 45:789–98. doi:10.1016/j.apergo.2013.10.013
3. Cockburn A, Mckenzie B. 3D or Not 3D? Evaluating the Effect of the Third Dimension in a Document Management System. In Proceeding of the CHI 2001: Conference on Human Factors in Computing Systems, Seattle, WA, USA, March 2001, 2001; pp. 434–41.
4. Broy V, Althoff F, Klinker G. iFlip. A Metaphor for In-Vehicle Information Systems. Working Conf Adv Vis Inter (2006) 42:155–8. doi:10.1145/1133265.1133297
5. Lin C-T, Wu H-C, Chien T-Y. Effects of E-Map Format and Sub-windows on Driving Performance and Glance Behavior when Using an In-Vehicle Navigation System. Int J Ind Ergon (2010) 40:330–6. doi:10.1016/j.ergon.2010.01.010
6. Lavie T, Oron-Gilad T, Meyer J. Aesthetics and Usability of In-Vehicle Navigation Displays. Int J Human-Computer Stud (2011) 69:80–99. doi:10.1016/j.ijhcs.2010.10.002
7. Maciej J, Vollrath M. Comparison of Manual vs. Speech-Based Interaction with In-Vehicle Information Systems. Accid Anal Prev (2009) 41:924–30. doi:10.1016/j.aap.2009.05.007
8. Wickens CD. An Introduction to Human Factors Engineering. Qual Saf Health Care (2004) 11:393. doi:10.3969/j.issn.1004-3810.2008.z1.001
9. Horrey WJ, Wickens CD. Multiple Resource Modeling of Task Interference in Vehicle Control, hazard Awareness and In-Vehicle Task Performance. Proceeding of the Driving Assessment: the Second International Driving Symposium on Human Factors in Driver Assessment Training & Vehicle Design 2003. January 2003, 2003; pp. 7–12.
10. Tsimhoni O, Smith D, Green P. Address Entry while Driving: Speech Recognition versus a Touch-Screen Keyboard. Hum Factors (2004) 46:600–10. doi:10.1518/hfes.46.4.600.56813
11. Sodnik J, Dicke C, Tomažič S, Billinghurst M. A User Study of Auditory versus Visual Interfaces for Use while Driving. Int J Human-Computer Stud (2008) 66:318–32. doi:10.1016/j.ijhcs.2007.11.001
12. Salmon PM, Young KL, Regan MA. Distraction 'on the Buses': A Novel Framework of Ergonomics Methods for Identifying Sources and Effects of Bus Driver Distraction. Appl Ergon (2011) 42:602–10. doi:10.1016/j.apergo.2010.07.007
13. Ziefle M. Information Presentation in Small Screen Devices: the Trade-Off between Visual Density and Menu Foresight. Appl Ergon (2010) 41:719–30. doi:10.1016/j.apergo.2010.03.001
14. Chen M-S, Lin M-C, Wang C-C, Chang CA. Using HCA and TOPSIS Approaches in Personal Digital Assistant Menu-Icon Interface Design. Int J Ind Ergon (2009) 39:689–702. doi:10.1016/j.ergon.2009.01.010
15. Foley J. SAE Recommended Practice Navigation and Route Guidance Function Accessibility while Driving (SAE 2364). Warrendale, PA, USA: Society of Automotive Engineers (2000). p. 11.
16. Green P. Visual and Task Demands of Driver Information Systems. Driver Inf Syst (1999) 41:517–31. doi:10.1109/LSENS.1999.2810093
17. Soukoreff RW, Mackenzie IS. Metrics for Text Entry Research: an Evaluation of MSD and KSPC, and a New Unified Error Metric. Proceeding of the Conference on Human Factors in Computing Systems, CHI 2003, Ft. Lauderdale, Florida, USA, April 2003, 2003; pp. 113–20.
18. Svenson O, Patten CJD. Mobile Phones and Driving: a Review of Contemporary Research. Cogn Tech Work (2005) 7:182–97. doi:10.1007/s10111-005-0185-3
19. Hart SG, Staveland LE. Development of NASA-TLX (Task Load Index): Results of Empirical and Theoretical Research. Hum Ment Workload (1988) 19:18–24. doi:10.1016/s0166-4115(08)62386-9
20. Brooke J. Sus-a Quick and Dirty Usability Scale. Usability Eval Industry (1996) 16:189–93. doi:10.4271/1996-01-1601
21. Dingus TA. Empirical Data Needs in Support of Model Building and Benefits Estimation. In: Modeling ITS Collision Avoidance System Benefits: Expert Panel Proceedings. Washington, DC: Intelligent Transportation Society of America (1997).
22. Tijerina L. Issues in the Evaluation of Driver Distraction Associated with In-Vehicle Information and Telecommunications Systems. Transportation Res Inc (2000) 32:42–4. doi:10.17845/156265.095643
23. Stanton NA. Advances in Human Aspects of Road and Rail Transportation. Highw Saf (2012) 12:32–9. doi:10.1260/916720.800753
24. Brookhuis KA, de Vries G, de Waard D. The Effects of mobile Telephoning on Driving Performance. Accid Anal Prev (1991) 23:309–16. doi:10.1016/0001-4575(91)90008-s
25. Causse M, Alonso R, Vachon F, Parise R, Orliaguet JP, Tremblay S, et al. Testing Usability and Trainability of Indirect Touch Interaction: Perspective for the Next Generation of Air Traffic Control Systems. Ergonomics (2014) 57:1616–27. doi:10.1080/00140139.2014.940400
26. Bhise VD, Bhardwaj S. Comparison of Driver Behavior and Performance in Two Driving Simulators. Detroit, United States: SAE World Congress and Exhibition (2008).
27. Lewis JR. Usability Testing. In: Handbook of Human Factors and Ergonomics (2006). p. 1275–316. doi:10.1002/0470048204.ch49
28. Zviran M, Glezer C, Avni I. User Satisfaction from Commercial Web Sites: The Effect of Design and Use. Inf Manag (2006) 43:157–78. doi:10.1016/j.im.2005.04.002
29. Recarte MA, Nunes LM. Mental Workload while Driving: Effects on Visual Search, Discrimination, and Decision Making. J Exp Psychol Appl (2003) 9:119–37. doi:10.1037/1076-898x.9.2.119
30. Reyes ML, Lee JD. Effects of Cognitive Load Presence and Duration on Driver Eye Movements and Event Detection Performance. Transportation Res F: Traffic Psychol Behav (2008) 11:391–402. doi:10.1016/j.trf.2008.03.004
31. Salmon PM, Lenné MG, Triggs T, Goode N, Cornelissen M, Demczuk V. The Effects of Motion on In-Vehicle Touch Screen System Operation: a Battle Management System Case Study. Transportation Res Part F: Traffic Psychol Behav (2011) 14:494–503. doi:10.1016/j.trf.2011.08.002
32. Metz B, Landau A, Just M. Frequency of Secondary Tasks in Driving - Results from Naturalistic Driving Data. Saf Sci (2014) 68:195–203. doi:10.1016/j.ssci.2014.04.002
33. Akyeampong J, Udoka S, Caruso G, Bordegoni M. Evaluation of Hydraulic Excavator Human-Machine Interface Concepts Using NASA TLX. Int J Ind Ergon (2014) 44:374–82. doi:10.1016/j.ergon.2013.12.002
34. Xian H, Jin L, Hou H, Niu Q, Lv H. Analyzing Effects of Pressing Radio Button on Driver’s Visual Cognition. In: Foundations and Practical Applications of Cognitive Systems and Information Processing (2014). p. 69–78. doi:10.1007/978-3-642-37835-5_7
Keywords: smart car, laser radar, camera, obstacle detection, 3D target detection
Citation: Wang Y, Zhu Y and Liu H (2022) Research on Unmanned Driving Interface Based on Lidar Imaging Technology. Front. Phys. 10:810933. doi: 10.3389/fphy.2022.810933
Received: 08 November 2021; Accepted: 16 February 2022;
Published: 01 July 2022.
Edited by:
Karol Krzempek, Wrocław University of Science and Technology, PolandReviewed by:
Junhao Xiao, National University of Defense Technology, ChinaXiuhua Fu, Changchun University of Science and Technology, China
Liqin Su, China Jiliang University, China
Copyright © 2022 Wang, Zhu and Liu. This is an open-access article distributed under the terms of the Creative Commons Attribution License (CC BY). The use, distribution or reproduction in other forums is permitted, provided the original author(s) and the copyright owner(s) are credited and that the original publication in this journal is cited, in accordance with accepted academic practice. No use, distribution or reproduction is permitted which does not comply with these terms.
*Correspondence: Yuli Wang, d3lsODgyNkBvdXRsb29rLmNvbQ==
 Yuli Wang
 Yanfei Zhu1
 Hui Liu