
94% of researchers rate our articles as excellent or good
Learn more about the work of our research integrity team to safeguard the quality of each article we publish.
Find out more
ORIGINAL RESEARCH article
Front. Phys., 06 October 2022
Sec. Interdisciplinary Physics
Volume 10 - 2022 | https://doi.org/10.3389/fphy.2022.804776
This article is part of the Research TopicMicroscopic Structure Effect on the Macroscopic Property of GeomaterialsView all 63 articles
The decline rate of gas wells varies with production time and is related to reservoir and working system. A typical single well numerical model of low permeability gas wells is established. The variation law of decline rate and its main influencing factors are studied by single factor analysis method. The results show that there are two stages of rapid and slow decline for the decline rate of gas wells, and the decline rate tends to be stable after the gas wells entering the decline period of 2–3 years; the decline rate increases with the increase of permeability, gas saturation and wellhead pressure, and decreases with the increase of porosity and well-controlled reserves; the decline rate in late production does not change with the change of reservoir thickness, initial production allocation and formation pressure. Then the decline rate model is and Then the decline rate model and the non-linear model of each factor are established by using response surface method are used to predict the decline rate quickly and accurately. According to the prediction model, the larger the well-controlled reserves, the smaller the permeability and the smaller the decline rate. In order to reduce production decline rate in gas well production process, it is suggested that the influence of various parameters on production decline rate should be considered comprehensively, and the well-controlled reserves of gas well should be increased as far as possible.
The conventional ARPS method is inaccurate in judging the decline type [1, 2]. It is proposed that the modern production instability analysis method be used to evaluate the dynamic reserves to optimize the decline type and the dimensionless decline rate chart be used to improve or distinguish the decline type, which greatly improves the efficiency and accuracy of field workers in judging the decline type [3–11]. At the same time, the decline of production is primarily due to geological conditions. Because of the constraints restraint, the decline analysis should look for the decline factors from the geological origin, and analyze the relationship between the decline and the geological factors. Many petroleum workers have studied and analyzed the factors of affecting the decline [12–20], but they mainly focus on the reservoir engineering indicators such as oil production rate, production pressure difference, and production fluid index and so on. There is no perfect theoretical method to study the geological factors affecting the decline stage.
The purpose of this paper is to find out the relationship between decline rate and reservoir physical properties, pressure, working system and well-controlled reserves. By means of numerical simulation of gas wells, the main factors affecting production decline of low permeability gas wells are determined by orthogonal experimental design method. On this basis, the prediction model of decline rate under different production conditions is obtained by response surface test design method. It not only avoids the complexity and inaccuracy of identification of decline type, but also provides a new method and new idea for analysis and prediction of decline rate and production decline for “L” type production decline gas wells.
A large number of analysis results show that the law of production decline of gas wells is directly related to geological conditions, production methods and technology [21–27]. Geological conditions mainly include gas reservoir structure type, trap type, reservoir space type, driving type, seepage condition, reserves and so on. Reservoir-seepage condition and driving type play a leading role in gas reservoir decline and ultimate recovery. Mining methods mainly include well pattern deployment, well type, working system, etc. The rationality of well layout is related to whether formation energy can be fully utilized, whether underground reserves can be fully utilized and whether gas reservoirs can be balanced exploitation, which is one of the important factors affecting the decline of gas well production. Technology is an important symbol of the level of gas field development, and plays an important role in ensuring the normal production of gas reservoirs in the later stage of development. If the technology is good and the problem can be solved effectively, the production decline can be effectively slowed down and the life of gas wells (reservoirs) can be prolonged.
Through analysis, the main factors of affecting production decline of gas wells include reservoir physical parameters, well-controlled reserves, formation pressure and working system. In order to analyze the relationship between factors and decline rate, a typical single well model of gas wells is established by numerical simulation method, and the decline rate is studied from qualitative and quantitative perspectives. The basic parameters of the basic model are shown in Table 1, from which a typical gas well mechanism model is obtained.
On the basis of typical gas well mechanism model, eight factors including reservoir permeability, porosity, reservoir thickness, gas saturation, formation pressure, well-controlled reserves (well-controlled radius), initial production allocation and wellhead abandonment pressure are designed.
For tight reservoirs (permeability <1.0 × 10⁻³ μm2), there is no stable production period under 40,000 cubic meters/day production allocation in the gas wells, and it directly decline production of gas wells; for low and medium permeability reservoirs (1–10×10–3 μm2), the higher the permeability of gas wells, the longer the stable production period, and when the permeability is greater than 4 × 10⁻³ μm2, the growth rate of the stable production period slows down. In order to study the influence of different reservoir permeability on production decline law, this design studied seven sets of contrast schemes of reservoir permeability of 0.01, 0.05, 0.1, 0.5, 1, 4, and 8 mD, respectively. It can be seen in Figure 1 that the greater the reservoir permeability, the greater the decline rate; and the decline rate is composed of two stages: rapid decline and slow decline, and the decline rate tends to be stable after 2–3 years.
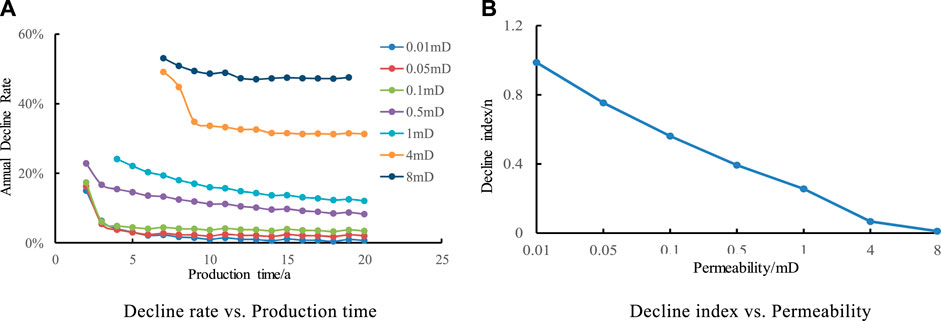
FIGURE 1. Effect of Permeability on Annual Decline Rate and decline index. (A) Decline rate vs. Production time. (B) Decline index vs. Permeability.
The regression decline index n of annual decline rate and annual gas production is calculated. The smaller the value of n, the faster the decline. The regression formula is as follows:
It is shown that the decline index n decreases with the increase of reservoir permeability, which indicatesthe that greater the permeability, the faster the decline. When the permeability K is less than 1 × 10⁻³ μm2, it is more in line with hyperbolic decline, and when the permeability K is more than1×10–3 μm2, it is more in line with near exponential decline. The permeability increases from 0.01 × 10⁻³ μm2 to 8 1 × 10⁻³ μm2, the decline index n changes from 0.987 to 0.0104, and the decline type changes from harmonic to index, which shows that permeability has a great influence on the decline.
In order to study the effect of different reservoir porosity on production decline law, five contrast schemes with reservoir porosity of 0.05, 0.07, 0.09, 0.11, and 0.13 were studied respectively in this design. It is shown in Figure 2 that with the increase of porosity, the longer the stable production time is, the porosity increases by 1%, and the stable production time prolongs by about 0.5 years. The bigger the reservoir porosity is, the smaller the decline rate is. The decline rate is composed of two stages: rapid decline and slow decline, and the decline rate tends to be stable after 2–3 years.
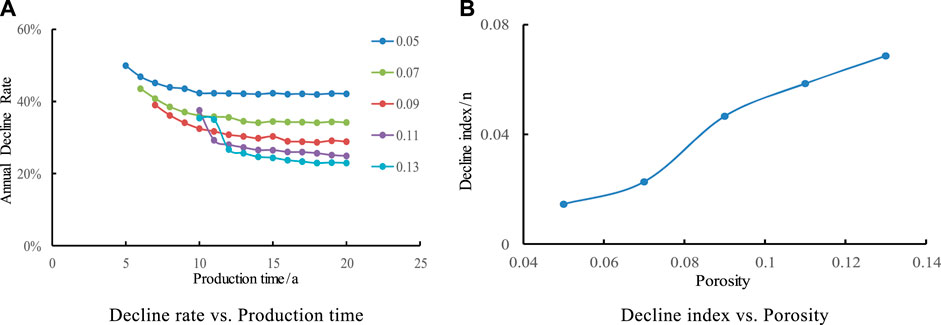
FIGURE 2. Effect of porosity on Annual Decline Rate and decline index. (A) Decline rate vs. Production time. (B) Decline index vs. Porosity.
It shows that the decline index n increases with the increase of reservoir porosity. The law of decline is more in line with the exponential decline. Decline index n increases from 0.0145 to 0.0686 when the porosity ranges from 5% to 13%, which indicates that porosity has a relatively small effect on decline.
In order to study the influence of gas saturation of different reservoirs on production decline law, five contrast schemes with gas saturation of 0.5, 0.6, 0.7, 0.8, and 0.9 were studied respectively in this design. It is shown in Figure 3 that with the increase of porosity, the longer the stable production time is, the porosity increases by 1%, and prolongation of stable production time by about 0.5 years. The bigger the reservoir porosity is, the smaller the decline rate is. The decline rate is composed of two stages: rapid decline and slow decline, and the decline rate tends to be stable after 2–3 years.
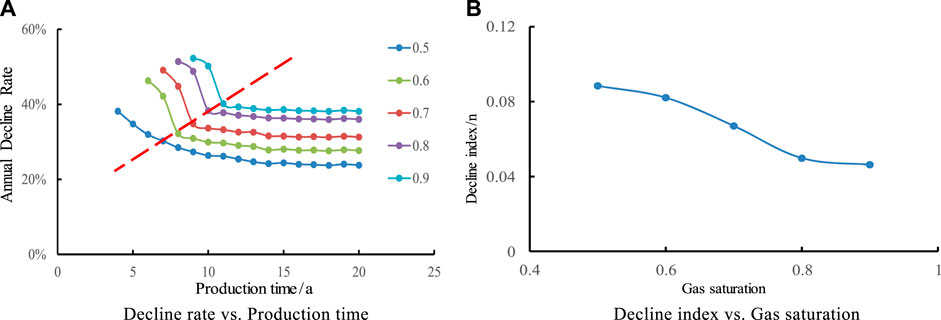
FIGURE 3. Effect of Gas Saturation on Annual Decline Rate and decline index. (A) Decline rate vs. Production time. (B) Decline index vs. Gas saturation.
It is shown that the decline index n decreases with the increase of reservoir gas saturation. Its decline type is close to exponential decline. The gas saturation increases from 50% to 90%, and the decline index n is always less than 0.1, which indicates that the effect of gas saturation on the decline is relatively small.
In order to study the influence of different reservoir thickness on production decline law, five contrast schemes with reservoir thickness of 1, 3, 5, 7 and 9 m were studied respectively in this design. It is shown in Figure 4 that with the increase of thickness, the longer the stable production time is, the thickness increases by 2 m, and the stable production time prolongs by 2 years. The bigger the reservoir thickness is, the smaller the decline rate is. The decline rate is composed of two stages: rapid decline and slow decline, and the decline rate tends to be stable after 2–3 years, and the decline rate hardly changes with the change of thickness in the later stage of production.

FIGURE 4. Effect of Reservoir Thickness on Annual Decline Rate and decline index. (A) Decline rate vs. Production time. (B) Decline index vs. Effective thickness.
It is shown that the decline index n increases with the increase of reservoir thickness. Its decline type is close to exponential decline. The formation thickness increases from 1 m to 9 m, and the decline index n is always less than 0.1, which indicates that the influence of gas saturation on the decline is relatively small.
In order to study the influence of different formation pressures on production decline law, five contrast schemes with formation pressure of 10, 15, 20, 25, and 30 Mpa were studied respectively in this design. It is shown in Figure 5 that with the increase of formation pressure, the longer the stable production time is, the formation pressure increases by 5 Mpa, and the longer the stable production time is about 1 year. The bigger the formation pressure is, the bigger the decline rate is. The decline rate is composed of two stages: rapid decline and slow decline, and the decline rate tends to be stable after 2–3 years, and the decline rate hardly changes with the change of thickness in the later stage of production.
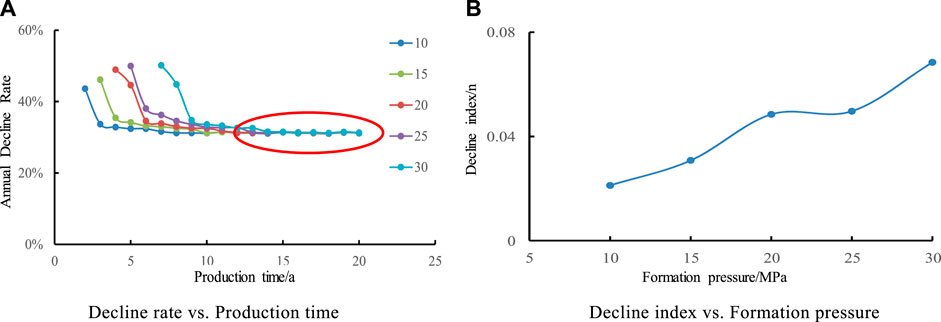
FIGURE 5. Effect of Formation Pressure on Annual Decline Rate and decline index. (A) Decline rate vs. Production time. (B) Decline index vs. Formation pressure.
It is shown that the greater the formation pressure, the more sufficient the formation energy, the larger the decline index, and the slower the overall decline. Its decline type is close to exponential decline. When formation pressure increases from 10 Mpa to 30 Mpa, the value of decline index n changes slightly, always less than 0.1, which indicates that formation pressure has relatively small influence on decline.
In order to study the influence of different well-controlled reserves on production decline law, seven contrast schemes of well-controlled reserves are studied by changing well-controlled radius in the model, which are 0.1, 0.2, 0.4, 0.8, 1.0, 2.0, and 4.0 × 10⁸ m3, respectively. It is shown in Figure 6 that with the increase of well-controlled reserves, the longer the stable production time is, the more multiple the stable production time is with the increase of well-controlled reserves. The bigger the well-controlled reserves are, the smaller the decline rate is. The decline rate consists of two stages: rapid decline and slow decline, and the decline rate tends to be stable after 2–3 years.
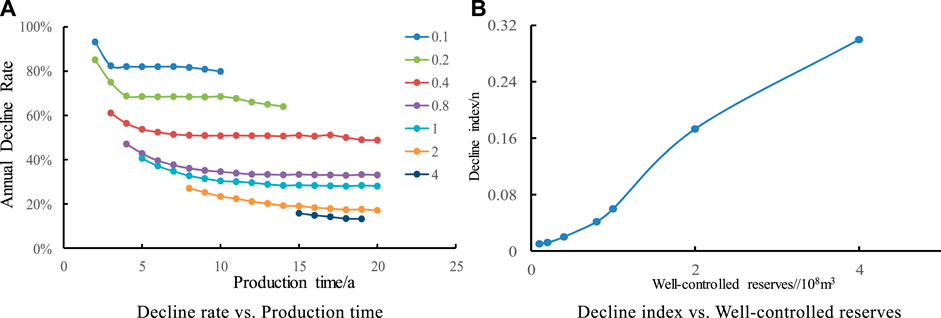
FIGURE 6. Effect of well-controlled reserves on Annual Decline Rate and decline index. (A) Decline rate vs. Production time. (B) Decline index vs. Well-controlled reserves.
It is shown that the larger the well-controlled reserves, the larger the decline index, and the slower the overall decline. When well-controlled reserves are more than 100 million cubic meters, it is in line with hyperbolic decline, and when well-controlled reserves are less than 100 million cubic meters, it is in line with exponential decline. When well-controlled reserves increase from0.1 × 108 m3 to 4 × 10⁸ m3, the value of decline index n varies greatly, which indicates that well-controlled reserves have a relatively large impact on decline.
In order to study the effect of different single well production allocation on production decline and decline rate, this study was carried out by designing five contrast schemes with constant production of 2, 3, 4, 6, and 8 × 10⁴ m3. It is shown in Figure 7 that with the increase of constant yield, the longer the stable yield time is, the more multiple the stable yield time is. The bigger the constant output is, the bigger the decline rate is; the decline rate is composed of two stages: rapid decline and slow decline, and the decline rate tends to be stable after 2–3 years, and the decline rate in the later stage of production hardly changes with the change of the constant output.
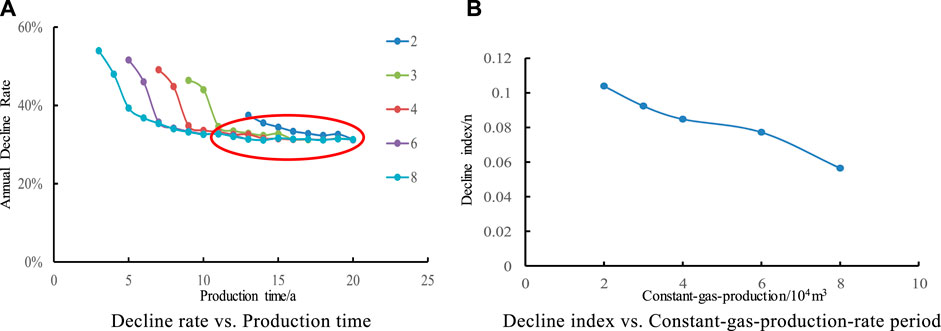
FIGURE 7. Effect of constant-gas-production on Annual Decline Rate and decline index. (A) Decline rate vs. Production time. (B) Decline index vs. Constant-gas-production-rate period.
It is shown that the larger the constant-gas-production, the smaller the decline index and the faster the overall decline. When the fixed gas production increases from2×104 m3/d to 8 × 10⁴ m3/d, the value of decline index n varies greatly, which indicates that the constant-gas-production has a relatively large impact on the decline.
Five contrast schemes of 2, 3, 4, 5, and 6.4 MPa for wellhead abandonment pressure were designed. To study its impact on yield decline and decline rate. It is shown in Figure 8 that the higher the wellhead pressure, the shorter the stable production period; with the increase of production time, the decline rate of gas wells decreases, and tends to be stable after 2–3 years. The higher the wellhead pressure, the greater the decline rate. The bigger the wellhead pressure, the smaller the decline index and the faster the overall decline. The type of decline accords with near exponential and hyperbolic decline. When wellhead pressure increases from 2 MPa to 6.4 MPa, the value of decline index n decreases from 0.2705 to 0.0468, which shows that the influence of wellhead pressure on decline is relatively large.
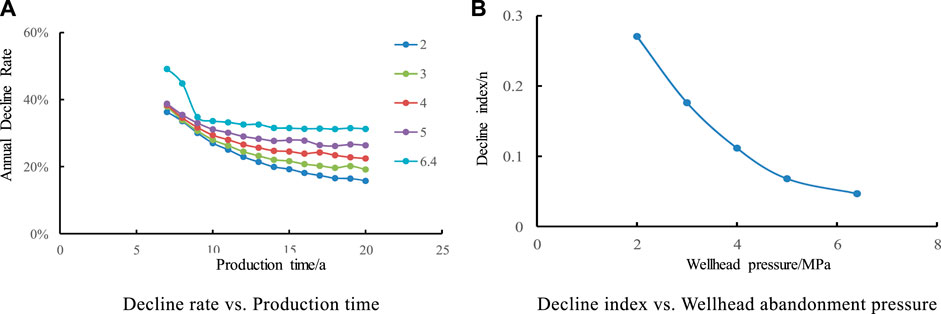
FIGURE 8. Effect of wellhead abandonment pressure on Annual Decline Rate and decline index. (A) Decline rate vs. Production time. (B) Decline index vs. Wellhead abandonment pressure.
Response Surface Regression Analysis (RSRA) [28, 29] is a research method which combines mathematical method, experimental design and statistical analysis. It is usually used to study the mathematical model between different influencing factors and their corresponding response output. It is a qualitative and quantitative analysis method. Five levels of response surface analysis including permeability, well-controlled reserves, and gas allocation and formation pressure are designed. In this method, as shown in Table 2 the center point represents with the axis “0.” The cube point represent with “±1,” and the axial point represent with “±α.” There are four factors in our experiment, according to the law of central composite design in Response Surface Regression Analysis, the α equal 2, and we can get the experiment design from it. 31 groups of experiments are designed to respond to the decline rate, and the influence of interaction among factors on the decline rate can be considered. Production was simulated for 20 years through 31 schemes were simulated by reservoir numerical simulation method.
According to the fitting effect, the quadratic regression model of quaternion is selected to fit, and its general form is as follows:
Where, y-target value, x1、x2 … … xk—The input of regression model; β0、βi、βij、βij-regression coefficients; ε-error in response variables。
Taking the decline rate of the first year as an example, the analysis of variance was used to analyze the significance of the interaction of multiple factors and the accuracy testing of regression model. The results of decline rate response surface analysis for the first year were obtained, as shown in Figure 9.
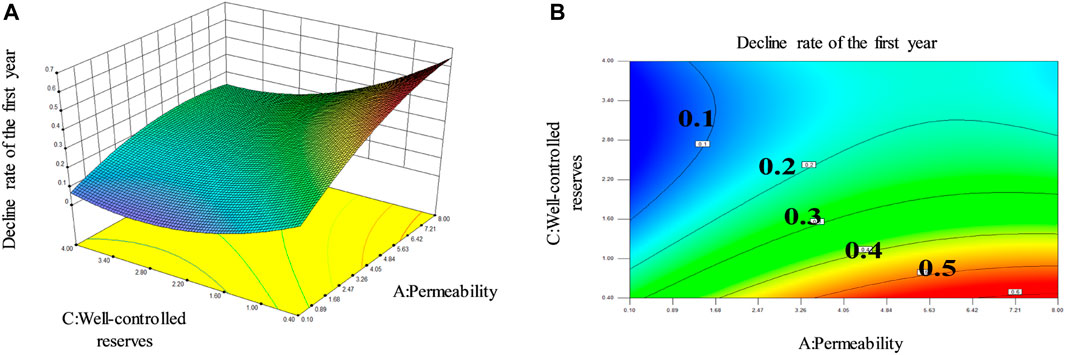
FIGURE 9. Analysis diagram of response surface; (A) Three-dimensional diagram; (B) Two-dimensional diagram.
Multiple regression and binomial fitting were performed for each factor to determine regression coefficients. First, a linear regression equation was fitted with the test data of two horizontal factors including the center point. If the surface is found to have a tendency to bend, consider adding a binomial regression equation, until fitting out the perfect binomial equation. The regression model between response output and factor is shown in Eq. 3 (A is permeability, B is formation pressure, C is well-controlled reserves, D is working system, R is decline rate):
Then, through the normal probability distribution of residual and the comparison between the actual value of R1 and the predicted value of the model, it can be seen that all the data point is near the central line in both picture, which means the prediction value is just much close to the actual value. It proves that the model has high accuracy and reliability (as shown in Figures 10, 11), so the decline rate can be predicted by using the model.
After obtaining the response surface model, the decline rate and gas production of the eleven wells from G1 to G11 are validated with the model. The results are shown in Table 3. The experimental results show that the applicable conditions of the model are: well-controlled reserves are between 0.1 and 400 million, permeability is 0.1–8 mD, formation pressure is 10–30 MPa, and production is 2–80,000 cubic meters per day. The average absolute error between the initial annual decline rate calculated by response surface model and the actual well initial annual decline rate is 1.31%.
On this basis, the decline rate and gas production of each year after the decline of these 11 wells are predicted, and the well G1 are taken as examples for specific analysis. The results are shown in Figure 12.

FIGURE 12. Comparison of Response Surface for G1 and Traditional Method: (A) decline rate; (B) production.
The mechanism model and the actual production of gas wells show that the decline type and decline index are constantly changing, while it must determine a decline index firstly for the conventional ARPS method. This model can directly calculate the decline rate without determining the decline type and decline index. Three gas wells prove that the response surface decline rate prediction model can be used to predict the change trend of decline rate and production through the case analysis of three gas wells.
It shows that there are two stages of fast and slow for the decline rate of gas wells through the numerical simulation, and the decline rate tends to be stable after the gas wells enter the decline period of 2–3 years; the decline rate increases with the increase of permeability, gas saturation and wellhead pressure, and decreases with the increase of porosity and well-controlled reserves; the decline rate of late production has nothing to do with reservoir thickness, initial production allocation and formation pressure. The numerical simulation analysis of the response surface for gas well shows that the degree of influence on production decline rate is well-controlled reserves, permeability, working system and formation pressure in turn; the calculation result of the initial decline rate prediction model of gas well established by using multi-factor response surface analysis and considering the interaction of factors is 1.31% absolute error with the actual well, which meets the production requirements and can be used for rapid prediction for decline rate of gas well.
The original contributions presented in the study are included in the article/Supplementary Material, further inquiries can be directed to the corresponding author.
HW: Lay down target and methods. YF: Lay down target and methods. YW: Single factor analysis. YZ: Quantitative Analysis of Multivariate Response Surface.
Authors HW and YW were employed by Petrochina Changqing Oilfield Company
The remaining authors declare that the research was conducted in the absence of any commercial or financial relationships that could be construed as a potential conflict of interest.
All claims expressed in this article are solely those of the authors and do not necessarily represent those of their affiliated organizations, or those of the publisher, the editors and the reviewers. Any product that may be evaluated in this article, or claim that may be made by its manufacturer, is not guaranteed or endorsed by the publisher.
The Supplementary Material for this article can be found online at: https://www.frontiersin.org/articles/10.3389/fphy.2022.804776/full#supplementary-material
2. Arps JJ. Analysis of decline curves transaction of American Institute of mining, metallurgical, and petroleum engineers, 1944, 160:228–47.
3. Fetkovich MJ. Decline curve analysis using type curves. J Pet Technol (1980) 32:1065–77. doi:10.2118/4629-pa
4. Fetkovich MJ, Bradley MD, Works AM, Thrasher TS. Depletion performance of layered reservoirs without crossflow[J]. SPE Formation Eval (1990)(3) 310–8. doi:10.2118/18266-pa
5. Rushing JA, Perego AD, Sullivan R, Blasingame TA. Estimating reserves in tight gas sands at HP/HT reservoir conditions: Use and misuse of an arps decline curve methodology[C]. In: SPE Annual Technical Conference and Exhibition. Society of Petroleum Engineers (2007). doi:10.2118/109625-ms
6. Blasingame TA, McCray TL, Lee WJ. Decline curve analysis for variable pressure drop/variable flow rate systems [J]. In: SPE Gas Technology Symposium; January 22–24, 1991; Houston, Texas (1991).
7. Zelghi F, Djebbar T, Mazighi M. Application of decline curve analysis in gas reservoirs using a newly developed fitting equation[C]. In: SPE Gas Technology Symposium; April 30–May 2, 2002; Calgary, Alberta, Canada (2002).
8. Schmidt SH, Caudle BH, Miller MA. Gas well decline anal-y sis incorporating real-gas behavior and non-Darcy flow[C]. In: SPE15521.SPE ATCE in New Orleans; October1986,5-8; LA,USA (1986).
10. Chen J, Xu G, fan H. Study on a compound model of gas reservoir production decline [[J]. Nat gas exploration Dev (2008) 31(3):39–41.
11. Okuszko KE, Gault BW, Mattar L. Production decline performance of CBM wells. In: Petroleum Society′s8th Canadian International Petroleum Conference(58th Annual Technical Meeting); June2007: 1-7; Calgary, Alberta, Canada (2007).
12. Shangjing H, Wang Y, Chen M. Analysis of production decline law of low permeability gas reservoir [J]. Xinjiang Pet Geology (2009) 30(5):616–8.
13. Chen J, Xu G, Fan H. Research on a compound production decline model_[J]. Nat Gas Exploration Develop (2008) 31(3):39–41.
14. Liu Q, Qu X, Zhu D. Analyzing the relationship between time and annual production by transiting the non- linear curve into a linear curve[J]. Offshore Oil (2004) 24(2):50–3.
15. He J, Chen X, Yue P. Application of linear regression method to analysis of oil and gas production rate decline[J]. Lithologic Reservoirs (2009) 21(2):103–5.
16. Li P, Hao M, Hu J, Ru Z, Li Z. A new production decline model for horizontal wells in low-permeability reservoirs. J Pet Sci Eng (2018) 171:340–52. doi:10.1016/j.petrol.2018.07.059
17. Cao L, Li X, Luo C. Investigation of unstable production decline in fractured low-permeability gas reservoir horizontal wells[J]. J Southwest Pet University(Science Technol Edition) (2017).
18. Qiao X, Jing LI, Feng D. Pressure and production decline laws of low-permeability gas wells and their influential factors[J]. Oil Drilling Prod Technol (2017).
19. Sun H, Ouyang W, Zhang M, Tang H, Chen C, Ma X, et al. Advanced production decline analysis of tight gas wells with variable fracture conductivity. Pet Exploration Develop (2018) 45(003):472–80. doi:10.1016/s1876-3804(18)30052-1
20. Qiao X, Jing L, Dong F, Feng T, Zhang L, Chen Y. Law of pressure and production decline of low permeability gas wells and its influencing factors [J]. Pet drilling Prod Technol (2017) 39(03):259–66.
21. Chen Y. Production decline analysis and prediction method of gas wells in low permeability gas reservoirs [D]. Chengdu: Southwest Petroleum University (2017).
22. Wang Y, Wan X, Hao Y, Zhao Y, Du L, Huang Y, et al. NR6A1 regulates lipid metabolism through mammalian target of rapamycin complex 1 in HepG2 cells. Cell Commun Signal (2019) 6(03):77–80. doi:10.1186/s12964-019-0389-4
23. Yang Z, Li Z, Chen K, Ren G, Lai F. New method and application of productivity decline analysis—taking daniudi tight gas reservoir as an example [J]. Fault block oil and gas field (2015) 22(04):484–7.
24. Zhang C, Jin D, Liu C, Wang F, Wang Z, Wang J. Analysis of production decline law and reasonable production allocation of horizontal wells in low permeability sandstone gas reservoir—taking a block of Sulige gas field as an example [J]. J Pet Nat gas (2014) 36(11):223–7.
25. Xiong J, Ma Q, Xiao F, Qian M. Study on productivity decline law of fractured wells in low permeability gas reservoirs based on seepage characteristics [J]. Sci Technol Eng (2013) 13(06):1592–6.
26. Yang S. Study on production decline law of shacanping Carboniferous low permeability gas reservoir [D]. Chengdu: Southwest Petroleum University (2012).
27. Wang H, Kou Z, Bagdonas DA, Phillips EHW, Alvarado V, Johnson AC, et al. Multiscale petrophysical characterization and flow unit classification of the Minnelusa eolian sandstones. J Hydrol (2022) 607:127466. doi:10.1016/j.jhydrol.2022.127466
Keywords: factor analysis, decline rate model, single factor analysis, multi-factor response surface, low permeability reservoir
Citation: Wang H, Wu Y, Fu Y and Zhang Y (2022) The Research of Declining Factor and a New Model of Decline Rate for Gas Well Production in Low Permeability Reservoir. Front. Phys. 10:804776. doi: 10.3389/fphy.2022.804776
Received: 29 October 2021; Accepted: 03 January 2022;
Published: 06 October 2022.
Edited by:
Qingxiang Meng, Hohai University, ChinaReviewed by:
Ailin Jia, Research Institute of Petroleum Exploration and Development (RIPED), ChinaCopyright © 2022 Wang, Wu, Fu and Zhang. This is an open-access article distributed under the terms of the Creative Commons Attribution License (CC BY). The use, distribution or reproduction in other forums is permitted, provided the original author(s) and the copyright owner(s) are credited and that the original publication in this journal is cited, in accordance with accepted academic practice. No use, distribution or reproduction is permitted which does not comply with these terms.
*Correspondence: Yong Wu, d3V5b25nX2NxQHBldHJvY2hpbmEuY29tLmNu
Disclaimer: All claims expressed in this article are solely those of the authors and do not necessarily represent those of their affiliated organizations, or those of the publisher, the editors and the reviewers. Any product that may be evaluated in this article or claim that may be made by its manufacturer is not guaranteed or endorsed by the publisher.
Research integrity at Frontiers

Learn more about the work of our research integrity team to safeguard the quality of each article we publish.