- INFN, Sezione di Cagliari, Monserrato, Italy
Particle tracking for future experiments at colliders is an incredible challenge in terms of sensor technology and readout. Simulation tools are a crucial ingredient to investigate new layouts able to cope with harsh radiation conditions and, at the same time, provide valuable timing information for track finding algorithms. Detailed and numerous simulations of energy deposits as well as sensor and front-end electronics responses imply a heavy usage of computing resources. In this paper, we present two software packages that, via massive parallelization and dedicated algorithms, allow for a significant speed-up in simulation time.
1 Introduction
We present the TCoDe [1] and TFBoost [2] open-source software packages, which are dedicated to the simulation of silicon sensor and front-end electronics response, respectively. Both packages are C++14 compliant and based on the header-only library Hydra [3] so that they can exploit massively parallel architectures such as OpenMP [4], CUDA [5] and TBB [6], depending on the available hardware. They have been developed within the TimeSPOT [7] collaboration but do not depend on its specific sensor technologies. TCoDe and TFBoost were recently used (and tested) to understand sensor behavior by comparing simulations with high statistic test-beam measurement collected during the first TimeSPOT sensor test-beam in 2019 [8–10], as well as for comparison of various 3D-sensor geometries for fast timing measurements [11].
2 TCoDe
TCoDe (for TimeSPOT Code for Detector simulation) [11] is a software dedicated to determine the induced current at the sensor electrodes due to the motion of charge carriers created by an initial energy deposit via the Ramo theorem. In its current version, TCoDe does not support yet charge multiplication. TCoDe acts in support of existing commercial software, such as the Synopsys TCAD [12], which does not provide time-efficient transient simulations for high energy physics. In fact, TCAD lacks a realistic energy deposition implementation and the possibility to perform fast transient simulations for relatively large 3D sensors. The possibility to import external energy deposits on TCAD is possible, but is limited by both the maximum level of detail TCAD can rebuild the deposit, and the computing time, which is still very long [11]. The design of TCAD is based on charge density rather than individual and discrete charge carriers; therefore, it implements a mesh grid to divide the sensor into small volumes where the charge density evolution is determined. The latter is a powerful and flexible approach that allows TCAD to produce reliable simulations for a wide variety of devices. Nevertheless, based on the used mesh strategy, it may suffer from numerical diffusion. In computer simulations of continuous media, numerical diffusion may cause a higher diffusivity than what would happen in reality, usually due to a too coarse mesh grid used during the computation [13]. In TCAD, this has the effect to cause the charge to spread out differently if the mesh size is too large, causing at last the formation of a complete different signal shape. Numerical diffusion can be kept under control with a sufficiently fine grid as done for planar sensors, where TCAD is the standard tool. However, in 3D sensor technology with no charge multiplication, the number of carriers is typically around 10–12 K and the sensor volume is relatively large. To avoid washout of the important features of the current signal due to numerical diffusion, which may be extremely important for timing devices, TCAD requires an extremely fine grid in all three spatial dimensions (compared with a quasi-2D grid needed for planar sensors), which makes the computing time explode. In particular, a fine grid is required in the region of the energy deposition and along the path followed by the charge carriers. TCoDe tries to solve this issue by following the motion of the individual charge carriers, which is intrinsically independent of the applied mesh strategy, and depends only on the knowledge of the sensor properties at constant temperature and bias voltage.
2.1 Software Architecture
Hereafter, the focus will be on technical aspects of the various steps of the simulation and how they are organized.
The simulation is composed of two phases: the loading phase, in which the sensor properties are loaded; and the transient simulation phase, in which the Ramo theorem is used to determine the induced current. During the loading phase, TCoDe loads onto memory all the required physical information of the sensor, hereafter referred to as “physics maps.” The physics maps describe the electric field and carrier mobilities and the weighting field throughout the sensor volume. Moreover, the energy deposit can be either loaded from external tools or generated by TCoDe itself, which is then converted into a collection of electron–hole pairs. Once the physics maps and the electron–hole pairs are loaded, the induced current as a function of time is computed by accounting for carrier drift due to the electric field and thermal diffusion within the sensor. The carrier motion evolution is performed via a fourth-order Runge–Kutta algorithm while the current calculation is performed summing over the instantaneous carrier velocities as a function of time multiplied by the weighting field at their position. More details of the exact calculations implemented in TCoDe are available in [11].
Depending on the applied settings, the default output of the simulation is limited to a simple current versus time plot, which can be extended to include each particle path. In addition, one can save an animated gif of the transient simulation with the movement of all carriers or save the position of each carrier at any given time in a ROOT [14] file format. A scheme of the simulation flow is shown in Figure 1. In the following sections, a detailed description of the steps described previously is given.
Multiple deposits, with different settings and positions, can be simulated all at once without having to reload the physics maps (which can be a quite heavy task depending on the complexity of the sensor).
2.2 Physics Maps
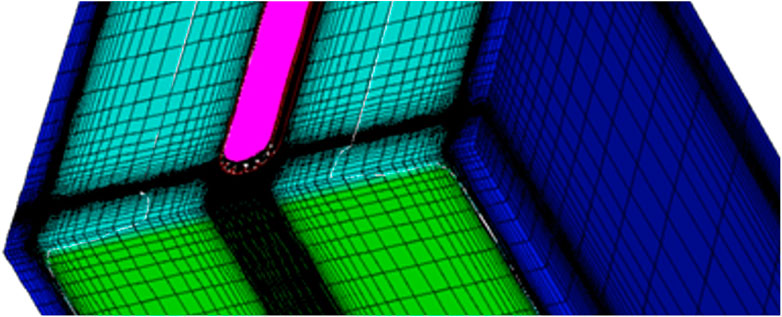
The physics maps contain the information necessary to determine the evolution of the charge carriers’ positions and their induced current. They consist of the electric field, carrier mobility, and weighting field throughout the volume of the sensor. The only constraint from TCoDe is that these maps are provided in a tensorial mesh grid format. In simpler terms, values for each of the aforementioned quantities have to be provided in a 3D (xi, yj, zk) grid of points, where i (j, k) runs from 0 to the number of grid divisions in x (y, z), Nx (Ny, Nz), and for each xi (yj or zk) values of the various quantities are defined for all the yj and zk (xi and zk or xi and yj). A visual representation of a tensorial mesh grid is shown in Figure 2. An example of a non-tensorial mesh grid is the traditional Delauney mesh grid, which is also used by TCAD to describe the sensor properties. The advantage of a tensorial grid is that all points can be arranged into a specific order in each of the three spatial dimensions, while this is not the case for a non-tensorial mesh grid. Having the points ordered allows to quickly find those closest to a given carrier to determine, for example, the electric field at its position. On the contrary, a non-tensorial grid requires in general a loop over all the points in the grid for the same operation. In more quantitative terms, a tensorial mesh grid allows to quickly find the closest point to the carrier position since the search can be done separately for the x, y, and z directions, reducing the number of computations required from
It is noted that ultimately, the quality of the physics maps is crucial for a precise simulation. Therefore, grid spacing must be chosen depending on the specific sensor layout.
2.3 Energy Deposits
The simulation of an energy deposits within the sensor volume is necessary to have the initial electron-hole pair distribution and start the simulation. As anticipated, TCoDe itself can generate very simple deposits by placing electron–hole pairs in a straight line with parameters chosen by the user (similar to TCAD but with a higher degree of customization), which is very convenient in preliminary studies when basic sensor performances have to be assessed without the complication of a realistic energy deposit. In addition, energy deposits can be imported in TCoDe simulations, similarly to physics maps, via .dat files in the following format: the first three columns represent the start of the deposit, the following three columns represent the endpoint of the deposit, and the seventh column represents the energy deposited along the line connecting the start and the end point; a further eighth column is reserved to a flag that specifies whether the deposit is from the primary or secondary interactions. Moreover, TCoDe is not limited by the complexity of the deposit as an arbitrary number of rows can be present. Therefore, deposits from specialized tools, such as GEANT4, can be imported easily into a TCoDe simulation.
Further developments, anticipated here but not yet included in the master branch, will include the possibility to simulate deposits by LASER or large light pulses. Therefore, an algorithm was implemented to account for the Lambert–Beer equation for absorption and describes the shape of the energy distribution perpendicularly to the propagation direction to account for the width of the beam. The light deposit generator is still under test and will provide a valuable extension to the possible fields of application of the TCoDe. A visual representation of the energy deposits available in TCoDe is shown in Figure 3.
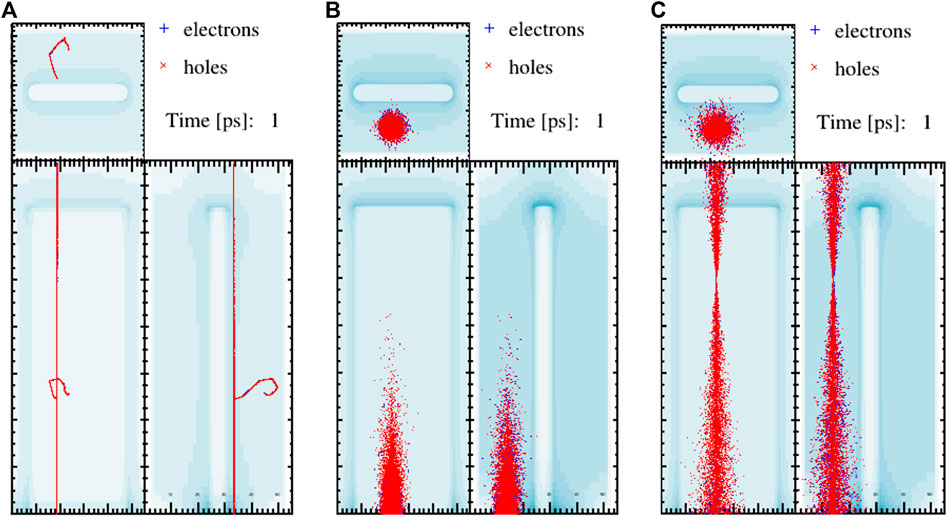
FIGURE 3. Different energy deposits generated using TCoDE. (A) GEANT4 imported deposit, LASER generated deposit with different wavelengths, showing (B) strong absorption and (C) weak absorption.
2.4 Induced Current Determination
The determination of the induced current is the main focus of TCoDe. The carrier motion as a function of time is calculated including their drift due to the electric field using a fourth-order Runge–Kutta algorithm and the thermal diffusion (the temperature can be specified). The contribution of each carrier to the current induced on the readout electrode is determined with the Ramo theorem for each time interval. It is important to note that the position of the charge carriers does not have to necessarily coincide with one of the points of the grid. Therefore, the physics values effectively used in simulation are determined via linear interpolation from the eight grid points identified as the vertices forming a cube around the carrier position. TCoDe exploits a multi-threaded approach by treating each carrier independently in separate computing thread, either in CPU or GPU. The parallelization in charge carriers allows for a dramatic speed up with respect to a single thread approach, particularly when the calculation is performed in GPU. On typical machines, TCoDe can comfortably deal with up to few millions of carriers without much degradation in performance. To cover a wider range of carrier numbers, TCoDe allows to “group” them in bunches, in such a way that each bunch is treated as a single one. This approach reduces again computing speed at the cost of a less defined current signal. However, in 3D sensor simulation, where the number of carriers is relatively low, grouping them is not necessary, therefore allowing for extremely detailed simulations. As anticipated, TCoDe cannot yet deal with charge multiplications (although its inclusion is foreseen in the medium term) and assumes that carriers do not interact with each other. This assumption is reasonable for sensors used in high energy physics, where the average deposit in silicon is about 80–100 e/h pairs per micron, sufficiently small so that the average distance between carriers is large enough that electromagnetic interaction among carriers is negligible. Finally, an example of TCoDe simulation output for a TimeSPOT silicon sensor is shown compared with a TCAD simulation in Figure 4. It is noted that the two shapes are very similar with the TCoDe one having sharper features. Moreover, the TCoDe signal simulation took only 250 ms on an NVIDIA A100 GPU while the TCAD one took over 30 h on a workstation with two Intel Xeon E5645 and 48 GB of ram. More detailed performance figures for TCoDe will be given in the next sections.
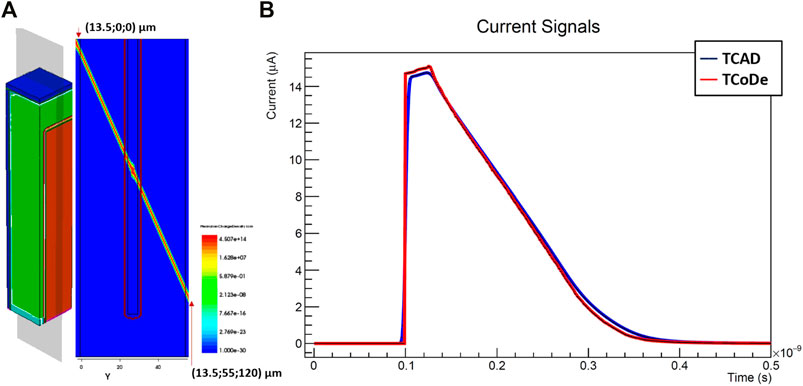
FIGURE 4. Comparison of TCoDe and TCAD simulated currents (B) for an energy deposit producing roughly 12 k charge carriers on a TimeSPOT silicon sensor (A).
3 TFBoost
For a comprehensive simulation and a meaningful comparison with measurements, the output signals of TCoDe must be convoluted with a realistic front-end electronics response. TFBoost (TimeSPOT Front-End Booster) is a C + + 14-compliant application and library, highly based on the Hydra framework [3], developed to accomplish this purpose. In particular, TFBoost allows to perform convolution in massively parallel platforms on Linux systems, between a signal and a transfer function describing a signal analyzer system, allowing also to simulate electronic noise and to perform a set of operations and measurements on the convoluted signals (filtering, discrimination, etc.).
3.1 Software Architecture
TFBoost includes a library of pre-defined transfer functions, implemented as C++ functors and fully configurable by the user in run-time. The available transfer functions are as follows: a Charge Sensitive Amplifier response (CSA) with MOS input stage; low pass order-n RC and Butterworth filters; an ideal integrator response; two transimpedance responses, with one or two BJT amplification stages. In the latter case, the first stage is modeled as a second-order transfer function, following Ref. [15], while the second stage is a single pole inverting voltage gain transfer function.
Moreover, TFBoost provides an application layer to perform the actual simulations, developed following mostly a functional design, with additional modules to manage the external configuration, the histograms facility, and the noise simulator. The simulation flow is described in more detail in Section 3.3. The input signal and its corresponding convoluted and transformed versions are implemented in TFBoost as special C++ containers, derived from Hydra as C++ STL-like multi-vectors, able to store multi-dimensional data-sets using Structure of Arrays (SoA) to optimize memory use.
The convolution of the input signal and the selected transfer function is based on Fast Fourier Transform (FFT), exploiting the multi-threaded architecture through interfaces to FFTW or CuFFT libraries [16], allowing to compute 1D real-real, complex-real, and real-complex convolutions on CPU or GPU for arbitrary pair of functors.
The electronic noise can be added to the signal either by computing the noise samples from a configurable analytical model or by using noise samples provided externally by the user. A more detailed description of the noise is given in the following sub-section.
In addition, there is the possibility to apply transformations or filters to the convoluted signal. In particular, it can be re-sampled with a configurable time-step, emulating the time digitization of a signal analyzer, e.g., an oscilloscope, or a TDC with a specific resolution. In case the chosen time-step is smaller than the original one, a cubic spline is computed before re-sampling. Moreover, the Y values of the signal can be digitized simulating an ADC with a configurable number of bits.
The application performs a set of measurements on the convoluted signals such as arrival time using a leading edge (LE), constant fraction (CFD), or amplitude-risetime-compensated (ARC) discrimination with adjustable thresholds and parameters, maximum amplitude and its corresponding time, slopes at discrimination points, etc. Furthermore, the exact measurement of the electronic jitter is computed as the difference between the arrival times measured with and without noise. All the three discrimination methods can be performed in two ways: a coarse method, in which the time corresponding of the nearest sample that verifies the discrimination requirement is taken; and a more fine-grained method, in which a Minuit2 fit [17] near the coarse time is performed and the fine-grained time is computed by interpolating the fitted function with the required threshold.
3.1.1 SPICE-Like Simulation and Semi-Empirical Transfer Functions
In addition to the transfer functions available within the library, TFBoost can also perform the convolution between an input signal and a transfer function provided externally by the user as a set of sampling points. This enables the user to exploit realistic electronics response, e.g., measured experimentally or simulated with other software packages. However, these real transfer functions are usually not easily accessible experimentally or cannot be simulated without specific software with complex simulations, while the output responses are.
For this reason, TFBoost provides a second application, where a transfer function can be calculated and saved to a file by performing the de-convolution between an input and the corresponding output signal. This transfer function is then used in the main TFBoost application to simulate complex circuits that cannot be easily described analytically. If the output response is the result of a simulation made with a SPICE software, such as LTSpice [18], TFBoost can determine the transfer function with the same accuracy level of an LTSpice simulation, as shown in Figure 5, thus with the advantage of producing high statistics samples thanks to the fast convolution algorithms. On the other hand, if the output response is the result of an experimental measurement, the obtained transfer function is a semi-empirical description of the real transfer function of the system. The advantage of this method is that the final electronics response describes also the electrical couplings (sensor capacitance, sensor-electronics connection impedance) that are nearly impossible to be measured. This procedure has been recently applied on the interpretation of the test beam data of the TimeSPOT 3D silicon sensors [10], performed in October 2019, leading to a very good agreement between simulation and measured data.
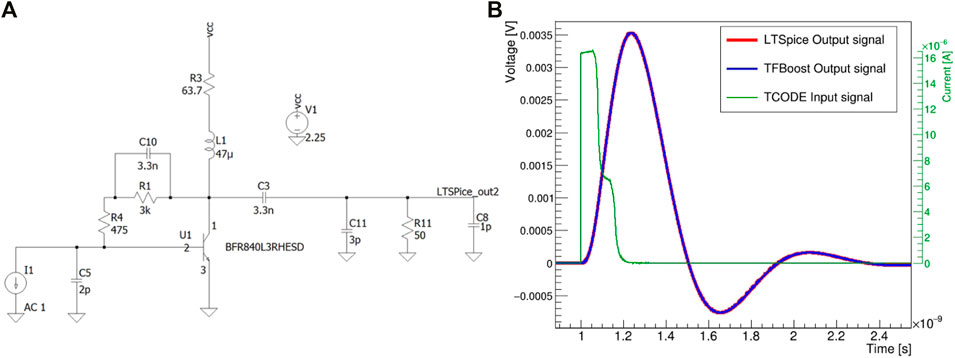
FIGURE 5. Example of a Spice simulation of a circuit that uses the spice model of a real SiGe bipolar transistor [19] (A). Comparison of the voltage output obtained using the same TCoDe input current in LTSpice and with TFBoost (B).
3.1.2 Noise
As explained in previous sections, the electronic noise can be added to the signal in two ways: by computing the noise samples from a configurable analytical model or by using noise samples provided by the user. The latter case is particularly convenient when noise samples are available as experimental measurements, in which all the noise spectrum characteristics are preserved, taking into account also possible extrinsic noise sources, which are usually unknown and nearly impossible to be described in simulation.
Known custom packages for electronics simulation, such as Allpix2 [20], use analytical white noise models, thus without any temporal correlation between noise samples. A more realistic model can be obtained by studying the power spectral density of common front-end electronics noise, as done in [10]. The noise spectrum is generally not flat throughout the frequency domain, but it exhibits higher intensity at lower frequencies. Therefore, to simulate a more realistic noise, a red noise analytical model has been implemented in TFBoost. The noise values are generated as discussed in Ref. [21] by adding a correlation r between samples, with 0 < r < 1. Specifically, the sequence of red noise points, xi, is calculated as
where yi represents a sequence of white noise samples with given RMS. The coefficient r and the RMS can be tuned by the user in the configuration file to reproduce the required spectrum. Moreover, the noise waveform can be further filtered with a Butterworth filter or a RC filter of nth order, to enhance low-frequency components if necessary.
The convoluted output signal with a realistic red noise is shown in Figure 6, where also the transient signal from TCoDe and a transfer function of a fast front-end electronics based on an analytical transimpedance are shown.

FIGURE 6. : Example of the result of the front-end simulation for a single input current from TCoDe, for a 3D-trench double pixel structure at −150 V bias voltage. (A) Input current for a MIP deposition in the sensor (center) simulated analytical transimpedance and (B) output signal waveform with red noise.
3.2 Graphical User Interface
The applications provided by TFBoost, i.e., the main simulation and the de-convolution applications, can be launched directly from terminal after having properly written the configuration files. To simplify the TFBoost usage to the users, also a graphical user interface (GUI) has been developed (Figure 7). The user, through the GUI, can easily enable and specify all the simulation steps and functionalities such as time and voltage digitization, noise properties, discrimination thresholds, and signal filtering. By clicking on the “Run” button, the GUI application fills properly the configuration file and launches the main simulation. The transfer function is set and configured by choosing it among the available models in the library or by selecting it from a file. Moreover, the GUI allows the user to compute the electronics response by making the de-convolution procedure, as explained in the previous section. The simulation progress can be monitored from the terminal, while all the results of the measurements are shown in a separate window (see Figure 8), using the ROOT plotting library to build and show the histograms.
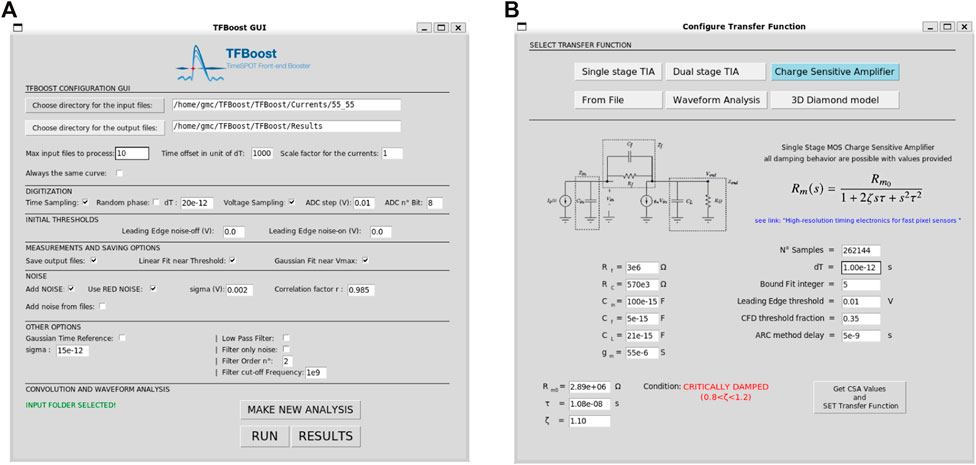
FIGURE 7. TFBoost Graphical User Interface: (A) main window of the GUI where all steps and functionalities can be set; (B) the transfer function configuration window, from which it is possible to make just a waveform analysis, or to choose the transfer functions among the analytical models or from a file.
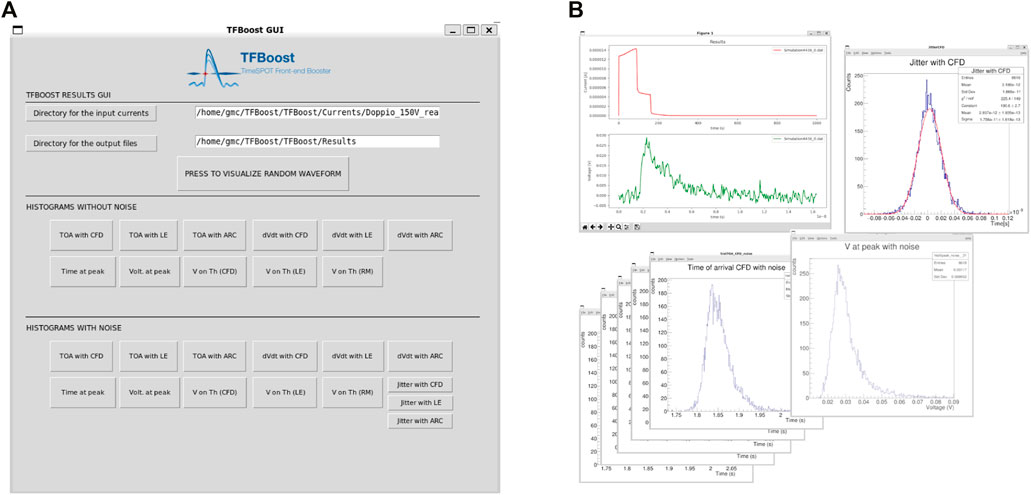
FIGURE 8. TFBoost GUI results window (A), from which it is possible to retrieve and plot the waveforms and the ROOT histograms (B).
3.3 Simulation Flow
In TFBoost, the main simulation routine is divided into three main phases and it is schematically shown in Figure 9, depicted as black and green flow. During the first phase, the application instantiates the noise module, the histogram and configuration managers, parsing the values specified in the configuration files provided by the user, and instantiates also the transfer function to be used. The second phase is the actual event loop: in each iteration, an input signal is loaded in memory as a Hydra vector and it follows the transformation flow. If the convolution is not enabled, the input signal is interpreted as an output signal to be directly analyzed by the last routine, which performs the signal analysis measurements and plots (green path in Figure 9). Conversely, if the convolution is enabled, the signal vector is used to build a temporary C++ functor, by calculating a cubic spline over the samples; then the signal and electronics response functors are passed to the convolution routine, which returns the convoluted signal as a new Hydra vector. From this step onward, the signal passes through a series of transformations that involves addition of the noise (simulated white or red noise, with additional filtering, or from user files), TDC sampling, and ADC digitization. The transformed signal is then passed to the final analysis routine. At the end of a loop iteration, the measurements are collected by the histogram manager, which fills the corresponding ROOT histograms. The work-flow is repeated until all the input signals in the specified directory are analyzed, or if a maximum number of signals, specified by the user, is reached. The third simulation phase consists just on plotting and saving the histograms by the histogram manager. The GUI allows the user to easily access the plots from a dedicated window.
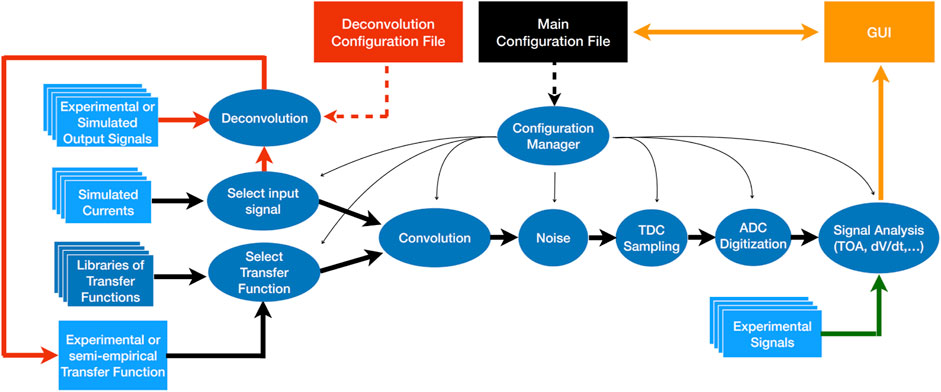
FIGURE 9. Schematic representation of TFBoost simulations flow. The black path is the main simulation in which the convolution and the signal analysis is performed. The green path is followed if TFBoost is used as a pure signal analyzer, while the red path is followed to perform the deconvolution between an input current and an output signal.
The de-convolution routine is simpler and is shown in Figure 9 as a red flow. From the corresponding configuration file, the user can specify the files for input current and the corresponding output signal, which are both loaded in memory as Hydra vectors. The application performs then the de-convolution and the result is saved into a file. There is also the possibility to apply a post-deconvolution low-pass filter with specific order and cut-off frequency, to suppress spurious high-frequency spikes, which may occur during the de-convolution procedure, following methods described in [22, 23]. Also, in this case the configuration and the final results can be controlled using dedicated windows of the GUI.
4 Performance Measurements
To study the computing performance of the algorithms implemented in TCoDe and TFBoost, some tests have been performed on a dedicated high-performance workstation, equipped with four AMD EPYC 7452 CPU with 32 cores each, for a total of 128 available threads, 256 GB of RAM, and an NVIDIA A100 PCIe GPU board for fast data computing with 2,048 cores.
4.1 Transport Mechanism in TCoDe
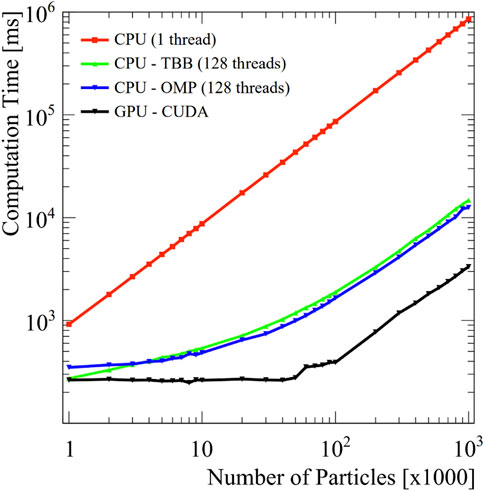
TCoDe computational speed has been tested by performing multiple simulation runs with increasing particle number, keeping the time step and total transient time constants. Simulations went from one thousand to one million particles at logarithmic steps and the simulation time was measured, excluding the time needed to upload the maps. As shown in Figure 10, single thread computation time increases linearly with increasing particle number, as expected. TBB and OMP perform better than single thread and show a more exponential growth at the beginning, which becomes linear above one hundred thousand particles. The behavior on GPU shows a relatively constant computing time from 1,000 to 40,000 particles, a small step from 40,000 to 100,000 particles, which above them increases constantly, which is again the expected behavior in GPU (which has the largest number of threads to be filled).
Another performance test performed has been the variation of computing time with a fixed number of carriers but a different number of bunches in which they have been divided. For this test, a TCoDe probe-energy deposit of 100,000 particles was generated at half distance between diode and ohmic trench of the TimeSPOT sensor. This deposit was performed multiple times, increasing the number of equivalent charges in one single bunch (10, 100, 1,000, and 10 ,000 particles). Results are displayed in Figure 11, showing excellent performances also in single thread, which takes the lead below 100 bunches.
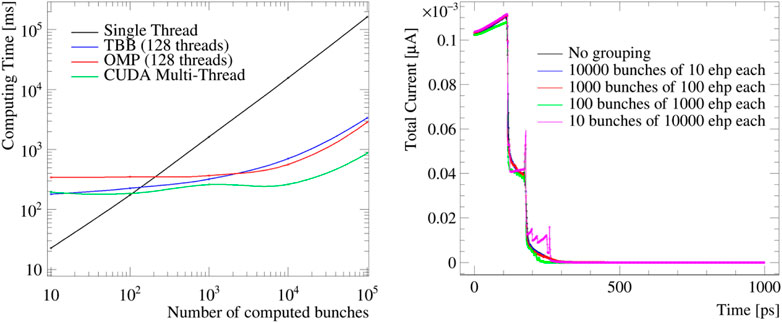
FIGURE 11. Effects on computing time (left plot) and signal shape by grouping the energy deposits in bunches.
The quality of the produced signal was also compared with increasing bunches. In this case, the right plot of Figure 11 shows the results of the single thread computation. It is worthy to mention how, with reduced number of particles, some details are lost but properties such as signal amplitude, total collected charge, and charge collection time are preserved (local spikes observed at only 10 computed particles are associated with the physics of the sensor). A direct comparison of the signals generated using grouping (Figure 11) shows that the signals are very similar to the original one, suggesting that grouping deposits in few large bunches can be a solution for cases where speed is strongly preferred over precision. It has to be noted that, although the above performance tests have been performed on a relatively high-end machine, TCoDe can comfortably run on laptops with more than reasonable performance (with an obvious price to pay in performance). This is very convenient when there is a need to quickly check a few simulations and tune the parameters or have a graphical representation of what is happening within the sensor (via the animated gif).
4.2 Convolution in TFBoost
The main performance optimization in TFBoost development has been done by implementing the convolution computation using the FFT-based algorithm, exploiting the Hydra multi-threading that allows to parallelize the functors sampling and FFT multiplication. Figure 12 shows the convolution performance as a function of the number of OMP threads and as a function of sample size for different target architectures. The values reported in the plots are obtained by performing 10 iterations per point and by averaging the last eight computation times, thus discarding the first two in which the internal resources are allocated (lazy-loading and lazy-initialization). From the results, it is worth noting that the time-based convolution algorithm, commonly used in electronics simulation software, shows good performance only with a very limited number of signal samples. For signals with a number of points larger than 1,000, the computation becomes nearly impracticable
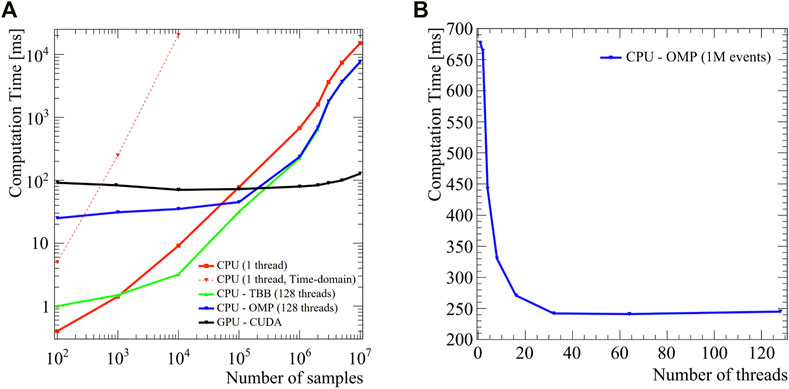
FIGURE 12. Computation time of the convolution algorithms in TFBoost. (A) Computation time as a function of the number of signal samples for different backends. (B) Computation time using the OMP backend as a function of the number of threads, for a sample statistics of 106.
Prospects
Both TCoDe and TFBoost heavily rely on the Hydra library and therefore share a highly similar core architecture. Moreover, they have been developed both within the TimeSPOT collaboration to simulate silicon and diamond 3D sensor performance. It is natural that both projects will converge into a single one in the near future and more features will be added at this stage. The authors are currently working toward this goal.
Data Availability Statement
The original contributions presented in the study are included in the article/Supplementary Material, further inquiries can be directed to the corresponding author.
Author Contributions
AC and AL developed TCoDe starting from 2019 to overcome the limitation of existing commercial tool for detector response simulation, both in terms of speed and detail. TCoDe has been already presented at conferences and attracted interest also from outside the TimeSPOT collaboration. DB and GC developed TFBoost starting from 2020 to exploit the advantages of modern multithreaded computing in simulation of front end response. TFBoost has been proven to be an invaluable tool to understand the performances of TimeSPOT sensors. All authors based their code on the Hydra library and therefore close collaboration and interplay between the two packages occurs daily. Finally, all authors plan to merge the two software packages into a single one in the near future.
Funding
This work was supported by the Italian National Institute for Nuclear Physics (INFN), in particular by its fifth Scientific Commission (CSN5) through the TimeSPOT project and by the ATTRACT-EU initiative INSTANT project.
Conflict of Interest
The authors declare that the research was conducted in the absence of any commercial or financial relationships that could be construed as a potential conflict of interest.
Publisher’s Note
All claims expressed in this article are solely those of the authors and do not necessarily represent those of their affiliated organizations, or those of the publisher, the editors, and the reviewers. Any product that may be evaluated in this article, or claim that may be made by its manufacturer, is not guaranteed or endorsed by the publisher.
Footnotes
1For a non-tensorial grid, the total number of point cannot be factorized, but the number of operations would be of the same order of magnitude
References
4. Dagum L, Menon R. OpenMP: an Industry Standard API for Shared-Memory Programming. IEEE Comput Sci Eng (1998) 5:46–55. doi:10.1109/99.660313
5. Nickolls J, Buck I, Garland M, Skadron K. Scalable Parallel Programming with CUDA. Queue (2008) 6:40–53. doi:10.1145/1365490.1365500
6.D Padua, editor. TBB (Intel Threading Building Blocks). Boston, MA: Springer US (2011). p. 2029. doi:10.1007/978-0-387-09766-4\\text{\\_}2080
CrossRef Full Text | Google Scholar\\text{\\_}2080
7.Lai A. First Results of the Timespot Project on Developments on Fast Sensors for Future Vertex Detectors. Nucl Instr Methods Phys Res Section A: Acc Spectrometers, Detectors Associated Equipment 981 (2020) 164491. doi:10.1016/j.nima.2020.164491
8. Anderlini L, Bellini M, Bizzeti A, Cardini A, Ciaranfi R, Corsi C, et al. Fabrication and Characterisation of 3D Diamond Pixel Detectors with Timing Capabilities. Front Phys (2020) 8:589844. doi:10.3389/fphy.2020.589844
9. Anderlini L, Aresti M, Bizzeti A, Boscardin M, Cardini A, Betta G-FD, et al. Intrinsic Time Resolution of 3D-Trench Silicon Pixels for Charged Particle Detection. J Inst (2020) 15:P09029. doi:10.1088/1748-0221/15/09/p09029
10. Brundu D, Cardini A, Contu A, Cossu GM, Dalla Betta G-F, Garau M, et al. Accurate Modelling of 3d-Trench Silicon Sensor with Enhanced Timing Performance and Comparison with Test Beam Measurements. J Inst (2021) 16:P09028. doi:10.1088/1748-0221/16/09/p09028
11. Loi A, Contu A, Lai A. Timing Optimisation and Analysis in the Design of 3d Silicon Sensors: the TCoDe Simulator. J Inst (2021) 16:P02011. doi:10.1088/1748-0221/16/02/p02011
12. Synopsys . Synopsys Sentaurus Tcad. Software, Synopsys (2015). https://www.synopsys.com/silicon/tcad.html.
13. de Vahl Davis G, Mallinson GD. An Evaluation of Upwind and central Difference Approximations by a Study of Recirculating Flow. Comput Fluids (1976) 4:29–43. doi:10.1016/0045-7930(76)90010-4
14. Brun R, Rademakers F ROOT - An Object Oriented Data Analysis Framework. Nucl. Inst. & Meth. in Phys. Res. A. In: Proceeding AIHENP’96 Workshop, September, 1996 (1996), 81–86.
15. Andriano L, Gian MC. High-resolution Timing Electronics for Fast Pixel Sensors. Cagliari, Italy: arXiv (2020).
16. Frigo M, Johnson SG, The Design and Implementation of FFTW3.” In Proc. IEEE Special issue on “Program Generation, Optimization, and Platform Adaptation (2005). p. 216–31. doi:10.1109/jproc.2004.840301
17. Hatlo M. Developments of Mathematical Software Libraries for the LHC Experiments. IEEE Trans Nucl Sci (2005) 52. doi:10.1109/tns.2005.860152
18.Ltspice -Analog Devices (2021). https://www.analog.com/en/design-center/design-tools-and-calculators/ltspice-simulator.html.
19. Vagelis G (2020). Ucsc Single Channel. https://twiki.cern.ch/twiki/bin/view/Main/UcscSingleChannel.
20. Spannagel S, Wolters K, Hynds D, Alipour Tehrani N, Benoit M, Dannheim D, et al. Allpix2: A Modular Simulation Framework for Silicon Detectors. Nucl Instr Methods Phys Res Section A: Acc Spectrometers, Detectors Associated Equipment (2018) 901:164–72. doi:10.1016/j.nima.2018.06.020
21. Hartmann DL. Objective Analysis, Course Notes (2013). https://atmos.uw.edu/∼dennis/552_Notes_ftp.html.
22. Nahman NS, Guillaume ME. Deconvolution of Time Domain Waveforms in the Presence of Noise. Boulder, CO: Electromagnetic Technology Division, National Engineering Laboratory, National Bureau of Standards (1981).
23. Riad SM. The Deconvolution Problem: An Overview. Proc IEEE (1986) 74:82–5. doi:10.1109/proc.1986.13407
24. Cadeddu S, Frontini L, Lai A, Liberali V, Piccolo L, Rivetti A, et al. A 28-nm CMOS Pixel Read-Out ASIC for Real-Time Tracking with Time Resolution below 20 Ps.” In IEEE Nuclear Science Symposium (NSS) and Medical Imaging Conference. Piscataway, NJ: MIC (2020). doi:10.1109/NSS/MIC42677.2020.9507912
Keywords: sensor, tracking, collider, software, simulation, GPU (CUDA), multithread, timing
Citation: Brundu D, Contu A, Cossu GM and Loi A (2022) Modeling of Solid State Detectors Using Advanced Multi-Threading: The TCoDe and TFBoost Simulation Packages. Front. Phys. 10:804752. doi: 10.3389/fphy.2022.804752
Received: 29 October 2021; Accepted: 21 January 2022;
Published: 21 March 2022.
Edited by:
Arianna Morozzi, Istituto Nazionale di Fisica Nucleare di Perugia, ItalyReviewed by:
Marco Mandurrino, National Institute of Nuclear Physics of Turin, ItalyGeetika Jain, University of Delhi, India
Copyright © 2022 Brundu, Contu, Cossu and Loi. This is an open-access article distributed under the terms of the Creative Commons Attribution License (CC BY). The use, distribution or reproduction in other forums is permitted, provided the original author(s) and the copyright owner(s) are credited and that the original publication in this journal is cited, in accordance with accepted academic practice. No use, distribution or reproduction is permitted which does not comply with these terms.
*Correspondence: A. Contu, YW5kcmVhLmNvbnR1QGNhLmluZm4uaXQ=
 D. Brundu
 A. Contu
 G. M. Cossu
 A. Loi
