 Rui Li
 Da Li2
 Zhenyu Fan
 Jiahong Zhang
 Guangjing Xu
94% of researchers rate our articles as excellent or good
Learn more about the work of our research integrity team to safeguard the quality of each article we publish.
Find out more
ORIGINAL RESEARCH article
Front. Phys., 12 January 2023
Sec. Optics and Photonics
Volume 10 - 2022 | https://doi.org/10.3389/fphy.2022.1121633
This article is part of the Research TopicAcquisition and Application of Multimodal Sensing InformationView all 12 articles
The gravity gradient tensor, which has a higher resolution than gravity, is used in a variety of fields, including the discovery of energy resources, auxiliary navigation, and national defense building. Our team has achieved significant advancements in various essential technologies, such as high-resolution accelerometers, and has constructed China’s first self-controllable shipboard gravity gradient measurement system. In the laboratory, accuracy is determined using the mass gravitation technique, static test accuracy of Tuv and Txy is 7.22 E and 3.58 E, while dynamic test accuracy of Tuv and Txy is 9.09 E and 4.16 E. For outfield shipborne test measurement, the internal accord accuracy of Tuv and Txy of the repeat line is MjguMkVANzUwbQ== and MjguOEVANzUwbQ==, and that of the intersection point is MjguMkVANzUwbQ== and MjYuOEVANzUwbQ==. The performance of the system is completely validated by dynamic and static testing, laying the groundwork for the practical implementation of gravity gradient technology.
The gravity gradient is the second-order derivative of the gravity potential and indicates the rate of change of the gravity field vector in three-dimensional space [1], which can better convey the comprehensive information of its field source [2]. The history of gravity gradient measurement dates back to 1886, when Baron von Eötvös devised the gravity gradiometer based on the principle of torsional scale balancing [3], and gravity gradient measurement became the earliest means of oil exploration. Gravity gradient technology is extensively employed in auxiliary navigation, geology and geophysics, geodesy, and other fundamental research domains [4–10] due to technological advancements.
The gravity gradient system based on quartz flexible rotational accelerometer technology is presently the only commercially viable gravity gradient measuring system, such as the Air-FTG and Marine-FTG developed by Bell Geospace (now Lockheed Martin, United States), the Falcon system by BHP (Australia), and the FTGeX by ARKEX (UK). All are rotating accelerometers [11, 12], with an accuracy of around 10 E and varying resolutions depending on the mounting platform (such as airships, aircraft, submarines, etc.). For more than 3 decades, gravity gradiometry has been acquired offshore using marine vessels and onshore using fixed wing aircraft. The data acquired on a slow moving, large ship would be higher quality than data acquired at higher speed on a fixed wing airplane [13, 14].
Some gravity gradiometers with a higher degree of precision, such as the electrostatic levitation gravity gradiometer [15, 16], the superconducting gravity gradiometer [17], and the gravity gradient system based on the principle of atomic interference [18], have also made significant strides and are approaching practicality. For instance, the cold atomic gravity gradiometer developed by the University of Birmingham research team in the United Kingdom has been used to detect underground cavities [19]. After measuring for more than 10 min, the sensitivity can reach 20 E (1 E = 10−9/s2). The units of the gravity gradient are usually in Eotvos E), where 1 E corresponds to a gravitational difference of 10−10 g between two points separated by 1 m.
The China Aero Geophysical Survey and Remote Sensing Center for Natural Resources, and Tianjin Institute of Nautical Instruments have made significant breakthroughs in various key technologies since the beiginning of the 11th Five-Year Plan in year 2006. The resolution of the quartz flexible accelerometer has been increased from
Gravity gradiometers can measure the spatial rate of change in gravitational acceleration. The gravitational field vector is the gradient of the gravitational potential U. In the Cartesian coordinate system, the gravitational gradient tensor T can be defined as follows:
Only five of the nine components of the gravity gradient are independent, as the external gravity field of the earth satisfies the Laplace equation and the gradient tensor is symmetric, whereby Txy = Tyx, Txz = Tzx, Tyz = Tzy, and Txx + Tyy + Tzz = 0.
The main gravity gradiometers that are currently available for mobile platform measurements can be divided into full-tensor gravity gradiometers and partial-tensor gravity gradiometers based on their measurement elements. The core measurement component of a gravity gradiometer is the gravity gradient instrument (GGI). The Air-FTG, which has three sets of GGIs mounted on an inertially stabilized platform, is a typical instrument for full-tensor measurements. The partial-tensor gravity gradiometer, on the other hand, measures either a partial component or a combination of the partial components of the gravity gradient, with the Falcon system being a typical partial-tensor instrument. The principle of our gravity gradiometer is similar to that of the Falcon system, which measures the horizontal components of the gravity gradient tensor (i.e., Tyy - Txx and Txy). The x-, y-, and z-axes of the gravity gradient measurement coordinate system are defined to correspond to the local geographic coordinate system’s E (eastward), N (northward), and U (skyward) coordinates, respectively, whereby Tyy, Txx, an Txy (Txy = Tyx) correspond to TNN, TEE, and TNE, respectively.
The principle of a GGI measurement is illustrated in Figure 1. Four accelerometers, a1–a4, are evenly distributed on a round plate of radius R that is centered at point O and rotates at a specified angular rate. The input axis of the accelerometer is along the tangential direction of the rotation plane and perpendicular to the rotation axis.
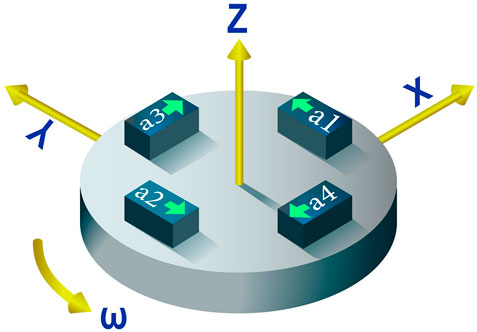
FIGURE.1. Gravity gradient horizontal tensor measurement schematic diagram.
The output of the accelerometers is related to the gravitational gradient as follows [22]:
where
The new shipborne GGMS includes a GGI, inertial stabilization platform, buffer damping unit, temperature control unit, and power supply unit.
The shipboard GGI is the core component of the gravity gradiometer and consists of three major parts: the rotating body, rotating shaft system, and rotating support frame. The high-resolution accelerometer, accelerometer servo circuit board, gravity gradient measurement circuit board, and accelerometer temperature control board are all installed on the rotating body. The shape of the gravity gradient sensor is shown in Figure 2. The rotating body is the mounting base for the accelerometer. The four accelerometers are evenly and symmetrically arranged along the circumference of the rotating body, and centered on the rotation axis.
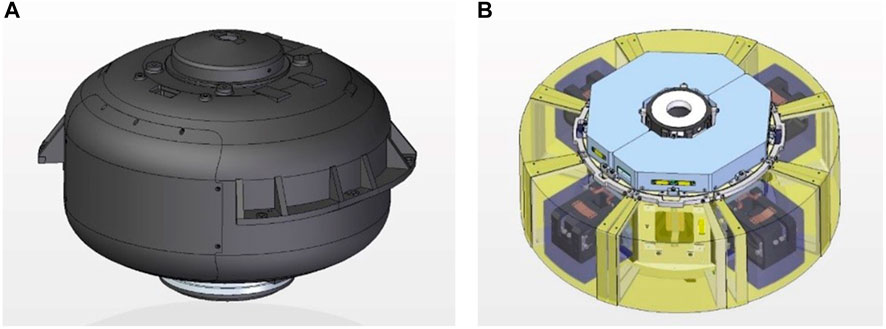
FIGURE 2. GGI (A) and rotating body parts (B).
The inertial stabilization platform (Figure 3) is one of the key components of the system, and its main functions are to house the GGI, isolate the carrier angular motion and track the local geographic coordinate system, and provide a dynamic environment for the gravity gradient sensor to meet the gravity gradiometer requirements. The principal scheme of the stabilized platform adopts the mechanical arrangement scheme of the classical three-loop semi-analytic inertial navigation system. Here the output information of the platform accelerometer, in combination with the initial velocity and position binding information of the carrier, are integrated to solve for the carrier velocity and position, and further solve for the corrected angular velocity, which is required for the stabilized platform to track the geographic coordinate system. This corrected angular velocity is then used to correct the output data of the corresponding fiber optic gyroscope on the platform, and is also applied to the platform through the stabilization loop to make the platform coordinate system track the geographic coordinate system, without accounting for the stabilization loop error, such that the local horizontal north-pointing inertial platform is then realized.

FIGURE 3. Installation structure diagram of inertial stabilization platform and GGI.
The GGI, inertial stabilization platform, buffer shock absorption unit, temperature control unit and power distribution unit, gravity gradient data acquisition and processing system, and motion compensation module with mechanical and electrical interfaces are all connected in the new shipboard GGMS to ensure effective communication and connectivity among the system components, and realize the systematic gravity gradient measurement operation function (Figure 4).
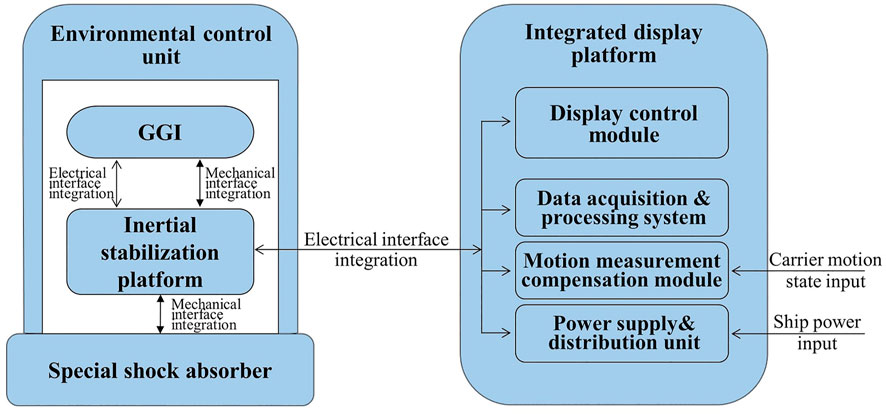
FIGURE 4. Integration scheme of shipboard GGMS.
A laboratory-based static accuracy test was the first performance test conducted after assembling the shipboard GGMS. The static accuracy test employs the mass gravitational excitation method. A mass gravitational uniform gradient field excitation device is used to conduct the test. The mass walls on both sides of the gravity gradiometer are high-density bodies that can generate a uniform gravitational gradient field in the space where the gradiometer is located.
A schematic diagram of the laboratory-based static test is shown in Figure 5. The static working GGMS is in the center, with the two high density mass walls that generate the uniform gravitational gradient excitation positioned on the left and right sides of the GGMS. The two mass walls move along the dotted line to either the center or both sides simultaneously during the test, such that different gravitational gradients can be excited at different positions relative to the spatial position of the GGMS. The static measurement accuracy of the GGMS can be determined by comparing the difference between the theoretical gravitational gradient excitation at two positions and the measured gradient difference of the GGMS.
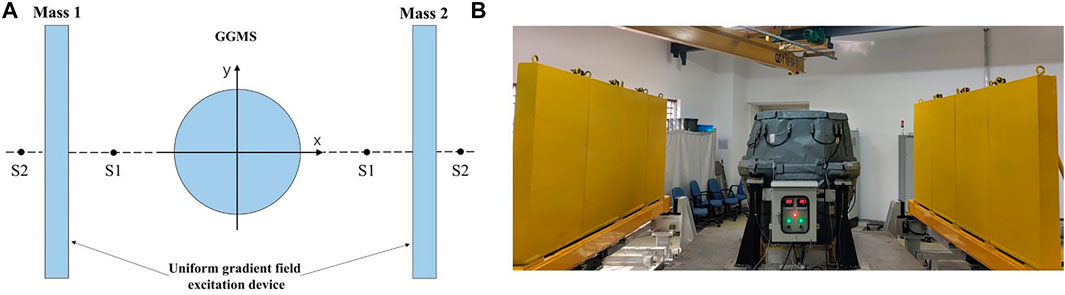
FIGURE 5. Schematic diagram of static accuracy test of GGMS (A) and test scene (B).
The gravitational gradient excitation on the gradiometer, which is produced by two rectangular mass walls at a distance S2 from the distal end and a distance S1 from the proximal end of the gradiometer, can be calculated theoretically [23] by defining Tuv = (Tyy–Txx)/2, such that the variation of the Tuv signal is 224 E and the variation of the Txy signal is 0 E. The mass walls were moved repeatedly (seven times) between the distal and proximal ends during the test experiment. The output signal of the GGMS was recorded continuously for 3 and 20 min at the proximal and distal ends, respectively. The average value within 100 s of system stabilization was taken as the signal output value, and the repeatability of the output signal and accuracy of the difference between the output signals at two positions were counted for each position multiple times to determine the static measurement accuracy of the GGMS. Figure 6 shows the static accuracy test curve of the GGMS, and Tables 1, 2 list the static accuracy test data statistics. The Tuv and Txy measurement accuracies are 7.22 E and 3.58 E, respectively. The results indicate that the static measurement accuracy of the system is better than 7.22 E.
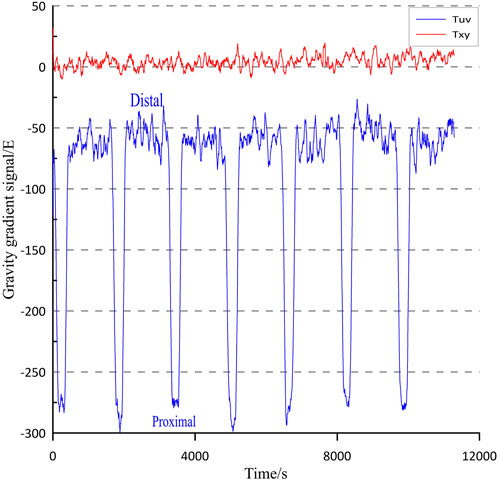
FIGURE 6. Static accuracy test curve of GGMS.
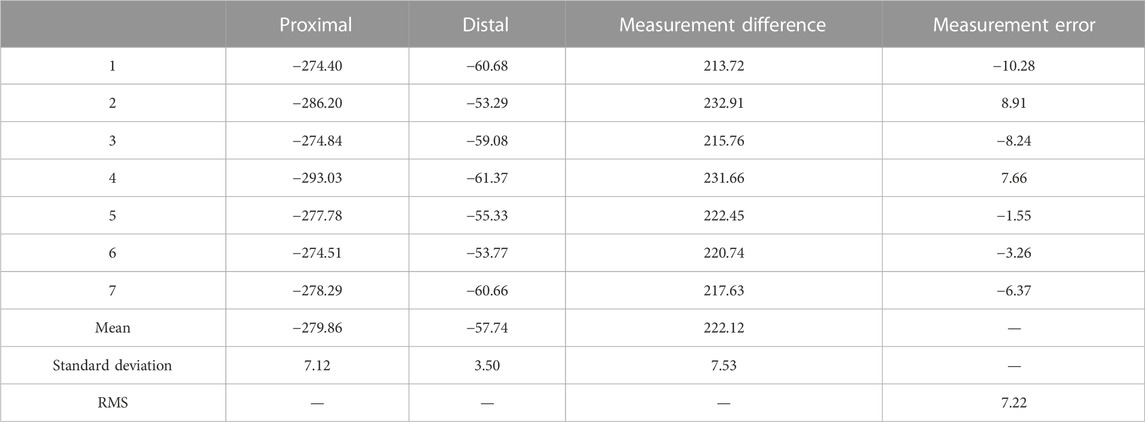
TABLE 1. Statistics of static accuracy test data of GGMS(Tuv).

TABLE 2. Statistics of static accuracy test data of GGMS(Txy).
The laboratory-based dynamic accuracy test of the GGMS was similar to the static test method. However, the GGMS was not stationary during the dynamic accuracy test, but was instead placed on a motion simulation platform to simulate the swaying motion of a ship. The test site is shown in Figure 7.
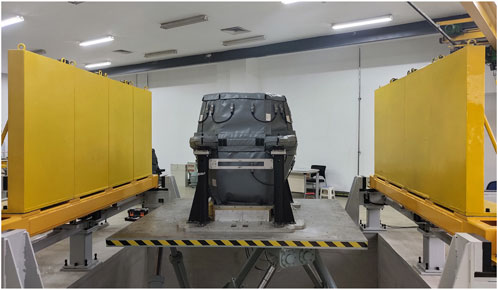
FIGURE 7. Dynamic accuracy test on swaying platform.
The moving process and resting position of the mass body were the same as those in the laboratory-based static test, and the stationary measurement times at the distal and proximal ends were both 6 min. A motion simulation table simulated the swaying motion for both large and medium-sized ships under four sea-state levels during the test. The swaying spectrum is shown in Table 3. Figure 8 shows the dynamic accuracy test curve of the GGMS, and Tables 4, 5 list the data statistics of the dynamic accuracy test. The measurement accuracy of the GGMS is better than 9.09 E for external gradient excitation changes.
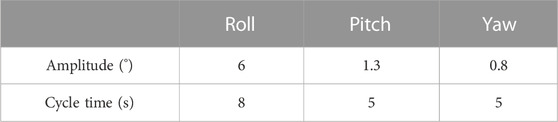
TABLE 3. Dynamic test sway spectrum of GGMS.

FIGURE 8. Dynamic accuracy test curve of GGMS.

TABLE 4. Statistics of dynamic accuracy test data of GGMS(Tuv).
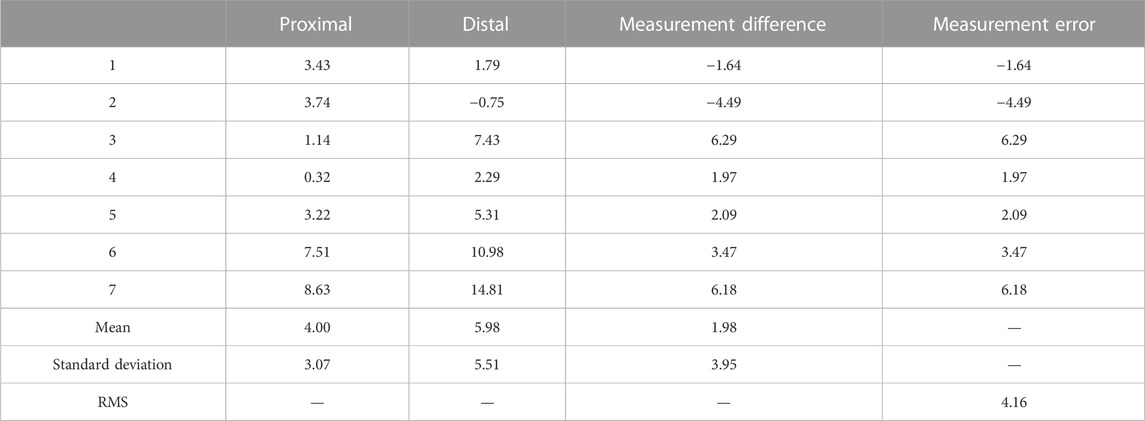
TABLE 5. Statistics of dynamic accuracy test data of GGMS(Txy).
After laboratory tests were completed, we then placed the shipboard GGMS into a removable container to form a mobile laboratory for easy transportation and installation. The temperature and humidity in the mobile laboratory were controlled within a certain range to provide a stable external environment for the gravity gradiometer. We fixed the mobile laboratory on the deck of the ship, and completed the first shipboard sea test in the offshore waters of the Yellow Sea of China.
The survey network consisted of a 5 line × 5 line grid, with one north–south line (SN04#) selected for three round-trip repeat measurements, one north–south line (SN03#) for one round-trip repeat measurement, and one east–west line (EW04#) for one round-trip repeat measurement. The line spacing was 5 km, with the north–south and east–west lines being 30 and 40 km in length, respectively. The ship speed was 10 knots (1 knot ≈1.852 km/h) during the test. The locations of the test survey network and intersection points are shown in Figure 9.
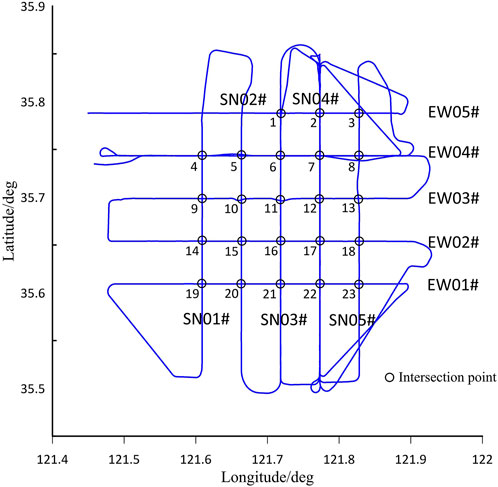
FIGURE 9. Location map of sea trial survey network and intersection points.
The obtained test data included the original output data of the gravity gradient sensor, which were acquired at a continuous sampling rate of 800-Hz; the output motion information data of the inertial measurement unit on the stable platform, which were acquired at a continuous sampling rate of 800-Hz; the attitude data of the ship, which were acquired at a continuous sampling rate of 200-Hz using external fiber-optic rosettes; and GPS position data, which were acquired at a continuous sampling rate of 100-Hz. The walk-away measurement mode was adopted during the shipborne test, with the part of the navigation path that possessed a uniform speed and straight heading selected as an effective measurement line.
The output motion information data of the inertial measurement component on the stabilized platform were used during the data processing to compensate the original output data of the GGI for vertical motion, demodulation of the gravity gradient signal, horizontal angular velocity compensation, and self-gradient compensation. The gravity gradient measurement data results were then obtained after lowpass filtering the compensated gravity gradient output data with a cutoff frequency of 1/300 Hz (equivalent spectral resolution of 750 m [24]). The data processing flow chart is shown in Figure 10.

FIGURE 10. Data processing flowchart of GGMS.
The gravity gradient data from the repeated line measurements in the survey network were compared for internal conformity, and the corresponding accuracy index was calculated based on the existing gravity measurement repetition line evaluation method [25]. The root mean square (RMS) error of the measurement line intersection discrepancy value was taken as the main evaluation criterion to measure the accuracy of the gravity gradiometer. To ensure that the order in which the figures appear is consistent with the text, the highlighted text is modified as follows, The internal accord accuracy for the Tuv and Txy components of the repetition line of SN03 were 23.2 E@750m and 20.4 E@750m, respectively (Figures 11 A, B). The internal accord accuracy for the Tuv and Txy components of the repetition line of EW04 were 23.4 E@750m and 20.8 E@750m, respectively (Figures 11 C, D). Three of six repetitive measurements were performed along the SN04# survey line in this sea trial, as shown in Figure 9. Because of high data noise of three repetition lines of SN04, the internal accord accuracy for the Tuv and Txy components of the other three repetition line were MjguMkVANzUwbQ== and MjguOEVANzUwbQ==, respectively (Figures 11 E, F).
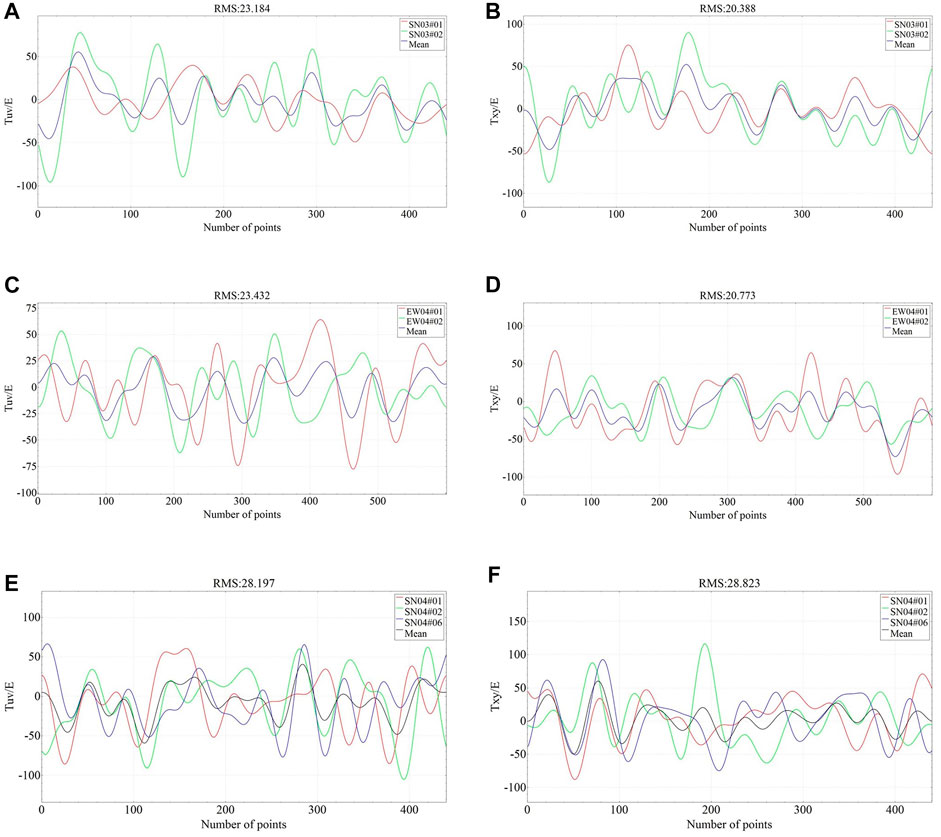
FIGURE 11. (A–F) Tuv and Txy component of Repeat line internal accord accuracy chart.
As shown in the Figure 11, in general, the internal accord accuracy of the Txy is higher than that of Tuv. Although the characteristics and change trends of some measurement curve lines are not very similar especially in Figures 11C, E, we believe this is a signal distortion caused by noise in the data, that is, there is still a lot of work to be done in improving the signal-to-noise ratio of the data, including updating data processing methods, especially in the optimization of dynamic compensation algorithm.
The grid measurement accuracy was evaluated based on the mean squared difference of the residuals at the intersections of the survey and tie lines:
where
There were 23 valid intersection points according to the survey grid shown in Figure 9. Survey lines SN01# and SN02# were curved before the start of EW05#, resulting in a reduced accuracy during the lowpass filtering process; these intersection points were therefore excluded from the evaluation. The accuracies of the Tuv and Txy measurements are MjguMkVANzUwbQ== and MjYuOEA3NTBt, respectively. A statistical chart of the gravity gradient difference values at the intersection points is shown in Figure 12.
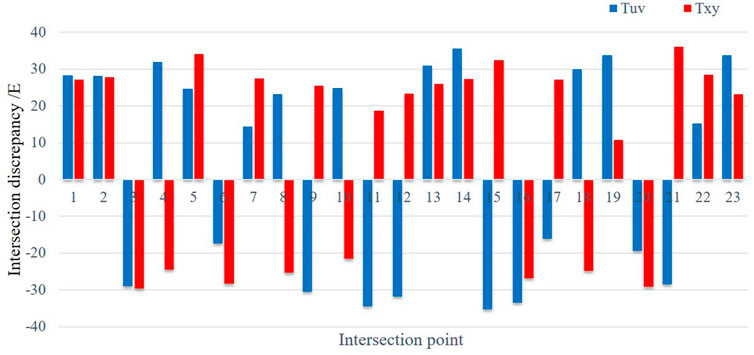
FIGURE 12. Statistics of discrepancy values at the intersection points.
The working principle of a new shipboard GGMS was fully verified after a series of static and dynamic tests, and shipboard sea trials. The Tuv accuracies of the laboratory-based static test, laboratory-based dynamic test on a shaking table, and shipborne sea trial under dynamic conditions were better than 7.22 E, 9.09 E, and MjguMkVANzUwbQ==, respectively, and the Txy were better than 3.58 E, 4.16 E and MjguOEVANzUwbQ==, respectively. The precision index of our shipboard GGMS reached the same order of magnitude as those of existing commercial instruments.
Next, we will continue to improve the hardware level of this system to enhance the accelerometer resolution, and make the system more compact and light-weight. We will also improve the signal-to-noise ratio and measurement accuracy of measurement data by upgrading and optimizing the motion compensation algorithms. We note that we only use the internal accord accuracy as the evaluation index in this paper since there are no other gravity data in the measurement area. The next step is to conduct an evaluation of external accord accuracy, in combination with the existing gravity data, and develop a measurement calibration method for gravity gradient measurements, which will improve the ability to verify the accuracy index of the instrument.
The raw data supporting the conclusions of this article will be made available by the authors, without undue reservation.
JZ and QS contributed to conception of the study. All authors have made a substantial contribution to the study and approved the submitted version.
The authors thank the China Geological Survey Project of China Geological Survey (DD20191004) and Cooperation Research and Demonstration Application of Monitoring Technologies for the Snow, Glaciers and Geohazards in High Mountain Asia and Arctic (21YFE0116800).
The authors declare that the research was conducted in the absence of any commercial or financial relationships that could be construed as a potential conflict of interest.
All claims expressed in this article are solely those of the authors and do not necessarily represent those of their affiliated organizations, or those of the publisher, the editors and the reviewers. Any product that may be evaluated in this article, or claim that may be made by its manufacturer, is not guaranteed or endorsed by the publisher.
2. Li X. Vertical resolution: Gravity versus vertical gravity gradient. The Leading Edge (2001) 20(8):901–4. doi:10.1190/1.1487304
3. Bell RE. Gravity gradiometry. Scientific Am (1998) 278(6):74–9. doi:10.1038/scientificamerican0698-74
4. Evstifeev MI. The state of the art in the development of onboard gravity gradiometers. Gyroscopy and Navigation (2017) 8(1):68–79. doi:10.1134/S2075108717010047
5. Difrancesco D, Meyer T, Christensen A, Fitzgerald D. Gravity gradiometry–today and tomorrow. 11th SAGA Biennial Technical Meeting and Exhibition (2009) doi:10.3997/2214-4609-pdb.241
6. Ji B, Liu M, Lv L, Bian SF. Application of gradiometer to underwater safe navigation. Hydrographic Surv charting (2010) 30(4):23. doi:10.3969/j.issn.1671-3044.2010.04.007
7. Beiki M, Pedersen LB. Eigenvector analysis of gravity gradient tensor to locate geologic bodies. Geophysics (2010) 75(6):I37–I49. doi:10.1190/1.3484098
8. Yang J, Jekeli C, Liu L. Seafloor topography estimation from gravity gradients using simulated annealing. J Geophys Res Solid Earth (2018) 123:6958–75. doi:10.1029/2018JB015883
9. Fan D, Li S, Li X, Yang J, Wan X. Seafloor topography estimation from gravity anomaly and vertical gravity gradient using nonlinear iterative least square method. Remote Sensing (2020) 13(1):64. doi:10.3390/rs13010064
10. Dransfield MH. Airborne gravity gradiometry in the search for mineral deposits. In: B Mikereit, editor. Proceedings of exploration 07: Fifth decennial international conference on mineral exploration (2007). p. 341.
11. Shu Q, Zhou JX, Yin H. Present research situation and development trend of aviation gravity gradiometer. Geophys Geochemical Exploration (2007) 31(12):485.
12. Murphy CA, Mumaw GR. 3D full tensor gradiometry: A high resolution gravity measuring instrument resolving ambiguous geological interpretations. ASEG Extended Abstr (2004) 1:1–4. doi:10.1071/aseg2004ab104
13. Mims J, Selman D, Dickinson J, Murphy C, Mataragio J. Comparison study between airborne and ship-borne full tensor gravity gradiometry (FTG) data. SEG Expanded Abstracts (2009). doi:10.1190/1.3255906
14. Roth M. Marine full tensor gravity gradiometry data analysis and euler deconvolution. Stuttgart: University of Stuttgart (2009). p. 50.
15. Rummel R, Yi W, Stummer C. GOCE gravitational gradiometry. J Geodesy (2011) 85(11):777–90. doi:10.1007/s00190-011-0500-0
16. Wu Q, Teng YT, Zhang B, Zhang T. The research situation of the gravity gradiometer in the world. Geophys Geochemical Exploration (2013) 22(5):761. doi:10.11720/j.issn.1000-8918.2013.5.01
17. Aravanis T, Chen J, Fuechsle M, Grujic M, Johnston P, Kok Y, et al. VK1TM — a next-generation airborne gravity gradiometer. ASEG Extended Abstr (2016) 1:1–5. doi:10.1071/ASEG2016ab318
18. Yang GD, Weng KX, Wu B, Cheng B, Lin Q. Research progress of quantum gravity gradiometer. Navigation Positioning and Timing (2021) 8(2):18. doi:10.19306/j.cnki.2095-8110.2021.02.003
19. Stray B, Lamb A, Kaushik A, Vovrosh J, Rodgers A, Winch J, et al. Quantum sensing for gravity cartography. Nature (2022) 602(7898):590–4. doi:10.1038/s41586-021-04315-3
20. Shu Q. Research on airborne gravity gradient measurement technology. Jilin: Jilin University (2018). p. 163.
21. Meng Z, Yang Y, Li Z. Development of airborne gravity gradiometer based on a quartz flexible accelerometer. Acta Geologica Sinica - English Edition (2019) 93(S1):352–64. doi:10.1111/1755-6724.14133
22. Yang Y, Li D, Gao W. Output signal demodulation and filter for rotating accelerometer gravity gradiometer[J]. J Chin Inertial Technol (2016) 24(6):701. doi:10.13695/j.cnki.12-1222/o3.2016.06.001
23. Luo Y, Yao CL. Theoretical study of rectangular magnetic fields and their gradient-free analytic singularity expressions. Oil Geophys Prospecting (2007)(06) 714.
24. Sun ZM, Xia ZR. Design of fir lowpass differentiator and its applications in airborne gravimetry. Chin J Geophys (2000) 43(6):897–903. doi:10.1002/cjg2.106
Keywords: shipborne, quartz flexible rotational accelerometer, gravity gradiometer, gravity gradient measurement, internal accord accuracy
Citation: Li R, Li D, Shu Q, Fan Z, Lu K, Zhou J, Zhang J and Xu G (2023) Experimental analysis of the performance of a new shipboard gravity gradient measurement system. Front. Phys. 10:1121633. doi: 10.3389/fphy.2022.1121633
Received: 12 December 2022; Accepted: 29 December 2022;
Published: 12 January 2023.
Edited by:
Huadan Zheng, Jinan University, ChinaReviewed by:
Cai Tijing, Southeast University, ChinaCopyright © 2023 Li, Li, Shu, Fan, Lu, Zhou, Zhang and Xu. This is an open-access article distributed under the terms of the Creative Commons Attribution License (CC BY). The use, distribution or reproduction in other forums is permitted, provided the original author(s) and the copyright owner(s) are credited and that the original publication in this journal is cited, in accordance with accepted academic practice. No use, distribution or reproduction is permitted which does not comply with these terms.
*Correspondence: Jiahong Zhang, YWdyc196aGFuZ0AxNjMuY29t; Guangjing Xu, YmR4Z2pAMTYzLmNvbQ==
Disclaimer: All claims expressed in this article are solely those of the authors and do not necessarily represent those of their affiliated organizations, or those of the publisher, the editors and the reviewers. Any product that may be evaluated in this article or claim that may be made by its manufacturer is not guaranteed or endorsed by the publisher.
Research integrity at Frontiers
Learn more about the work of our research integrity team to safeguard the quality of each article we publish.