 Pengjun Zhang
 Wei Jin
 Yunfei Lyu
95% of researchers rate our articles as excellent or good
Learn more about the work of our research integrity team to safeguard the quality of each article we publish.
Find out more
BRIEF RESEARCH REPORT article
Front. Phys. , 10 January 2023
Sec. Optics and Photonics
Volume 10 - 2022 | https://doi.org/10.3389/fphy.2022.1115544
This article is part of the Research Topic Miniaturized High-Power Solid-state Laser and Applications View all 23 articles
The inner surface defects can be displayed intuitively by measuring the geometric parameters of rifling of the artillery barrel. In this paper, the parameters of the barrel bore were scanned based on the high-precision laser, and the three-dimensional reconstruction of the bore shape was conducted based on the test data. The wavelet transform was used for multiple de-noising of the test data, and the Delaunay triangulation interpolation algorithm was used to reconstruct the three-dimensional contour structure of the barrel bore, forming a high-fidelity measurement strategy for the parameters of the barrel bore. The results show that this measurement strategy can achieve the high-precision measurement of the geometric parameters of barrel rifling, and the accuracy can reach .001 mm. By comparing the measured value of rifling with the standard value, the flaw points in the rifling of the birth tube can be accurately specified. The three-dimensional model reconstruction based on the massive sample data realizes the high-fidelity measurement of rifling geometric parameters. This measurement strategy can provide support for the visualization of barrel rifling and effectively improve the detection accuracy of the barrel bore.
As the key component of artillery, the surface quality of the artillery barrel has an important influence on the firing accuracy, service life, projectile velocity, and other tactical and technical indicators [1]. The traditional barrel bore detection method mainly depends on the detection machinery to identify the relevant technical personnel use endoscope for defect detection. This detection method is not only time-consuming and labor-intensive, with detection accuracy, reliability, and low degree of automaton, but also the operator has certain technical requirements, and the subjective error is very large [2, 3]. With the development of photoelectric technology, sensor technology, image processing, computer technology, precision machinery technology, and electrical control technology, the detection technology of the barrel is also constantly improving. The current detection methods are mainly attributed to two categories. One is the contact measurement, such as the air plug gauge method. This kind of method is relatively mature, and the measurement time is short. It is mainly used in factory production detection, but it also has the disadvantage of low accuracy so that it cannot be widely applied [4, 5]. The other is the non-contact measurement, which uses optical scanning and reflection methods. Non-contact measurement methods include the CCD camera detection method, laser projection detection method, and laser triangulation method [6].
1) CCD camera detection method: This method uses the projection head in the barrel bore surface-projected aperture orthogonal to its axis, and then, the CCD camera is used to image the aperture; then, the image was used after relevant calculation to detect the barrel bore size [7, 8]. The advantages of the CCD camera detection method are high detection accuracy and fast image processing speed. The disadvantage is that the aperture must be imaged in the imaging area, and there are strict requirements on the focal length; otherwise, the detection accuracy will be greatly reduced.
2) Laser projection method: The annular laser emitted by the laser emitter in the laser projection detection system is reflected and projected onto the barrel bore to form an annular light spot. The light spot is then reflected by another mirror, and the receiving lens forms an optical image ring on the CCD. The image size of a section of the barrel can be obtained by processing the ring [9, 10]. When the detection system moves along with the barrel diameter, the size of the whole barrel can be measured. Although this detection method has high detection accuracy, the disadvantage is low detection efficiency [11].
3) Laser triangulation detection method: When the light source emitted by the semiconductor laser is illuminated to the surface of the inner wall of the barrel, the distance between the light source and the surface of the inner wall of the barrel is different, the angle of light reflection will be changed, and its imaging position on the linear CCD array of the laser displacement sensor will be changed synchronously [12, 13]. The advantages of the laser triangulation method are simple structure, a small measurement point, small shape, strong anti-interference ability, high measurement accuracy, and continuous measurement. However, the disadvantage is that the installation and debugging are relatively complicated [14].
The research purpose of this paper is to establish the artillery barrel bore detection system based on multi-laser sensor fusion. The system adopts the design method of combining the laser displacement sensor and laser range finder with an automatic feed device. According to the principle of the laser triangulation test, the experiment was carried out for an artillery barrel.
The laser triangulation method is a measurement method designed by using the stability of the laser source and the propagation characteristics of the laser. The laser beam emitted by the laser is reflected on the surface of the measuring object, and the reflected light falls on the receiving surface through the mirror. The position of the falling spot will change with the distance between the laser and the measuring object, and the measuring distance can be calculated according to the falling point [15].
A laser is placed above the surface of the measured object, and the laser emits a beam to the measured surface through the condenser lens. Some of the laser will diffuse because the surface cannot be absolutely smooth. A lens is placed in front of the photodetector for imaging convergence, and the diffusely reflected laser will converge to a spot on the optical sensor. When the measured object is reversed, the spot will shift [16]. According to the displacement value, the angle θ between the incident laser and the divergent laser, the image distance L1 and the object distance L2, and the displacement value of the measured surface can be obtained. The relevant microprocessor is used to calculate and obtain the numerical results. The laser triangulation test diagram is shown in Figure 1.
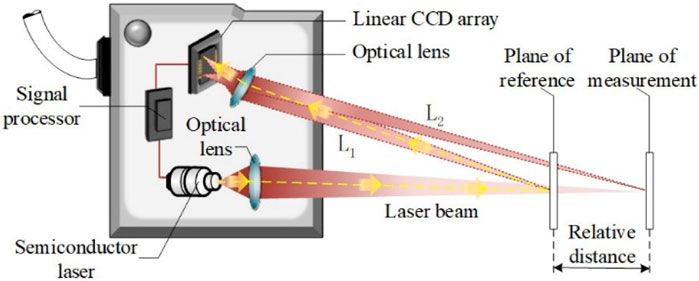
FIGURE 1. Laser triangulation test principle diagram.
The bore detection system uses the laser displacement sensor and laser range finder to collect the axial and radial data. Due to the measurement accuracy of the sensor and the vibration of the test equipment in the process of movement and other factors, the acquisition signal will be interfered, affecting the measurement accuracy of the data. Therefore, it is necessary to denoise the collected signal to reduce or eliminate the influence of the noise signal on the original signal and, thus, improve the measurement accuracy of the system.
For the noise signal caused by the measurement accuracy of the sensor and the vibration in the acquisition process, the signal is usually denoised by filtering. In this paper, the wavelet transform of the ordered point filtering is used as the noise reduction method of system error. Wavelet transform is a new numerical analysis method based on the short-time Fourier transform (STFT) [17]:
where
The approximate expansion of the wavelet transform is shown as follows:
where
The mother wavelet and father wavelet jointly determine the function of the wavelet transform, and the complete expansion is shown as follows:
where
where
Their relationship is described by the following equation:
In this paper, the wavelet base used in the wavelet transform is a function, and the approximate wavelet coefficients and detail wavelet coefficients under scale 3 are extracted. Then, the threshold of each layer is selected by using the unbiased likelihood estimation principle of the stein, and the threshold size is set to obtain the filtered data.
The width and depth of the filtered barrel rifling are collected and drawn into a curve. The standard barrel is tested, and the data on a certain section of the barrel are collected, as shown in Figure 2.
1) Width calculation
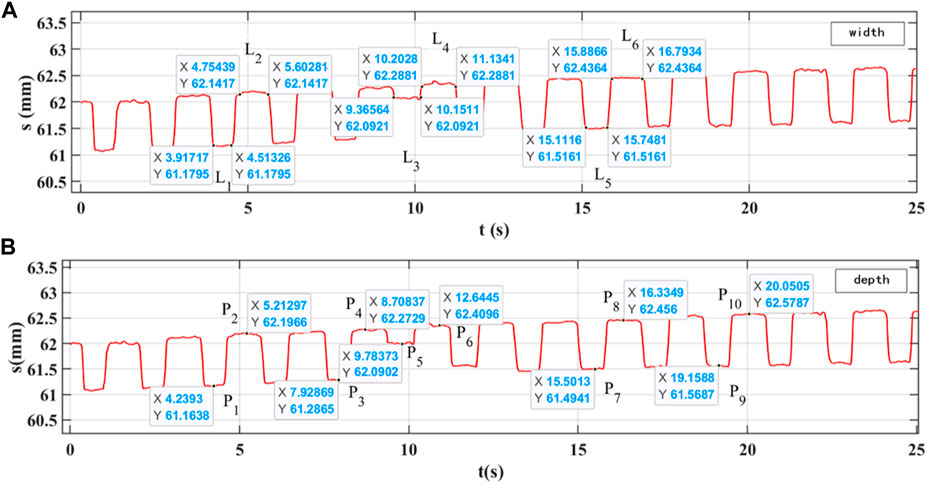
FIGURE 2. Barrel bore contour curve diagram. (A) Width of rifling. (B) Depth of rifling.
Assuming that two points M1(x1,y1) and N1(x2,y1) are taken on the continuous negative line and the positive line, the width calculation formula of the hatching and the width rifling rib is
The width value of the rifling rib L1 is 3.818 mm, L3 is 5.104 mm, and L5 is 5.104 mm; the width value of hatching L2 is 6.045 mm, L4 is 6.072 mm, and L6 is 5.924 mm.
2) Depth calculation
Collect the cross-sectional view of the barrel and measure several points at different positions on the continuous hatching and rifling rib and then calculate the depth value. The depth value of L1 and L2 is 1.033 mm, the depth value of L3 and L4 is .975 mm, and the depth value of L4 and L5 is .319 mm.
The width and depth of the processed and calculated rifling are compared with the standard parameters. The standard width of hatching is
Comparing the width test value with the standard parameters, the rifling rib L3 shows the abnormal data. The width test value and depth test value of the other hatching and rifling rib are within the standard value error range. Finally, the test value can be accurate to .001 mm .
3) Defect calculation
It is a rifling diagram of the barrel, and the rifling rib in this position is abrasion. The section where the position is measured and the rifling diagram is obtained is shown in Figure 3.
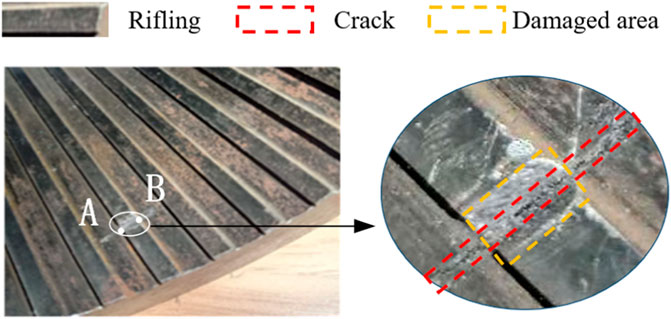
FIGURE 3. Bore flaw diagram.
In Figure 3, the coordinates of points A and B are A (9.366, 62.092) and B (10.151, 62.092) respectively; according to Eq. 8, the distance between the width of the defect is 5.104 mm. The depth value measured is .319 mm, and the standard rifling depth is .98 mm. We can calculate the wear depth of the defect is .661 mm.
The flexibility of the mesh surface reconstruction method is sufficient. For simple or complex surfaces, triangles or their variant forms can be used to fit and express. This method has strong versatility, which can be used across platforms for different fitting requirements, and it has become a common method in the 3D surface reconstruction [19]. The triangle is the smallest unit that represents a surface. Any surface can be decomposed into numerous small triangle surfaces. Therefore, this technique, as the triangulation method, is used commonly in mesh generation. There are many algorithms in the triangulation method, and Delaunay triangulation is one of them [20].
In this paper, the laser is used to scan the bore of the barrel in the radial direction to obtain the data on the profile of the bore at a certain cross-section position. Scanning multiple cross-sections of the barrel repeatedly along the axial direction to obtain the data from multiple profiles, then the data on multiple profiles are processed by three-dimensional data conversion. A function is used for three-dimensional drawing, and the specific steps are as follows:
1) Reading the data to be reconstructed and correcting by using the cosine theorem.
2) De-noising of the corrected data by the wavelet transform.
3) Coordinate conversion of the denoised data, converting polar coordinates into rectangular coordinates,
4) Taking the data collected by the laser range finder as the value of the z axis, the z vector of the z axis is formed, and it can obtain the coordinate value of the three-dimensional space (x, y, and z).
5) Drawing the three-dimensional curved figure of the tube bore after noise reduction.
6) Delaunay triangulation of x, y, and z vectors to form a new point set DT.
7) Drawing a 3D surface graph through a surface construction function.
8) A three-dimensional curved surface of the artillery barrel can be obtained by color filling with the shading function.
It can be seen from Figure 4 that the surface model of the barrel bore can be obtained after the three-dimensional reconstruction of the barrel bore based on Delaunay triangulation. After the local amplification, the flaws and defects of the barrel bore can be discovered and judged intuitively, which is mutually supported by the defects calculated by the two-dimensional curve, and provides visual support for the inner bore detection data.
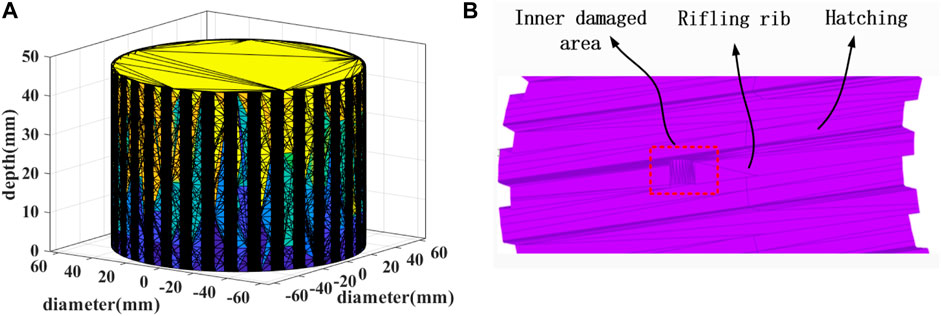
FIGURE 4. Three-dimensional reconstruction based on Delaunay triangulation. (A) Section of the barrel reconstruction model. (B) Damaged area reconstruction.
Based on the principle of the laser triangulation method, this paper studies the test technique of geometric parameters of the barrel bore. We performed laser scanning measurements on the actual barrel damage characteristics and reconstructed the three-dimensional model. The conclusion is as follows:
1) According to the principle of the laser triangulation test, the geometric parameters of rifling width, depth, and inner radius are extracted by the high-precision laser test method. The data measured can achieve a .001 mm level of accuracy. We obtained the data after noise reduction and the reconstructed artillery barrel contour curve.
2) The geometric parameters of the barrel bore are extracted and analyzed. By comparing the test values with the standard values, the defects of the barrel are accurately restored, and the quantitative non-destructive testing of defects is effectively solved.
3) The Delaunay triangulation algorithm is used to transform multiple contour data and changes the three-dimensional reconstruction of the barrel surface, which can realize the intuitive expression of the structure and defects of the barrel.
The original contributions presented in the study are included in the article/Supplementary Material; further inquiries can be directed to the corresponding author.
PZ suggested a detection technology route based on the laser measurement of the barrel parameters and studied multiple noise reduction of the experimental data by the wavelet transform. In addition, the 3D contour structure of the barrel was reconstructed by the Delaunay triangulation interpolation algorithm. WJ analyzed the references in detail, constructed the main content of the manuscript, and was responsible for submission and improvement of the manuscript. He carried out numerical analysis of the collected geometric parameter characteristic curves and reconstructed the barrel 3D model, according to the technical route of this paper. DR established and successfully debugged the experimental system for detecting the internal parameters of the barrel. YL completed all the test items and experimental data collection job, according to the research needs.
This study was funded by the Pre-Researching Key Project of National Defense: 208052020305.
The authors declare that the research was conducted in the absence of any commercial or financial relationships that could be construed as a potential conflict of interest.
All claims expressed in this article are solely those of the authors and do not necessarily represent those of their affiliated organizations, or those of the publisher, the editors, and the reviewers. Any product that may be evaluated in this article, or claim that may be made by its manufacturer, is not guaranteed or endorsed by the publisher.
1. Shen C, Zhou K, Lu Y, Li J. Modeling and simulation of bullet-barrel interaction process for the damaged gun barrel. Defence Tech (2019) 15(6):972–86. doi:10.1016/j.dt.2019.07.009
2. Wu B, Liu B, Zheng J, Wang T, Chen R, Chen X, et al. Strain-based health monitoring and remaining life prediction of large caliber gun barrel. Measurement (2018) 122:297–311. doi:10.1016/j.measurement.2018.02.040
3. Shanmugamani R, Sadique M, Ramamoorthy B. Detection and classification of surface defects of gun barrels using computer vision and machine learning. J Meas (2015) 60:222–30. doi:10.1016/j.measurement.2014.10.009
4. Huang FS, Chen L. CCD camera calibration technology based on the translation of coordinate measuring machine[C]//Applied Mechanics and Materials. Trans Tech Publications Ltd (2014) 568:320–5.
5. Fu X, Zhang Y, Zhang W, Li Q, Kong T. Research on the size of ring forgings based on image detection and point cloud data matching method. Int J Adv Manufacturing Tech (2022) 119(3):1725–35. doi:10.1007/s00170-021-08268-9
6. Choi YK, Pak JH, Seo K, Jeong SM, Lim T, Ju S. Realization of infrared display images using infrared laser projection method. Opt Lasers Eng (2021) 145:106677. doi:10.1016/j.optlaseng.2021.106677
7. Mueller T, Reithmeier E. Image segmentation for laser triangulation based on Chan–Vese model. [J] Meas (2015) 63:100–9. doi:10.1016/j.measurement.2014.12.007
8. Wu C, Chen B, Ye C. Detecting defects on corrugated plate surfaces using a differential laser triangulation method. Opt Lasers Eng (2020) 129:106064. doi:10.1016/j.optlaseng.2020.106064
9. Han Y, Sun H, Lu Y, Zhong R, Ji C, Xie S. 3D point cloud generation based on multi-sensor fusion. Appl Sci (2022) 12(19):9433. doi:10.3390/app12199433
10. Zhang X, Fan F, Gheisari M, Srivastava G (2019). A novel auto-focus method for image processing using laser triangulation[J]. IEEE Access 7.
11. Fu G, Menciassi A, Dario P. Development of a low-cost active 3D triangulation laser scanner for indoor navigation of miniature mobile robots. Robotics Autonomous Syst (2012) 60(10):1317–26. doi:10.1016/j.robot.2012.06.002
12. Wang B, Lan J, Gao J. LiDAR filtering in 3D object detection based on improved RANSAC. Remote Sensing (2022) 14(9):2110. doi:10.3390/rs14092110
13. Yang Y, Zhang Y, Wang Y, Liu D. Design of 3D laser radar based on laser triangulation. KSII Trans Internet Inf Syst (2019) 13(5):2414–33.
14. Son H, Kim C. Automatic segmentation and 3D modeling of pipelines into constituent parts from laser-scan data of the built environment. Automation in Construction (2016) 68:203–11. doi:10.1016/j.autcon.2016.05.010
15. Jung S, Lee YS, Lee Y, Lee K. 3D reconstruction using 3D registration-based ToF-stereo fusion. Sensors (2022) 22(21):8369. doi:10.3390/s22218369
16. Lu X, Schaefer S, Luo J, Low rank matrix approximation for 3D geometry filtering[J]. IEEE Trans Visualization Comp Graphics (2020) 1835–47. doi:10.1109/TVCG.2020.3026785
17. Xie Z, Yu D, Zhan C, Zhao Q, Wang J, Liu J, et al. Ball screw fault diagnosis based on continuous wavelet transform and two-dimensional convolution neural network. Meas Control (2022) 002029402211076. doi:10.1177/00202940221107620
18. Kedzierski M, Fryskowska A. Methods of laser scanning point clouds integration in precise 3D building modelling. [J] Meas (2015) 74:221–32. doi:10.1016/j.measurement.2015.07.015
19. Bhattarai S, Dahal K, Vichare P, Chen W. Adapted Delaunay triangulation method for free-form surface generation from random point clouds for stochastic optimization applications. Struct Multidisciplinary Optimization (2020) 61(2):649–60. doi:10.1007/s00158-019-02385-6
Keywords: laser detection, inner bore, geometric reconstruction, rifling, laser scanning
Citation: Zhang P, Jin W, Ren D and Lyu Y (2023) Measurement and reconstruction of geometric parameters of the barrel bore based on the laser scanning strategy. Front. Phys. 10:1115544. doi: 10.3389/fphy.2022.1115544
Received: 04 December 2022; Accepted: 19 December 2022;
Published: 10 January 2023.
Edited by:
Zhenxu Bai, Hebei University of Technology, ChinaReviewed by:
Qizhi Xu, Beijing Institute of Technology, ChinaCopyright © 2023 Zhang, Jin, Ren and Lyu. This is an open-access article distributed under the terms of the Creative Commons Attribution License (CC BY). The use, distribution or reproduction in other forums is permitted, provided the original author(s) and the copyright owner(s) are credited and that the original publication in this journal is cited, in accordance with accepted academic practice. No use, distribution or reproduction is permitted which does not comply with these terms.
*Correspondence: Wei Jin, ancxNTUzNjMwNTgxNkAxNjMuY29t
Disclaimer: All claims expressed in this article are solely those of the authors and do not necessarily represent those of their affiliated organizations, or those of the publisher, the editors and the reviewers. Any product that may be evaluated in this article or claim that may be made by its manufacturer is not guaranteed or endorsed by the publisher.
Research integrity at Frontiers
Learn more about the work of our research integrity team to safeguard the quality of each article we publish.