 Md. Bellal Hossain
 Jan Kříž2
 Vigneswaran Dhasarathan
94% of researchers rate our articles as excellent or good
Learn more about the work of our research integrity team to safeguard the quality of each article we publish.
Find out more
ORIGINAL RESEARCH article
Front. Phys., 10 January 2023
Sec. Optics and Photonics
Volume 10 - 2022 | https://doi.org/10.3389/fphy.2022.1097841
A square-core photonic crystal fiber (PhCF) has been presented for liquid (petrochemical) sensing application. The sensor performance has been studied numerically in the frequency range from 1.2 to 3.8 THz. The core hole is filled with pure petrol, kerosene, and diesel. Strut size is varied to explore the sensor’s performance and the analysis is performed in terahertz (THz) frequencies. The photonic crystal fiber sensor shows a relative sensitivity of around 97.0% and a confinement loss in the order of 10−14 at 3.7 THz. This photonic crystal fiber sensor can be fabricated using extrusion and 3D-printing technologies.
With the development of automobile industry, the use of petrochemicals (e.g., petrol or diesel) has been enhanced. Therefore, the quality of the fuel used in any motor vehicle determines how long it will last. A low-quality (impure) fuel will not only degrade the machine’s performance, but it will also be extremely hazardous to our environment [1–3]. Use of impure fuel in automobile emits huge amount of carbon dioxide (CO2) which pollutes our environment as well as largely increases the Earth temperature [4, 5]. Kerosene, as a domestic fuel, is significantly less expensive than petrol or diesel. Since kerosene can smoothly be mixed with diesel or petrol, some dishonest businessman intentionally mixes kerosene with diesel or petrol to earn extra money. When this impure fuel is used by motor vehicle users, it results in massive emission of CO2, causing the air, water, and soil pollution [6, 7]. Therefore, it is the need of scientific community to develop an efficient mechanism to sense pure petrochemicals. Early on several technologies have been reported for detecting petrochemicals. Among them, some techniques include checking various properties of petrochemicals (e.g., viscosity, density, colour, and odour, etc.). There are also some other methods (e.g., chromatography technique, titration, and ultrasonic techniques, etc.) [2, 8]. Nevertheless, the techniques are laborious, expensive, and not enough accurate.
In the last decade, researcher scholars have suggested photonic crystal fiber (PhCF) based sensors for liquid/chemical sensing. PhCFs, unlike traditional optical fibers, offer more tuneable optical properties. In addition, since liquids/chemicals can be selectively injected into PhCF holes to create light-matter interactions, PhCFs are pertinent to perform liquid/chemical sensing applications [9–14]. Ademgil and Haxha presented a PhCF based liquid sensor with a relative sensitivity of ≃23.8% [9]. Asaduzzaman and Ahmed reported a microarray elliptical core PhCF sensor with a sensitivity of ≃29.5% [10]. Asaduzzaman and his research group presented a hybrid-PhCF for chemical sensing and they found the sensitivity of ≃49.2% [11]. Arif and Biddut suggested another new PhCF sensor with a sensitivity of ≃53.5% [12]. Chowdhury and his group proposed a porous-core PhCF sensor for liquid sensing application where they found a relative sensitivity of ≃61.5% and negligible confinement loss [13]. Podder et al. presented an Acid sensor with a sensitivity of ≃63.5% [14]. Paul and his team reported an Alcohol sensor where they achieved a sensitivity of ≃67.6% [15]. In the last few years, the researchers have found that this PhCF sensor can perform much better if they are operated in terahertz (THz) frequencies [16–21]. Sultana and her lab group presented a THz sensor with a sensitivity of ≃68.9% and a confinement loss of ≃7.8 × 10⁻¹² cm−1 [16]. Shafi and Sen suggested an octagonal-PhCF sensor for analyte sensing, where they achieved a sensitivity of ≃77.1% [17]. Ahmed and his lab member reported a blood component sensor with a sensitivity of ≃80.9% and a confinement loss of ≃1.23 × 10⁻¹¹ dB/m [18]. Islam et al. brought forward another THz sensor with high sensitivity (i.e., ≃85.7%) and negligible confinement loss (i.e., ≃1.7 × 10⁻⁹ cm−1) [19]. Habib et al. also reported a hollow-core PhCF sensor with a sensitivity of ≃89% [20]. Moreover, Karki and his group reported an advanced SPR biosensor for detecting cancer cells [22]. This group also presented another biosensor for Hemoglobin detection [23]. Singh et al. suggested a fiber Bragg grating sensor for Petrochemicals sensing [24].
Considering the necessity of Petrochemicals sensing, we have presented a square-core PhCF sensor for petrochemical sensing. The main objective of this work is to minimize the PhCF fabrication complexity by creating similar (square) shape core and cladding structures and to get better core power fraction and enhanced relative sensitivity for pure fuel sample sensing.
We consider an optical fiber with a diameter of 3 mm. The outer layer is called perfectly matched layer (PML), usually ≃10% of fiber radius. The centre hole is designed to put analyte through it and there are 20 air holes with the same size of centre one. The air holes (which are marked by white colour) guide the light through the centre hole (core region, which is marked by red colour). The length of each side of the square holes is 400 µm. The spacing between any 2 consecutive holes (which is called strut size) is kept same throughout the sensor geometry. However, we varied the strut size and core-clad holes width to explore the PhCF sensor’s performance. Petrochemicals (e.g., petrol, kerosene, and diesel) are opted in this work as sensing analyte. We opt Zeonex as the background (fiber) material, as Zeonex exhibits outstanding optical properties (e.g., high optical transparency, high heat resistance, strong resistance to acids, humidity intensive, and insignificant material dispersion). Figure 1A shows cross-sectional view of the PhCF sensor. Figure 1B depicts the meshing phenomenon that was considered during the simulation, which is the segmentation of the computational area into rectangular or triangular areas within a finite number of dimensions. An increase in mesh density can significantly improve light propagation towards the sensor, making numerical analysis easier and sensor accuracy higher. In this simulation, physics-controlled mesh and finer element size is chosen. The complete mesh possesses 22246 domain elements and 2246 boundary elements, where the number of degrees of freedom solved for is 155907.
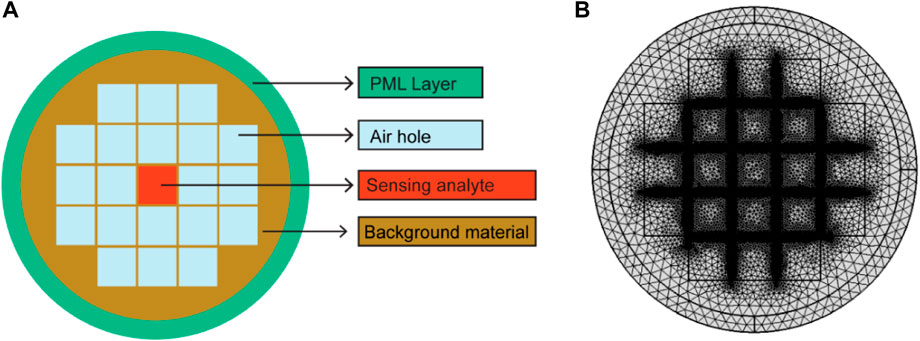
FIGURE 1. Cross-sectional view and meshing view of the PhCF sensor. (A) Cross-sectional details. (B) Meshing details.
Up to now, various advanced techniques have been reported for PhCF fabrication (e.g., sol-gel [25], drilling [26], extrusion [27], 3D-printing [28], etc.). The sol-gel and drilling methods are potentially capable to fabricate PhCF structures made of circular holes. In contrast, extrusion and 3D-printing techniques can fabricate PhCF models with square, rectangular, and elliptical holes. Since the proposed petrochemical sensor made of square-shape holes, extrusion and 3D-printing techniques can be used to fabricate this PhCF sensor.
The electromagnetic wave propagation characteristics through optical media need to be analysed for both optical communication and sensing applications. So far, various numerical tools have been suggested in this purpose and these tools are based on several computational methods (e.g., beam propagation method (BPM), finite integration technique, full vectorial finite element method (FV-FEM), etc.). Nevertheless, when compared to other approaches FV-FEM is the best acceptable method because of its computational efficiency [29]. Therefore, we used FV-FEM based commercially available software to design and simulate this PhCF sensor. Once the sensor structure is built, we select the materials (e.g., analyte material, fiber material, cladding material, etc.) and choose mesh. Here, physics-controlled mesh and finer element size is chosen. The complete mesh possesses 22246 domain elements and 2246 boundary elements, where the number of degrees of freedom solved for is 155907. Once mesh study is completed, we simulate the model for a certain operating frequency. We can also run the system model for a range of frequencies (e.g., 1.2 to 3.8 THz). In this case, Parametric Sweep is used to simulate this model.
Nevertheless, in our work, we analyse diverse sensing properties (e.g., relative sensitivity, core power fraction (CPF), confinement loss, effective material loss (EML), effective area, non-linearity, etc.) of the petrochemical sensor numerically. CPF (P) is the ratio between light power through the core area and power injected in entire area of the sensor and can be defined as [16, 18, 21].
Relative sensitivity (R) determines the sensor’s efficiency to sense petrochemicals. For a specific frequency, R expresses the level of light-material (injected petrochemical) interaction and R is obtained as follows [16, 18, 21].
where nf stand for refractive index (RI) of petrochemical (i.e., nf = 1.418 for petrol, nf = 1.44 for kerosene, and nf = 1.46 for diesel) [30], and neff denotes effective RI.
Due to the non-perfect structure of PhCF or material impurities, the useful light-power can leakage from core area to cladding area. This light leakage is known as confinement loss (Lc) and can be calculated as [16, 18, 21].
where Im[neff] indicates the imaginary part of effective RI.
EML (Leml) is an evaluation of THz light absorption by a substrate material per unit length, which can be obtained as [16].
where
The area that is enveloped by the fundamental mode field, is called effective area (Aeff). Aeff is defined as [18, 19, 21].
The power intensity within an optical fiber outlines the non-linearity, which is a function of Aeff. The higher the power intensity the lower the effective area; the higher the mode area the lower the non-linearity (γ). Here γ is calculated as follows [31].
where n2 denotes the non-linear coefficient of bulk material.
In this work, we consider three fuels (e.g., pure petrol, kerosene, and diesel) as the sensing analyte. Then simulation is accomplished for a range of operating frequencies (i.e., 1.2 to 3.8 THz). First, we put pure petrol through the PhCF sensor and then we change strut size to explore various sensing properties (e.g., effective refractive index (ERI), core power fraction (CPF), relative sensitivity, effective material loss (EML), confinement loss, effective area, non-linearity, etc.).
Figure 2A shows CPF variation with core width variation when core region is filled with pure petrol at frequency 3 THz. It is found that CPF is potentially increasing with increasing core size up to 400 µm and then there is no significance increase in CPF. For this reason, we fix the core width at 400 µm for rest of the analysis. Then we varied the strut size to investigate the CPF variation for this sensor (see Figure 2B. The lower the strut size the higher the CPF. We also varied the operating frequency, and it is observed that the CPF values are increasing with increasing frequencies.
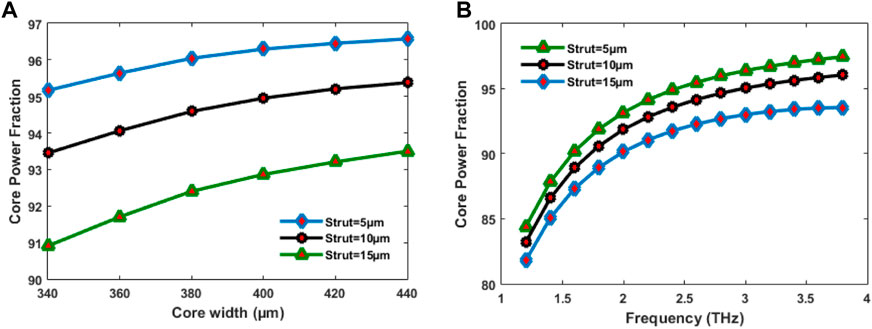
FIGURE 2. Relation of core power fraction with respect to core width and operating frequency. (A) Core power fraction vs. core width. (B) Core power fraction vs. operating frequency.
Next, we explored the CPF profiles for other petrochemicals. Figures 3A–C show CPF variation with petrochemical variation when the strut size is 15 μm, 10 μm, 5 μm, respectively. The CPF values are higher for a petrochemical with higher RI (e.g., diesel) and vice-versa. Also, for all three fuels, the CPF values are significantly increasing with increasing frequencies.
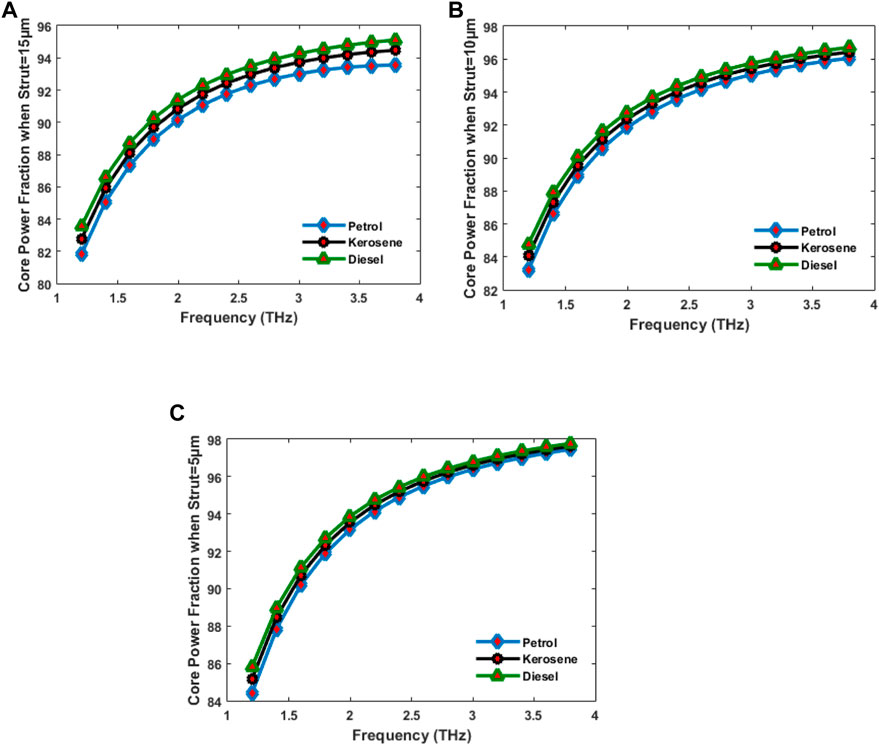
FIGURE 3. Core power fraction for different petrochemicals. (A) Strut distance 15 μm. (B) Strut distance 10 μm. (C) Strut distance 5 μm.
Figure 4A shows ERI variation with strut size variation when core region is filled with pure petrol. The smaller the strut size the lower the ERI. However, the ERI values are increasing with increasing frequencies. Similarly, we explored the ERI profile variation for other petrochemicals. Figures 4B–D show ERI variation with petrochemical variation when the strut size is 15 μm, 10 μm, 5 μm, respectively. The ERI values are higher for a fuel with higher RI (e.g., diesel) and vice-versa. Additionally, for all three petrochemicals, the ERI values are increasing with increasing frequencies.
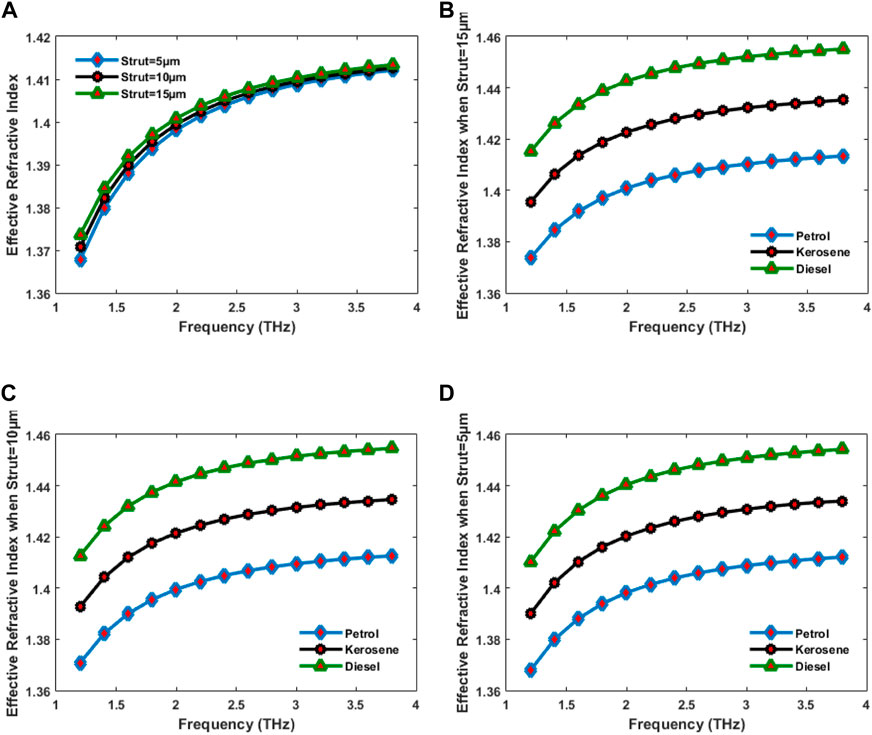
FIGURE 4. Effective RI vs. operating frequency. (A). Effective mode index. (B) Strut distance 15 μm. (C) Strut distance 10 μm. (D) Strut distance 5 μm.
Figure 5A shows sensitivity variation with strut size variation when core region is filled with pure petrol. The smaller the strut size the higher the sensitivity. Also, the sensitivity values are increasing with increasing frequencies. Then the relative sensitivity for other petrochemicals is also explored. Figures 5B–D show sensitivity variation with fuel sample variation. The sensitivity values are higher for a fuel with higher RI (e.g., diesel) and vice-versa. For all three fuel samples, the sensitivity values are significantly increasing with increasing frequencies. The sensitivity values for petrol, kerosene, and diesel are 93.8%, 94.75%, and 95.4% when strut is 15 μm; 96.35%, 96.75%, and 97.0% when strut is 10 μm; and 97.65%, 97.85%, and 97.98% when strut is 5 μm; respectively, at 3.7 THz.
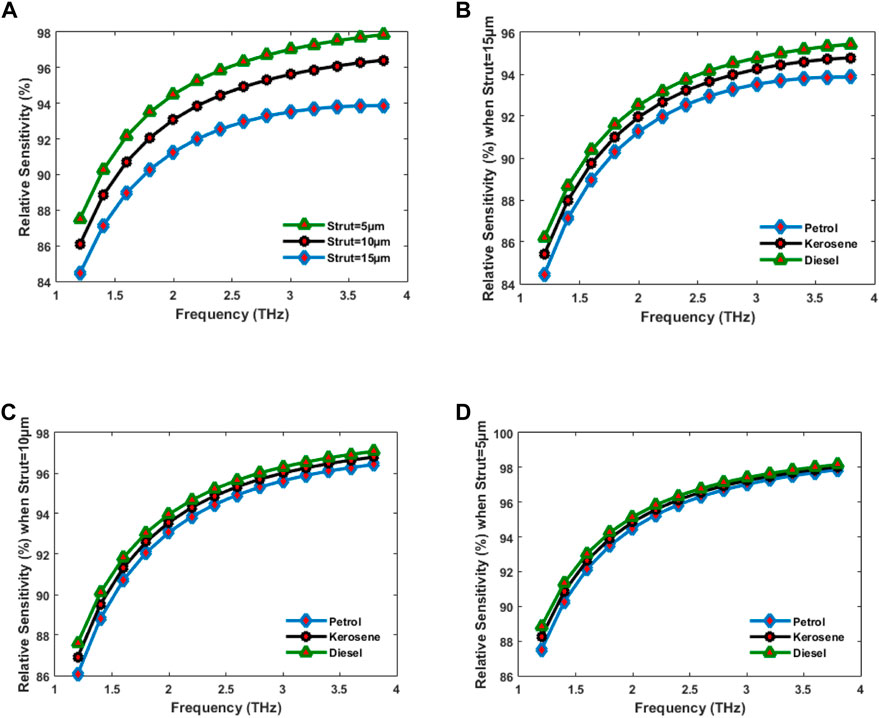
FIGURE 5. Sensitivity vs. operating frequency. (A) Core filled with Petrol at various strut. (B) Core filled with all petrochemicals at strut of 15 μm. (C) Core filled with all petrochemicals at strut of 10 μm. (D) Core filled with all petrochemicals at strut of 5 μm.
Now, we fixed the strut size at 10 μm, and we study confinement loss, EML, effective area, and non-linearity for this sensor. Figure 6A shows confinement loss profiles, and the confinement loss values are lower for a fuel with higher RI (e.g., diesel) and vice-versa. For all three petrochemicals, the higher the operating frequency the lower the confinement loss. The confinement loss values for diesel, kerosene, and petrol are .55 × 10−14 cm−1, .8 × 10−14 cm−1, and 1.32 × 10⁻¹⁴ cm−1, respectively, at 3.7 THz. Figure 6B shows EML profiles and the EML values are lower for a petrochemical with lower RI (e.g., petrol) and vice-versa. Also, for all three fuels, the higher the operating frequency the higher the EML value. The EML values for petrol, kerosene, and diesel are .0098 cm−1, .0102 cm−1, and .0105 cm−1, respectively, at 3.7 THz.
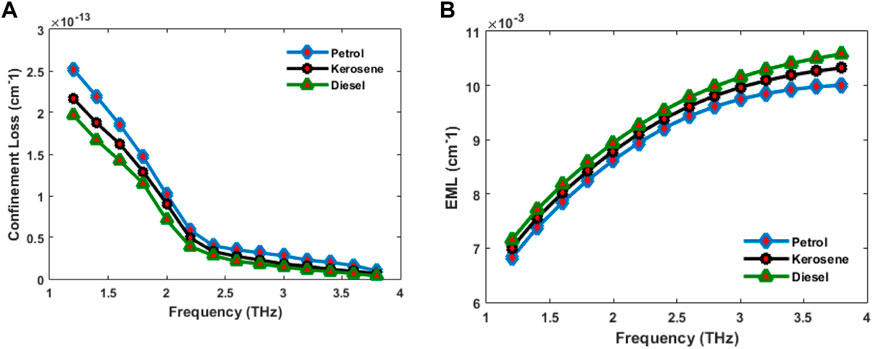
FIGURE 6. (A) Confinement loss vs. operating frequency, (B) EML vs. operating frequency.
The effective area values are higher for a fuel with lower RI (e.g., petrol) for an operating frequency up to 2 THz and then it goes in reverse way (as shown in Figure 7). For all petrochemicals, the higher the operating frequency the lower the effective area. The effective area values for petrol, kerosene, and diesel are 9.03 × 104 μm2, 9.05 × 104 μm2, and 9.06 × 104 μm2, respectively, at 3.7 THz.
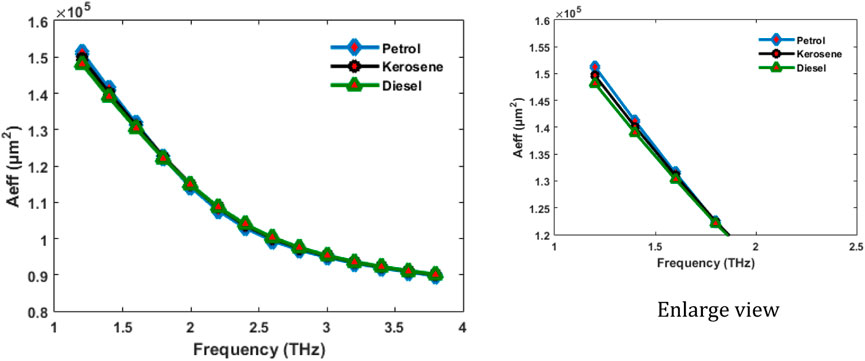
FIGURE 7. Effective Area vs. operating frequency.
The non-linearity values are higher for a fuel with higher RI (e.g., diesel) for an operating frequency up to 2 THz and then it goes in reverse way (as shown in Figure 8). Additionally, for all fuels, the higher the operating frequency the higher the non-linearity value.
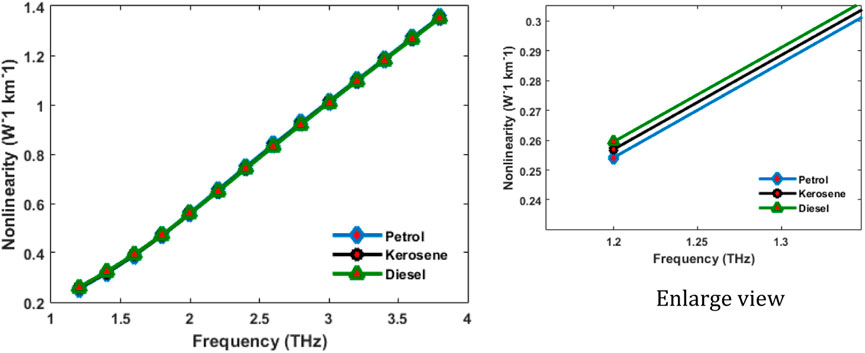
FIGURE 8. Non-linearity vs. operating frequency.
A comparative study reflects the significance of the current research work and here we compare the sensing properties of this PhCF petrochemical sensor with previously reported relevant works (as shown in Table 1).
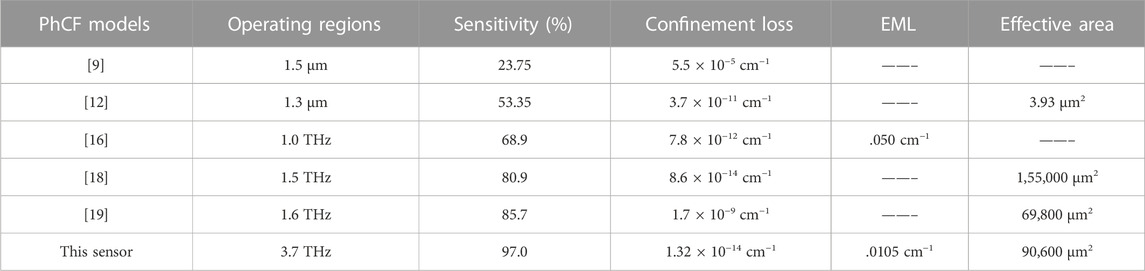
TABLE 1. Comparison with previously reported works.
We present a square-core photonic crystal fiber (PhCF) for petrochemical sensing. The sensor performance has been studied numerically and the study has been accomplished in terahertz (THz) frequencies (i.e., 1.2 to 3.8 THz). The petrochemical (e.g., pure petrol, kerosene, and diesel) is injected into the sensor and different sensing properties have been analysed. This PhCF sensor shows a relative sensitivity of around 97.0%, an effective material loss of .0105 cm−1, and a confinement loss of 1.32 × 10⁻¹⁴ cm−1 at 3.7 THz. Since this PhCF sensor made of square-shape holes, it can be fabricated using extrusion and 3D-printing technologies.
The raw data supporting the conclusion of this article will be made available by the authors, without undue reservation.
MH: Conceptualization, methodology, software, formal analysis, supervision. MR and MH: Writing- Original draft preparation, visualization, writing-reviewing and editing. JK: Funding acquisition, and validation. VD: Funding acquisition, and validation.
This work was supported by the Project of Excellence, Faculty of Science, University of Hradec Králové, No. 2214/2023-2024.
The authors declare that the research was conducted in the absence of any commercial or financial relationships that could be construed as a potential conflict of interest.
All claims expressed in this article are solely those of the authors and do not necessarily represent those of their affiliated organizations, or those of the publisher, the editors and the reviewers. Any product that may be evaluated in this article, or claim that may be made by its manufacturer, is not guaranteed or endorsed by the publisher.
1. Lam NL, Smith KR, Gauthier A, Bates MN. Kerosene: A review of household uses and their hazards in low-and middle-income countries. J Toxicol Environ Health B (2012) 15(6):396–432. doi:10.1080/10937404.2012.710134
2. Shahru´aBahari M, Criddle WJ, Thomas JDR. Determination of the adulteration of petrol with kerosine using a rapid phase-titration procedure. Analyst (1990) 115(4):417–9. doi:10.1039/an9901500417
3. Chiang PC, Chiang YC, Chang EE, Chang SC. Characterizations of hazardous air pollutants emitted from motor vehicles. Toxicol Environ Chem (1996) 56(1-4):85–104. doi:10.1080/02772249609358352
4. Solomon S, Plattner GK, Knutti R, Friedlingstein P. Irreversible climate change due to carbon dioxide emissions. Proc Natl Acad Sci (2009) 106(6):1704–9. doi:10.1073/pnas.0812721106
5. Florides GA, Christodoulides P. Global warming and carbon dioxide through sciences. Environ Int (2009) 35(2):390–401. doi:10.1016/j.envint.2008.07.007
6. Shahru Bahari M, Criddle WJ, Thomas JR. Fuel cell methodology for determining petrol adulteration with kerosene. In: Analytical proceedings (United Kingdom: Royal Society of Chemistry, Cambridge), 29 (1992). p. 30–1.
7. Sadat A. Determining the adulteration of diesel by an optical method. Int J Comp Appl (2014) 100(13):34–6. doi:10.5120/17588-8286
8. Gupta AK, Sharma RK. A new method for estimation of automobile fuel adulteration. In: Air pollution (United Kingdom: IntechOpen) (2010). p. 357–70.
9. Ademgil H, Haxha S. PCF based sensor with high sensitivity, high birefringence and low confinement losses for liquid analyte sensing applications. Sensors (2015) 15(12):31833–42. doi:10.3390/s151229891
10. Asaduzzaman S, Ahmed K. Microarray-core based circular photonic crystal fiber for high chemical sensing capacity with low confinement loss. Optica Applicata (2017) 47(1):41–9. doi:10.5277/oa170104
11. Asaduzzaman S, Ahmed K, Bhuiyan T, Farah T. Hybrid photonic crystal fiber in chemical sensing. SpringerPlus (2016) 5(1):748–11. doi:10.1186/s40064-016-2415-y
12. Arif MFH, Biddut MJH. A new structure of photonic crystal fiber with high sensitivity, high nonlinearity, high birefringence and low confinement loss for liquid analyte sensing applications. Sensing Bio-Sensing Res (2017) 12:8–14. doi:10.1016/j.sbsr.2016.11.003
13. Chowdhury S, Sen S, Ahmed K, Asaduzzaman S. Design of highly sensible porous shaped photonic crystal fiber with strong confinement field for optical sensing. Optik (2017) 142:541–9. doi:10.1016/j.ijleo.2017.03.123
14. Podder E, Hossain M, Jibon RH, Bulbul AAM, Mondal HS. Chemical sensing through photonic crystal fiber: Sulfuric acid detection. Front Optoelectronics (2019) 12(4):372–81. doi:10.1007/s12200-019-0903-8
15. Paul BK, Islam M, Ahmed K, Asaduzzaman S. Alcohol sensing over O+ E+ S+ C+ L+ U transmission band based on porous cored octagonal photonic crystal fiber. Photonic Sensors (2017) 7(2):123–30. doi:10.1007/s13320-017-0376-6
16. Sultana J, Islam MS, Ahmed K, Dinovitser A, Ng BWH, Abbott D. Terahertz detection of alcohol using a photonic crystal fiber sensor. Appl Opt (2018) 57(10):2426–33. doi:10.1364/ao.57.002426
17. Abdullah-Al-Shafi M, Sen S. Design and analysis of a chemical sensing octagonal photonic crystal fiber (O-PCF) based optical sensor with high relative sensitivity for terahertz (THz) regime. Sensing Bio-Sensing Res (2020) 29:100372. doi:10.1016/j.sbsr.2020.100372
18. Ahmed K, Ahmed F, Roy S, Paul BK, Aktar MN, Vigneswaran D, et al. Refractive index-based blood components sensing in terahertz spectrum. IEEE Sensors J (2019) 19(9):3368–75. doi:10.1109/jsen.2019.2895166
19. Islam MS, Sultana J, Ahmed K, Islam MR, Dinovitser A, Ng BWH, et al. A novel approach for spectroscopic chemical identification using photonic crystal fiber in the terahertz regime. IEEE Sensors J (2017) 18(2):575–82. doi:10.1109/jsen.2017.2775642
20. Habib MA, Anower MS, Abdulrazak LF, Reza MS. Hollow core photonic crystal fiber for chemical identification in terahertz regime. Opt Fiber Tech (2019) 52:101933. doi:10.1016/j.yofte.2019.101933
21. Hossain M, Podder E. Design and investigation of PCF-based blood components sensor in terahertz regime. Appl Phys A (2019) 125(12):861–8. doi:10.1007/s00339-019-3164-x
22. Karki B, Uniyal A, Pal A, Srivastava V. Advances in surface plasmon resonance–based biosensor technologies for Cancer Cell detection (2022).
23. Karki B, Vasudevan B, Uniyal A, Pal A, Srivastava V. Hemoglobin detection in blood samples using a graphene-based surface plasmon resonance biosensor. Optik (2022) 270:169947. doi:10.1016/j.ijleo.2022.169947
24. Singh Y, Ansari MTI, Raghuwanshi SK. Design and development of titanium dioxide (TiO₂)-coated eFBG sensor for the detection of petrochemicals adulteration. IEEE Trans Instrumentation Meas (2021) 70:1–8. doi:10.1109/tim.2021.3053985
25. Bise RT, Trevor DJ. Sol-gel derived microstructured fiber: Fabrication and characterization. In: Optical fiber communication conference. Anaheim, CA: Optical Society of America (2005). p. OWL6.
26. Zhang P, Zhang J, Yang P, Dai S, Wang X, Zhang W. Fabrication of chalcogenide glass photonic crystal fibers with mechanical drilling. Opt Fiber Tech (2015) 26:176–9. doi:10.1016/j.yofte.2015.09.002
27. Ghazanfari A, Li W, Leu MC, Hilmas GE. A novel freeform extrusion fabrication process for producing solid ceramic components with uniform layered radiation drying. Additive Manufacturing (2017) 15:102–12. doi:10.1016/j.addma.2017.04.001
28. Ebendorff-Heidepriem H, Schuppich J, Dowler A, Lima-Marques L, Monro TM. 3D-printed extrusion dies: A versatile approach to optical material processing. Opt Mater Express (2014) 4(8):1494–504. doi:10.1364/ome.4.001494
29. Uthman M, Rahman BMA, Kejalakshmy N, Agrawal A, Grattan KTV. Design and characterization of low-loss porous-core photonic crystal fiber. IEEE Photon J (2012) 4(6):2315–25. doi:10.1109/jphot.2012.2231939
30. Roy S. Fiber optic sensor for determining adulteration of petrol and diesel by kerosene. Sensors actuators B: Chem (1999) 55(2-3):212–6. doi:10.1016/s0925-4005(99)00171-9
Keywords: biosensor, PCF (photonic crystal fiber), sensor, confinement loss (Lc), petrochemical
Citation: Hossain MB, Kříž J, Dhasarathan V and Rahaman ME (2023) Photonic crystal fiber (PhCF) for petrochemical sensing. Front. Phys. 10:1097841. doi: 10.3389/fphy.2022.1097841
Received: 14 November 2022; Accepted: 23 December 2022;
Published: 10 January 2023.
Edited by:
Amrindra Pal, DIT University, IndiaReviewed by:
Arun Uniyal, Dehradun Institute of Technology University, IndiaCopyright © 2023 Hossain, Kříž, Dhasarathan and Rahaman. This is an open-access article distributed under the terms of the Creative Commons Attribution License (CC BY). The use, distribution or reproduction in other forums is permitted, provided the original author(s) and the copyright owner(s) are credited and that the original publication in this journal is cited, in accordance with accepted academic practice. No use, distribution or reproduction is permitted which does not comply with these terms.
*Correspondence: Md. Ekhlasur Rahaman, ZWtobGFzZWNla3VAZ21haWwuY29t
Disclaimer: All claims expressed in this article are solely those of the authors and do not necessarily represent those of their affiliated organizations, or those of the publisher, the editors and the reviewers. Any product that may be evaluated in this article or claim that may be made by its manufacturer is not guaranteed or endorsed by the publisher.
Research integrity at Frontiers
Learn more about the work of our research integrity team to safeguard the quality of each article we publish.