- 1Translational Biophotonics Laboratory, Institute of Bioengineering and Bioimaging, A*STAR, Singapore, Singapore
- 2Department of Biomedical Engineering, National University of Singapore, Singapore, Singapore
Optical fiber-based spectroscopy sensors are widely used for industrial and biomedical applications. They normally consist of at least one excitation fiber and one collection fiber. However, the excitation and collection fibers are placed side by side, so the focal spots do not coincide. In addition, Raman probes whose excitation and emission span a wide wavelength range are limited by wavelength-dependent focal length variation, low sensitivity, and bulky size impeding their clinical adoption. To overcome the challenges, we propose an all metasurface integrated fiber solution. The metasurface technology is well suited for this application because it relies on specially designed nanostructures to manipulate light properties in an ultrathin footprint. Here we used our earlier demonstrated dual-wavelength excitation Raman probe as an example. The two excitation fibers at 671 nm and 785 nm feature a hybrid metasurface lens (metalens) including a narrow band pass filter and an off-axis focusing metalens. The collection fiber at 810—910 nm features an achromatic broadband on-axis focusing metalens. Simulation results show that by integrating the metalenses, the focal spots of the excitation beams and the collection beam coincide with a beam size of 4.6 µm, 4.6 µm, and 11.3 µm in the x-, y-, and z-axis, respectively. Moreover, the probe size shrinks by 100 times and becomes a needle probe. The needle probe will enable new applications such as small animal in vivo experiments, medical endoscopy experiments, and neonatal skin analysis for hard-to-reach areas. Furthermore, the proposed solution can be applied to work with any optical fiber-based spectroscopy sensors because the designs can be readily fabricated and put into practical use.
1 Introduction
Raman spectroscopy is widely used for biomedical applications such as skin analysis and early cancer detection [1–9]. Recently there has been a lot of development in miniaturizing Raman spectroscopy-based devices for in vivo studies [10–12]. We have earlier reported a handheld portable Raman spectroscopy device for skin analysis [13]. The confocal configuration allowed data collection at different dermal layers in a less invasive manner compared to the conventional ex vivo tape stripping method. The dual-wavelength excitation configuration allowed an ultrawide band characterization of the stratum corneum thickness, natural moisturizing factor, and water content. The scanning time was about 2 min for 10 depths reducing 50% of time compared to a commercial Raman spectroscopy system. However, there are several limitations. The first is that the dual-wavelength excitation was sequential by using a fiber array multiplexing module. A simultaneous excitation would be ideal so that different biological features can be measured at the same time. The second is that the excitation and collection beam spots were not focused at the same spot on the sample because the excitation and collection fibers were put side by side and the wavelengths were different. This limitation is a common issue faced by many fiber-based endoscopic probes [12, 14–17]. A coincidence of the beam spots would be ideal to achieve the best spatial resolution. The third is that the overall handheld probe size was on the order of hundreds of millimeters. Although it has already been miniaturized from a benchtop device to a portable handheld device, a further size reduction would enable the device to perform measurements for hard-to-reach areas and endoscopic applications. It is worth mentioning that the limitations mentioned above may also be experienced by non-Raman spectroscopy-based fiber sensors.
The metasurface technology is a rising star in the nanophotonics field and is explored here to address these limitations. It is based on specially designed nanostructures that allow manipulation of the light properties, such as phase and amplitude of the transmitted, reflected, or scattered light, at a sub-wavelength scale. It provides the potential to redesign conventional refractive optics-based optical components in an ultrathin footprint (approximately 103 times thinner) and achieve new functionalities that never existed before. Over the last decade, research groups worldwide have demonstrated metasurface-based optical components with superior performance to conventional optical components, such as combining multiple functions in a single flat optics device and correcting aberrations to achieve diffraction-limited focusing [18–26]. The concept has started attracting attention in biomedical imaging and sensing too [27, 28]. Pahlevaninezhad et al. implemented the concept of bijective illumination collection imaging for optical coherence tomography of tissues [29]. It was realized through the use of two metasurface lenses (metalens), each bent the incident light at an angle and focused it into a line for the excitation path and the collection path, respectively. The excitation and collection spots coincided and a lateral resolution of 3.2 μm over a depth of 1.25 mm was achieved at a wavelength of 1.3 μm. Beyond single-wavelength metalenses, recent research has shown the merits of broadband achromatic metalenses. Chen et al. has designed broadband achromatic metalens for focusing and imaging in the visible range between 470 and 670 nm [30]. This was achieved by controlling the phase, group delay, and group delay dispersion of the metalens using TiO2 nanofins of differing widths and lengths and height 600 nm. Wang et al. has demonstrated a broadband achromatic metalens for imaging in the near-infrared (NIR) range 650–1000 nm [31]. The authors achieved high efficiency with an impressive TiO2 nanopillar height of 1500 nm and 90o vertical side walls.
Inspired by the previous work, we designed and simulated five different metasurface components that can be integrated on the fiber facets to replace the optical filters and lenses in the current handheld confocal dual-wavelength Raman spectroscopy device. Specifically, this all-metasurface design includes two narrow band pass filters and two off-axis focusing metalenses allowing for simultaneous excitation of two beams at 671 nm and 785 nm and one broadband achromatic on-axis focusing metalens from 810 nm to 910 nm for the collection beam. The focal spots of the excitation beams and collection beam completely overlap so the optimum lateral and axial resolutions were achieved. The new design reduced the overall probe size by approximately 100 times, from 200 mm to 2 mm in diameter into a needle size. We made sure that the design could be fabricated and put into practical use. The parameters of the metasurface nanostructures were based on literature-reported fabricated devices and all metasurfaces have achieved high efficiency of 70% across the entire wavelength range of interest. The methodology and results presented here not only help resolve the limitations of our current probe design, but also extend the confocal Raman spectroscopy applications to oral cavity examinations [32], small animal experiments [14], medical endoscopic experiments [33], and neonatal or infant skin analysis for hard-to-reach areas [34], as shown in Figure 1.
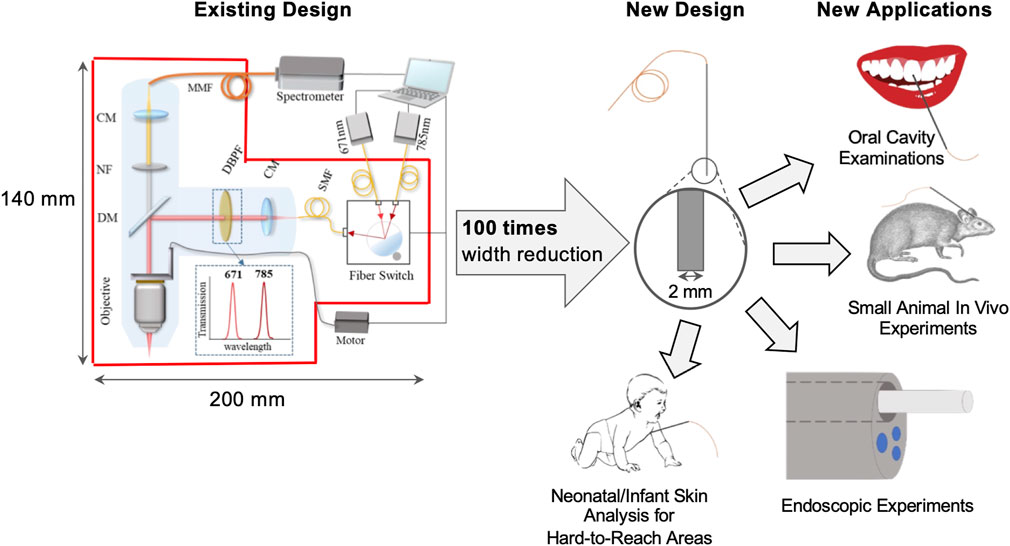
FIGURE 1. Overview of existing and new design of Raman probe. Schematics of existing and new probes and potential applications of the new design.
2 Methodology
Figure 2 gives an overview of the design methodology. Figure 2A shows a schematic of the probe head made of three optical fibers including two excitation fibers on the side, one collection fiber in the middle, and five metasurface devices at the distal end of the fiber facets, labeled as (1)–(5). The excitation fibers are large-mode area single-mode photonic crystal fibers with a core diameter of 20 μm and a wavelength range of 600–1700 nm (LMA-20, Thorlabs). The collection fiber has a core diameter of 25 μm and a wavelength range of 800–1700 nm (LMA-25, Thorlabs). Single-mode fibers were used because metasurface works only with single-mode incident beams. However, traditional single-mode fibers have a small core diameter of 5 μm and a narrower wavelength range. To maximize the interaction of the light and metasurfaces at the fiber facets, photonic crystal fibers with large mode areas are needed. Our new metasurface-based designs were based on commercially available large mode area single-mode photonic crystal fibers, but it has been shown in the literature that the mode area can be as large as 100 μm [35]. The collection fiber has a low cut-off wavelength at 800 nm so that any excitation light at shorter wavelengths will be blocked. The five metasurfaces in our design include 1) 671 nm narrow band pass filter (NBPF), 2) 671 nm off-axis focusing metalens, 3) 785 nm narrow band pass filter, 4) 785 nm off-axis focusing metalens, and 5) 810–910 nm broadband achromatic on-axis focusing metalens. Metasurface 1)–4) were designed to replace all the optical components in the excitation beam path in the earlier design [13], i.e., metasurface 1) and 3) for the dual-passband laser cleaning filters and metasurface 2) and 4) for the fiber array multiplexing module, the collimator, and the objective. Metasurface 5) was designed to replace the optical components in the collection beam path including the objective, the notch filter, and the collimator.
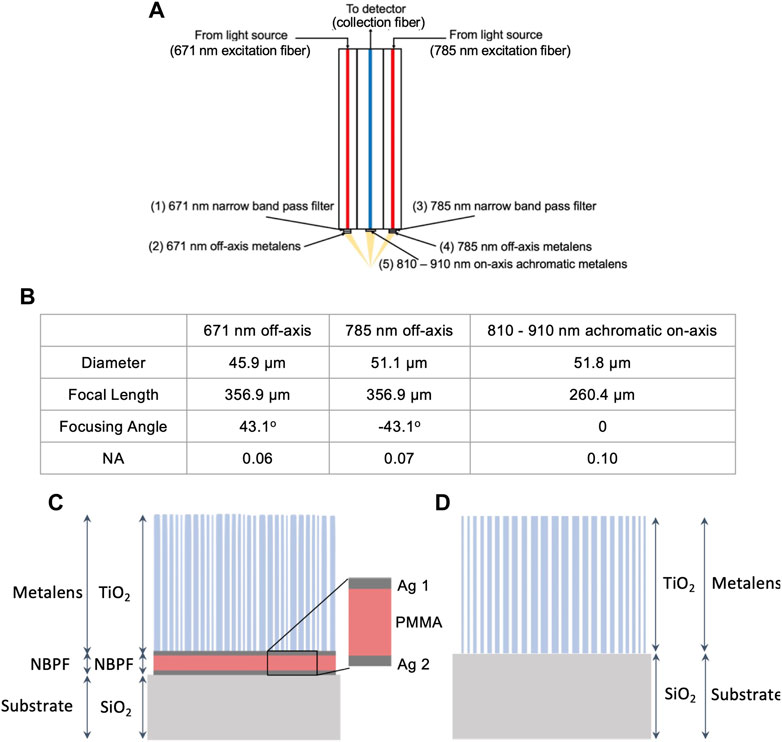
FIGURE 2. Schematic of new Raman probe and metasurfaces. (A) Schematic of new Raman probe, which consists of two excitation fibers (671 and 785 nm), one collection fiber, as well as five metasurfaces—1) 671 nm narrow band pass filter (NBPF), 2) 671 nm off-axis metalens, 3) 785 nm NBPF, 4) 785 nm off-axis metalens, 5) 810–910 nm on-axis achromatic metalens. (B) Specifications of metalenses—Diameter, Focal Length, and Numerical Aperture (NA). (C) Schematic of off-axis metalens and NBPF—consisting of the SiO2 substrate, NBPF, and off-axis metalens comprising of TiO2 nanopillars and a SiO2 layer. (D) Schematic of on-axis achromatic metalens—consisting of the SiO2 substrate and the achromatic metalens which is made up of TiO2 nanopillars.
Figure 2B summarizes the design parameters for the three metalenses, i.e., 2), 4), and 5). The diameters of the metalenses were calculated based on the core diameters of the photonic crystal fibers and their divergence due to the metalens thickness and NBPF thickness. The diameters were 45.9 μm, 51.1 μm, and 51.8 μm for metalens 2), 4), and 5), respectively. The focal lengths were calculated along the beam path. The focal lengths were 356.9 μm, 356.9 μm, and 260.4 μm. The focusing angles were calculated based on the equation,
Figure 2C is the schematic of the NBPF metasurface and off-axis metalens combined structure for the excitation fiber. The substrate side will be attached to the fiber facet. The output light from the fiber will first pass through the substrate (SiO2), then the NBPF layers (Ag/Poly (methyl methacrylate) or PMMA/Ag), and finally the metalens (TiO2). The optical properties of TiO2 could be found in the supplementary information. The purpose of the NBPF was to only pass through the excitation wavelengths and filter out the autofluorescence signals generated from the optical fibers. The NBPF was a Fabry-Pérot cavity consisting of the PMMA material sandwiched by two Ag mirrors, which allowed only optical waves in resonance to pass through. The bandwidth of the transmission peaks (i.e., linewidth) and the free spectral range between each transmission peak (i.e., finesse) can be adjusted by the cavity length, the material of the cavity, and the thickness of the cavity. The metalens on top of the NBPF focuses incoming light at an angle. The metalens was made of TiO2 circular pillars. The parameters of the unit cell design were height = 1500 nm, diameter = 50–130 nm (for λ = 671 nm) and 50 to 170 (for λ = 785 nm), and period = 160 nm (for λ = 671 nm) and 200 nm (for λ = 785 nm). The phase maps and transmission maps are presented in the supplementary information, see Supplementary Figure S1. The phase coverage was 2π and the transmission was close to 1. Note that all the design parameters were proved to be fabricatable by literature [30, 36]. The design equation for the off-axis focusing function can be found in [37], where each metalens element at position
where
Figure 2D is the schematic of the broadband achromatic on-axis metalens for the collection fiber. The substrate material was SiO2 and the metalens material was TiO2. Based on the design principles described in [30] for a metalens to focus achromatically, not only the phase shift at each position needs to be satisfied, but also the group delay. Therefore, we simulated a pool of pillars with different shapes and sizes including a circular, cross, and square shape, as shown in Figure 3A. These shapes are symmetrical, so the design is independent of the polarization of the incident light. The height of the nanopillars was 1500 nm which was much higher than the off-axis design because the increased height will increase the group delay coverage of the unit cells [31]. The diameters and lengths were 50–200 nm for all three shapes. For on-axis focusing, the phase equation follows Eq. 1 by setting
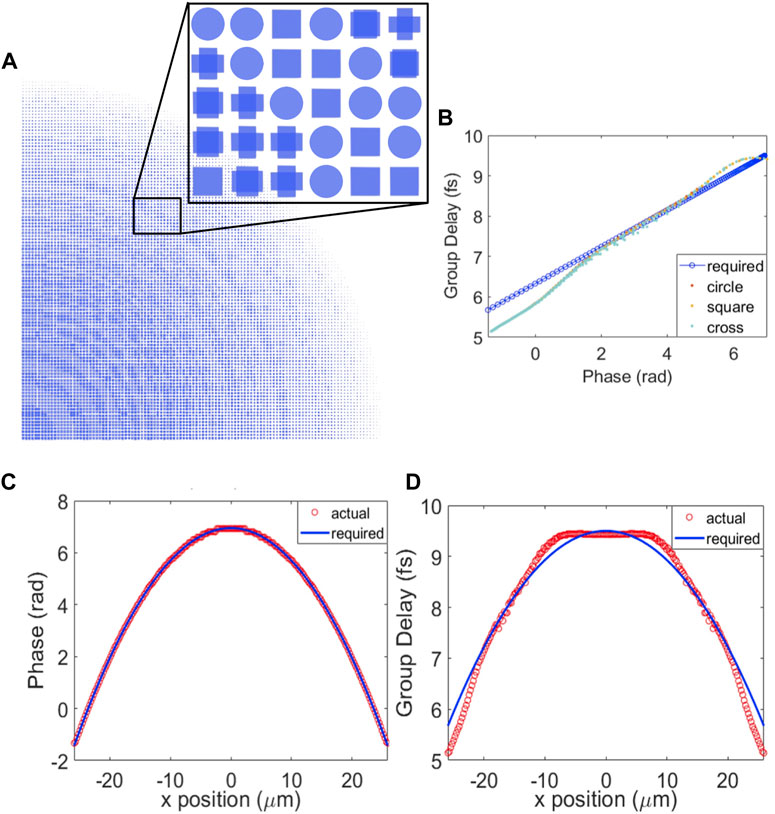
FIGURE 3. Design for 810–910 nm achromatic on-axis metalens. (A) Top view of the upper right quarter of achromatic metalens and cross-sections of nanopillars. (B) Group delay vs. phase plot for achromatic metalens - Required group delay vs. phase for each radial position and simulated group delay and phase for nanopillar unit cells. (C) Phase vs. x position plot—Actual phase value of selected nanopillar and required phase value at each x position. (D) Group delay vs. x position plot—Actual group delay value of selected nanopillar and required group delay value at each x position.
All simulations were performed using commercial FDTD software (Lumerical, Ansys Inc.). For the metasurface designs of the excitation beams, the mesh setting was auto-nonuniform with accuracy 1 and the boundary conditions were PML (stretched coordinate PML) in x-axis, Symmetric in y-axis, and PML in z-axis. For metasurface designs of the collection beam, the mesh setting was auto-nonuniform with accuracy 3 and the boundary conditions were Anti-symmetric in x-axis, Symmetric in y-axis, and PML in z-axis.
3 Results and discussion
This section discusses the simulated results of five metasurfaces mentioned in the last section. It was divided into three subsections, one for the 671 nm excitation fiber, one for the 785 nm excitation fiber, and the last one for the 810–910 nm collection fiber.
3.1 Metasurfaces for 671 nm excitation fiber
It consisted of a hybrid design of an NBPF and a metalens. Figure 4A summarizes the optimized parameters for the NBPF design. The total thickness was 226 nm including the two Ag mirror layers which were 28 nm thick each and the PMMA layer which was 170 nm thick. The optimization criteria were narrow transmission bandwidth, transmission peak position at the design wavelength, and high transmission efficiency. Figure 4B is the normalized transmission profile after the NBPF. The incident light was a plane wave with a wavelength range of 400–1200 nm. The bandwidth was measured by the full width at half maximum (FWHM) which was 44.3 nm. The transmission peak position was at 670.6 nm. The transmission efficiency was 64%. The loss came from metallic losses. It was observed that there was a loss of about 13% after passing through each Ag layer (see Supplementary Table S1). Figures 4C—H shows the electric field profiles of the output light after the NBPF and metalens at different plane cross sections. The NBPF and metalens were placed in the
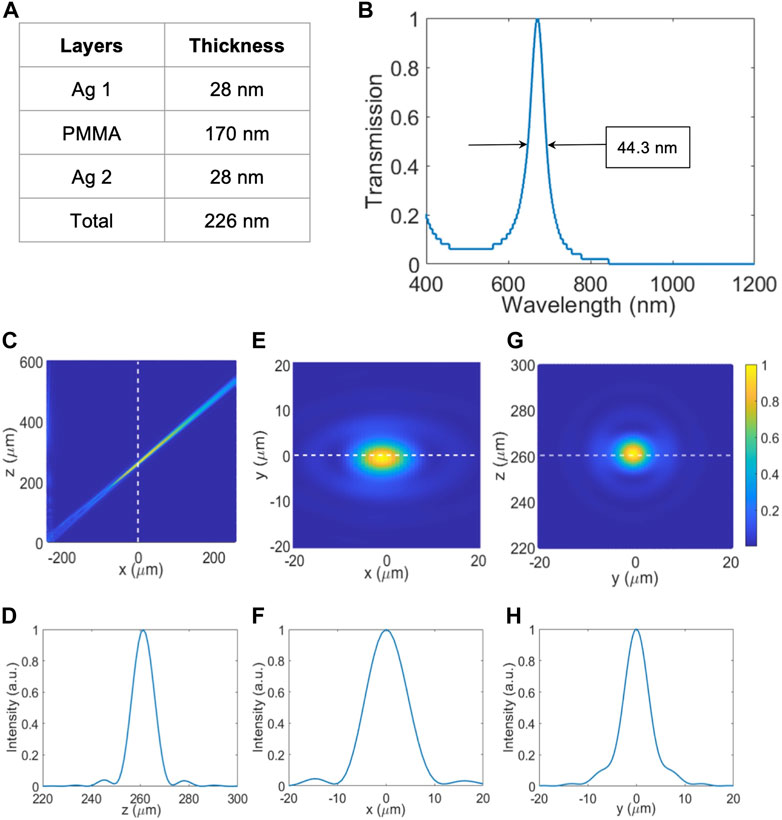
FIGURE 4. Simulation results for 671 nm NBPF and off-axis metalens. (A) Table consolidating the thickness of each NBPF layer and its material. (B) Transmission vs. Wavelength plot of 671 nm NBPF for the range of 400–1200 nm with peak wavelength = 670.6 nm and FWHM = 44.3 nm. (C) Normalized intensity plot of the focal point profile of 671 nm off-axis focusing on the x-z plane. (D) Normalized intensity plot of the focal point along the z-axis. (E) Normalized Intensity plot of focal point profile of 671 nm off-axis focusing on the x-y plane. (F) Normalized intensity plot of the focal point along the x-axis. (G) Normalized Intensity plot of focal point profile of 671 nm off-axis focusing on the y-z plane. (H) Normalized intensity plot of the focal point along the y-axis.
3.2 Metasurfaces for 785 nm excitation fiber
Similar to the 671 nm excitation fiber, the metasurfaces consisted of an NBPF design to only allow 785 nm wavelength to pass through and an off-axis metalens design to focus the light at an angle so that the focal spot coincides with the focal spot of the 671 nm excitation fiber. Figure 5A shows the optimized values for the layer thicknesses of the NBPF structure. The thickness values of the Ag layers were 25 nm and the thickness of the PMMA layer was 208 nm making the total thickness of 258 nm. Figure 5B shows the optical performance of the NBPF where the FWHM was 46.9 nm, the peak position was at 784.4 nm, and the transmission efficiency was 66%. Figures 5C, E, G correspond to the normalized 2D electric field distributions of the metalens in the
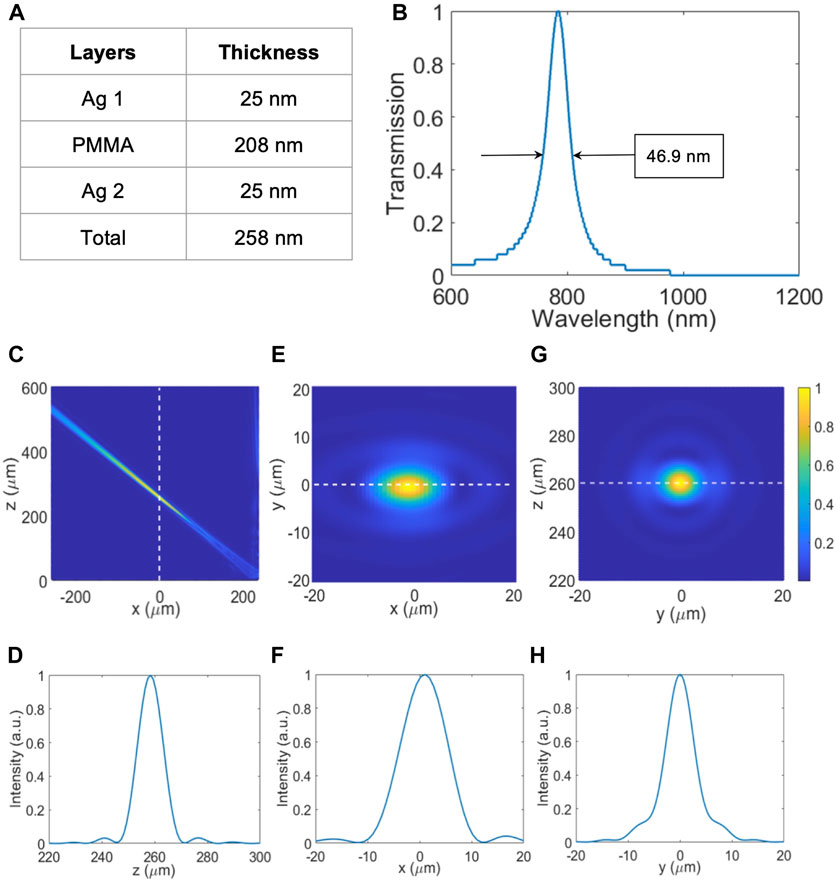
FIGURE 5. Simulation results for 785 nm NBPF and off-axis metalens. (A) Table consolidating the thickness of each NBPF layer and its material. (B) Transmission vs. Wavelength plot of 785 nm NBPF for the range of 600–1200 nm with the peak wavelength = 784.4 nm and FWHM = 46.9 nm. (C) Normalized intensity plot of the focal point profile of 785 nm off-axis focusing on the x-z plane. (D) Normalized intensity plot of the focal point along the z-axis. (E) Normalized intensity plot of the focal point profile of 785 nm off-axis focusing on the x-y plane. (F) Normalized intensity plot of the focal point along the x-axis. (G) Normalized intensity plot of the focal point profile of 785 nm off-axis focusing on the y-z plane. (H) Normalized intensity plot of the focal point along the y-axis.
3.3 Metasurfaces for 810 nm–910 nm collection fiber
For biological analysis, the most commonly used Raman detection range is 810 nm–910 nm, hence the metalens at the facet of the collection fiber must maintain the same focal length in the entire wavelength range, i.e., broadband achromatic focusing. This is challenging because most metalenses are designed for a single wavelength and will experience chromatic aberration. In order to solve this challenge, both the required phase profile and the group delay profile need to be satisfied by the metalens nanostructures, as discussed in Section 2. The final result is presented in Figure 6. The metalens was placed in the
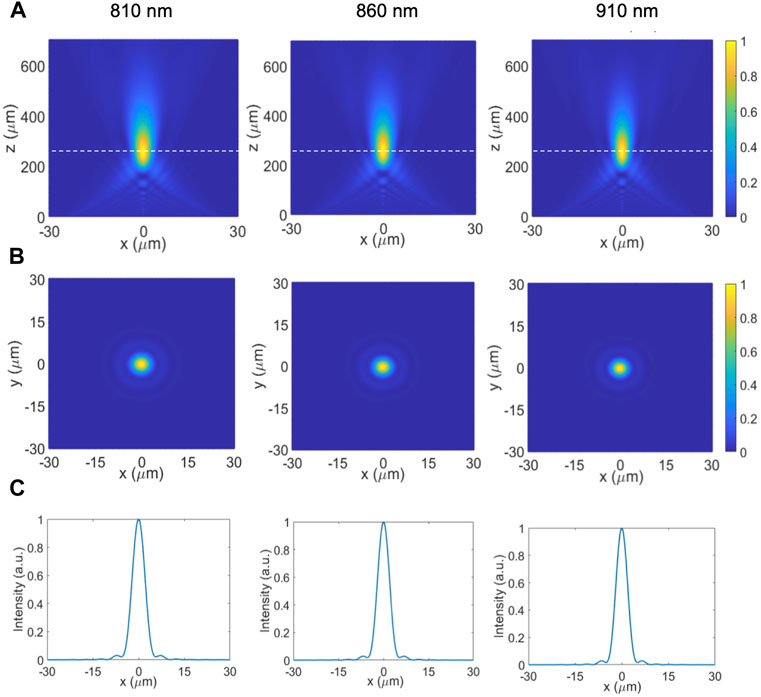
FIGURE 6. Simulation results for 810–910 nm achromatic on-axis metalens. (A) Normalized intensity plot of the focal point profile of achromatic metalens in the x-z plane at λ = 810, 860, and 910 nm. (B) Normalized intensity plot of the focal point profile of achromatic metalens in the x-y plane at λ = 810, 860, and 910 nm. (C) Normalized intensity plot of the focal point profile of achromatic metalens along the x-axis at λ = 810, 860, and 910 nm.
3.4 Metasurfaces for combined performances
Performances were evaluated quantitatively when combing all metasurfaces together. Figure 7A shows the representative cross-sectional views of the electric-field distribution at selected points along the propagation direction. All intensities are normalized to have the same scale bar. The green trail is the beam propagation for the hybrid off-axis focusing metalens at 671 nm excitation. The pink trail is for the beam propagation for the hybrid off-axis focusing metalens at 785 nm excitation. The blue trail is for the achromatic broadband on-axis metalens at 810–910 nm collection. All three metalenses were positioned at
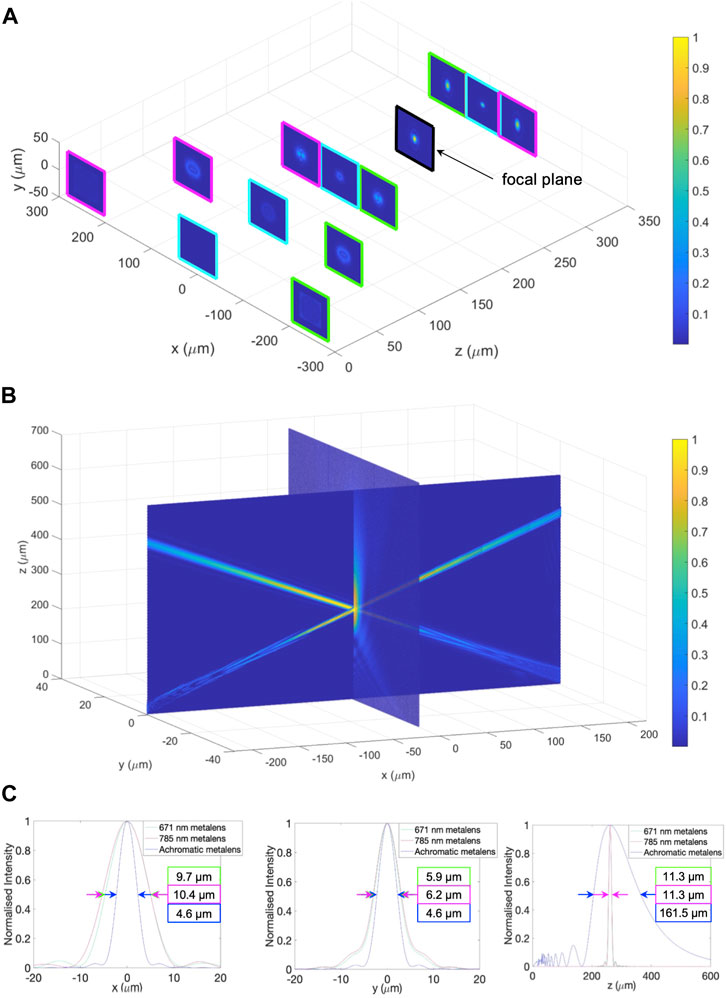
FIGURE 7. Focal point profiles of all metalenses. (A) 3D beam propagations of all three metalenses - magenta: 785 nm hybrid off-axis metalens, blue: 810–910 nm achromatic on-axis metalens, green: 671 nm hybrid off-axis metalens. The focal plane is shown in black. (B) Perspective view of the overlapping region of all three metalenses. (C) Normalized intensity plots of focal points along the x, y, and z-axis, showing the measurements of focal points in each direction.
4 Conclusion
In this paper, we have proposed an all-metasurface-enabled fiber needle probe for dual-wavelength excitation Raman spectroscopy devices. The new design reduces the overall size by 100 times and improves the optical performance of the existing handheld probe [13]. It consists of five metasurfaces that replace five conventional optical components in the original design. The metasurfaces designed for the excitation fibers at
Data availability statement
The raw data supporting the conclusion of this article will be made available by the authors, without undue reservation.
Author contributions
SZ, RB, and RZ conceived the idea. SZ and RS conducted the simulations. SZ, RB, RZ, YQ, and RS analyzed the results. MO supervised the project. SZ and RS drafted the manuscript. All authors reviewed the manuscript.
Funding
Agency for Science Technology and Research Industry Alignment Fund Prepositioning Program (H19H6a0025), Career Development Award (202D800042), and BMRC Central Research Fund Award (CRF, UIBR).
Conflict of interest
The authors declare that the research was conducted in the absence of any commercial or financial relationships that could be construed as a potential conflict of interest.
Publisher’s note
All claims expressed in this article are solely those of the authors and do not necessarily represent those of their affiliated organizations, or those of the publisher, the editors and the reviewers. Any product that may be evaluated in this article, or claim that may be made by its manufacturer, is not guaranteed or endorsed by the publisher.
Supplementary material
The Supplementary Material for this article can be found online at: https://www.frontiersin.org/articles/10.3389/fphy.2022.1093284/full#supplementary-material
References
1. Mhlanga N, Tetyana P, Nyembe S, Sikhwivhilu L. Application of Raman spectroscopy in biomedical diagnostics. In: Recent developments in atomic force microscopy and Raman spectroscopy for materials characterization. London: IntechOpen (2022).
2. Sato H, Maeda Y, Ishigaki M, Andriana BB. Biomedical applications of Raman spectroscopy. In: Encyclopedia of analytical chemistry. John Wiley & Sons (2000). p. 1–12.
3. Choo-Smith LP, Edwards HGM, Endtz HP, Kros JM, Heule F, Barr H, et al. Medical applications of Raman spectroscopy: From proof of principle to clinical implementation. Biopolymers (2002) 67:1–9. doi:10.1002/bip.10064
4. Caspers PJ, Lucassen GW, Wolthuis R, Bruining HA, Puppels GJ. In vitro and in vivo Raman spectroscopy of human skin. Biospectroscopy (1998) 4:S31–9. doi:10.1002/(sici)1520-6343(1998)4:5+<s31:aid-bspy4>3.0.co;2-m
5. Pezzotti G, Boffelli M, Miyamori D, Uemura T, Marunaka Y, Zhu W, et al. Raman spectroscopy of human skin: Looking for a quantitative algorithm to reliably estimate human age. J Biomed Opt (2015) 20:065008. doi:10.1117/1.jbo.20.6.065008
6. Caspers PJ, Nico C, Bakker Schut TC, Sterke J, Pudney PDA, Curto PR, et al. Method to quantify the in vivo skin penetration of topically applied materials based on confocal Raman spectroscopy. Translational Biophotonics (2019) 1. doi:10.1002/tbio.201900004
7. Liu K, Zhao Q, Li B, Zhao X. Raman spectroscopy: A novel technology for gastric cancer diagnosis. Front Bioeng Biotechnol (2022) 10:856591. doi:10.3389/fbioe.2022.856591
8. Auner GW, Koya SK, Huang C, Broadbent B, Trexler M, Auner Z, et al. Applications of Raman spectroscopy in cancer diagnosis. Cancer Metastasis Rev (2018) 37:691–717. doi:10.1007/s10555-018-9770-9
9. D’Acunto M, Gaeta R, Capanna R, Franchi A. Contribution of Raman spectroscopy to diagnosis and grading of chondrogenic tumors. Sci Rep (2020) 10:2155. doi:10.1038/s41598-020-58848-0
10. Corden C, Boitor R, Notingher I. Time-gated Raman spectroscopy for biomedical application under ambient or strong background light conditions. J Phys D: Appl Phys (2021) 54:504003. doi:10.1088/1361-6463/ac276e
11. Sato H, Shinzawa H, Komachi Y. Fiber-Optic Raman probes for biomedical and pharmaceutical applications. In: Matousek P,, and Morris MD, editors. Emerging Raman applications and techniques in biomedical and pharmaceutical fields. Springer Berlin Heidelberg (2010). p. 25–45.
12. Heng HPS, Shu C, Zheng W, Lin K, Huang Z. Advances in real-time fiber-optic Raman spectroscopy for early cancer diagnosis: Pushing the frontier into clinical endoscopic applications. Translational Biophotonics (2021) 3. doi:10.1002/tbio.202000018
13. Zhang R, Bi R, Ho Jun Hui C, Rajarahm P, Dinish US, Olivo M. A portable ultrawideband confocal Raman spectroscopy system with a handheld probe for skin studies. ACS Sens (2021) 6:2960–6. doi:10.1021/acssensors.1c00761
14. Katagiri T, Hattori Y, Suzuki T, Matsuura Y, Sato H. Hollow fiber-optic Raman probes for small experimental animals. In: Gannot I, editor. Optical fibers and sensors for medical diagnostics and treatment applications VII, 6433 (2007). p. 64330O.
15. Zavaleta CL, Garai E, Liu JTC, Sensarn S, Mandella MJ, Van de Sompel D, et al. A Raman-based endoscopic strategy for multiplexed molecular imaging. Proc Natl Acad Sci U S A (2013) 110:E2288–97. doi:10.1073/pnas.1211309110
16. Trägårdh J, Pikálek T, Šerý M, Meyer T, Popp J, Čižmár T. Label-free CARS microscopy through a multimode fiber endoscope. Opt Express (2019) 27:30055. doi:10.1364/oe.27.030055
17. Yu X, Zhang S, Olivo M, Li N. Micro- and nano-fiber probes for optical sensing, imaging, and stimulation in biomedical applications. Photon Res (2020) 8:1703. doi:10.1364/prj.387076
18. Yu N, Genevet P, Kats MA, Aieta F, Tetienne J-P, Capasso F, et al. Light propagation with phase discontinuities: Generalized laws of reflection and refraction. Science (2011) 334:333–7. doi:10.1126/science.1210713
19. Chen WT, Zhu AY, Capasso F. Flat optics with dispersion-engineered metasurfaces. Nat Rev Mater (2020) 5:604–20. doi:10.1038/s41578-020-0203-3
20. Arbabi A, Horie Y, Ball AJ, Bagheri M, Faraon A. Subwavelength-thick lenses with high numerical apertures and large efficiency based on high-contrast transmitarrays. Nat Commun (2015) 6:7069. doi:10.1038/ncomms8069
21. Park J-S, Zhang S, She A, Chen W-T, Yousef KMA, Capasso F, "Large-area, single material metalens in the visible: An approach for mass-production using conventional semiconductor manufacturing techniques," in Optics InfoBase conference papers (2019), Vol. Part F129.
22. She A, Zhang S, Shian S, Clarke DR, Capasso F. Large area metalenses: Design, characterization, and mass manufacturing. Opt Express (2018) 26:1573. doi:10.1364/oe.26.001573
23. Zhang S, Soibel A, Keo SASA, Wilson D, Rafol SBSB, Ting DZDZ, et al. Solid-immersion metalenses for infrared focal plane arrays. Appl Phys Lett (2018) 113:111104. doi:10.1063/1.5040395
24. Zhu AY, Kuznetsov AI, Luk’yanchuk B, Engheta N, Genevet P. Traditional and emerging materials for optical metasurfaces. Nanophotonics (2017) 6:452–71. doi:10.1515/nanoph-2016-0032
25. Jung C, Kim G, Jeong M, Jang J, Dong Z, Badloe T, et al. Metasurface-driven optically variable devices. Chem Rev (2021) 121:13013–50. doi:10.1021/acs.chemrev.1c00294
26. Zhang C, Divitt S, Fan Q, Zhu W, Agrawal A, Lu Y, et al. Low-loss metasurface optics down to the deep ultraviolet region. Light Sci Appl (2020) 9:55. doi:10.1038/s41377-020-0287-y
27. Zhang S, Wong CL, Zeng S, Bi R, Tai K, Dholakia K, et al. Metasurfaces for biomedical applications: Imaging and sensing from a nanophotonics perspective. Nanophotonics (2020) 10:259–93. doi:10.1515/nanoph-2020-0373
28. Li Z, Tian X, Qiu C-W, Ho JS. Metasurfaces for bioelectronics and healthcare. Nat Electron (2021) 4:382–91. doi:10.1038/s41928-021-00589-7
29. Pahlevaninezhad M, Huang YW, Pahlevani M, Bouma B, Suter MJ, Capasso F, et al. Metasurface-based bijective illumination collection imaging provides high-resolution tomography in three dimensions. Nat Photon (2022) 16:203–11. doi:10.1038/s41566-022-00956-6
30. Chen WT, Zhu AY, Sanjeev V, Khorasaninejad M, Shi Z, Lee E, et al. A broadband achromatic metalens for focusing and imaging in the visible. Nat Nanotech (2018) 13:220–6. doi:10.1038/s41565-017-0034-6
31. Wang Y, Chen Q, Yang W, Ji Z, Jin L, Ma X, et al. High-efficiency broadband achromatic metalens for near-IR biological imaging window. Nat Commun (2021) 12:5560. doi:10.1038/s41467-021-25797-9
32. Ramakrishnaiah R, ur Rehman G, Basavarajappa S, Al Khuraif AA, Durgesh BH, Khan AS, et al. Applications of Raman spectroscopy in dentistry: Analysis of tooth structure. Appl Spectrosc Rev (2015) 50:332–50. doi:10.1080/05704928.2014.986734
33. Cordero E. In-vivo Raman spectroscopy: From basics to applications. J Biomed Opt (2018) 23:1. doi:10.1117/1.jbo.23.7.071210
34. Stamatas GN, Nikolovski J, Mack MC, Kollias N. Infant skin physiology and development during the first years of life: A review of recent findings based on in vivo studies. Int J Cosmet Sci (2011) 33:17–24. doi:10.1111/j.1468-2494.2010.00611.x
35. Benoît A, Dauliat R, Jamier R, Humbert G, Grimm S, Schuster K, et al. Highly efficient higher-order modes filtering into aperiodic very large mode area fibers for single-mode propagation. Opt Lett (2014) 39:4561. doi:10.1364/ol.39.004561
36. Wang Y, Zhu X, Chen Y, Shi H, Li Z, Zhang S, et al. Fabrication of Fabry–Perot-cavity-based monolithic full-color filter arrays using a template-confined micro-reflow process. J Micromech Microeng (2019) 29:025008. doi:10.1088/1361-6439/aaf6cb
Keywords: metasurface, fiber, Raman spectroscopy, biosensing, achromatic
Citation: Zhang S, Bi R, Zhang R, Qi Y, Salim RBSM and Olivo M (2022) An all metasurface-based fiber needle probe for Raman spectroscopy. Front. Phys. 10:1093284. doi: 10.3389/fphy.2022.1093284
Received: 08 November 2022; Accepted: 07 December 2022;
Published: 20 December 2022.
Edited by:
Cong Liu, Nokia Bell Labs, United StatesCopyright © 2022 Zhang, Bi, Zhang, Qi, Salim and Olivo. This is an open-access article distributed under the terms of the Creative Commons Attribution License (CC BY). The use, distribution or reproduction in other forums is permitted, provided the original author(s) and the copyright owner(s) are credited and that the original publication in this journal is cited, in accordance with accepted academic practice. No use, distribution or reproduction is permitted which does not comply with these terms.
*Correspondence: Shuyan Zhang, emhhbmdfc2h1eWFuQGliYi5hLXN0YXIuZWR1LnNn; Malini Olivo, bWFsaW5pX29saXZvQGliYi5hLXN0YXIuZWR1LnNn
 Shuyan Zhang
 Renzhe Bi
 Ruochong Zhang
 Yi Qi1