- College of Electronic and Optical Engineering and College of Flexible Electronics (Future Technology), Nanjing University of Posts and Telecommunications, Nanjing, China
In this paper, a new type of photonic crystal fiber (PCF) sensor is proposed for detecting the voltage and magnetic field simultaneously. In the PCF, an air hole of the cladding is coated with gold film and filled with the liquid crystal, thus the surface plasmon resonance (SPR) channel is formed to detect the voltage. While another air hole of the cladding is filled with magnetic fluids, the directional coupling channel is formed to detect the magnetic field. The SPR sensing channel and directional coupling channel are relatively independent. A finite element method (FEM) has been used for the optimization of the structure parameters, transmission characteristics of different modes, and analysis of the sensing characteristics. Numerical results reveal that the voltage sensitivity is 2.11 nm/V in the range of 5–35 V and the magnetic field sensitivity is 0.86 nm/Oe in the range of 90–210 Oe.
Introduction
Electromagnetic fields are almost everywhere. Most of the equipments and systems are affected by their electromagnetic environment, especially in electrical industries, air, and rail transport [1]. The common electromagnetic sensors not only have poor detection accuracy but also are susceptible to electromagnetic interference [2]. Hence, there is an urgent need to develop highly sensitive, anti-electromagnetic interference systems to detect electromagnetic parameters.
Optical fiber sensors have many advantages, such as anti-electromagnetic interference, high-temperature resistance, corrosion resistance [3], etc. Photonic crystal fibers (PCFs) have their unique structures and performance, which make them significant in optical fiber sensing technology research [4–6].
Recently, PCFs have been used by many researchers in the development of electric and magnetic sensors. For sensing of the electric field or voltage, liquid crystal materials were filled in the different PCF structures, such as an all-fiber structure [7], a side-hole structure [8], and an all-polarization state structure [9]. For the sensing of magnetic field, magnetic fluid (MF) materials were filled in the PCFs, the different sensing mechanisms were used, such as surface plasmon resonance (SPR) [10, 11], directional coupling [12, 13], two-core coupling [14], Fabry-Perot (FP) interferometer [15, 16], Mach-Zehnder interferometer (MZI) [17, 18] and Sagnac interferometer [19].
However, these sensors typically operate as single-parameter sensors, the detection of electromagnetic parameters usually requires dual-parameter sensing. At present, the dual-parameter optical fiber sensors of the electric or magnetic fields are in the initial stage of theoretical and experimental research, in which one parameter is mostly temperature. Huang et al. [8] proposed a liquid-crystal-filled side-hole PCF to measure voltage and temperature. The sensitivity of voltage reached 3.88 nm/V, and the temperature sensitivity reached −1.5 nm/°C. Li et al. [18] proposed an in-line modal MZI based on a MF-filled PCF to measure the magnetic field and temperature. The sensitivity of the magnetic field reached 0.072 nm/Oe, and the temperature sensitivity reached 0.080/°C. However, these sensors also can’t realize the simultaneous sensing of electric field and magnetic field, and the sensitivity and quality factor are to be further improved.
In this paper, a new type of voltage and magnetic field PCF sensor based on the mixed effects of SPR and directional coupling is proposed. The SPR channel is designed to detect the voltage and the directional coupling channel to detect the magnetic field. The numerical simulation demonstrates that the sensitivitives of voltage and magnetic field reaches 2.11 nm/V and 0.86 nm/Oe with good linearity respectively.
Design of voltage and magnetic field sensing structure
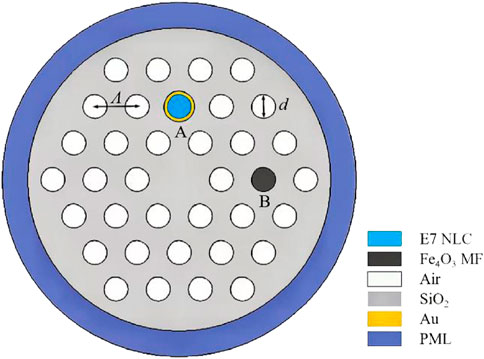
A cross-section diagram of the PCF electromagnetic sensing structure is shown in Figure 1. The fiber structure contains three layers of triangular-lattices arranged air holes with diameter d and lattice constant Λ. The thin gold film with thickness t is coated inside the air hole A, and an E7 nematic liquid crystal (NLC) is filled in the air hole A. The air hole A is used as an SPR channel to detect the voltage. Fe4O3 MF is filled in air hole B which is used as a directional coupling channel to detect the magnetic field.
When the applied voltage exceeds the threshold, molecules of the liquid crystal deflect an angle θ under the action of the electric field. The equation of the angle with the voltage V is [20]:
where Vc is the threshold voltage and its value is
Where no1 is the ordinary refractive index of liquid crystal and nc is the refractive index of air. Due to the anisotropy of NLC, n´ and n˝ are the refractive index at the different orientation. Thus, the refractive index of liquid crystal changes with the applied voltage.
The refractive index of MF is affected by the external magnetic fields and temperature. The relationship can be described by Langevin Equation [21]:
Where H is the intensity of the magnetic field, Hcn is the threshold value of the magnetic field, T is the temperature and α is the fitting parameter. no2 is the refractive index of the MF with no external magnetic field (or the magnetic field strength is less than the threshold value). Besides, ns is the saturated refractive index when the magnetic field increases to a certain degree, no2 and ns are constants only related to magnetic fluid materials.
The base material of the sensor is silicon dioxide (SiO2). The refractive index of SiO2 can be obtained by the Sellmeier formula [22]:
Where, λ is the wavelength of incident light, B1 = 0.696163, B2 = 0.4079426, B3 = 0.8974794, C1 = 4.67914826 × 10⁻³, C2 = 1.35120631 × 10⁻², and C3 = 97.9340025.
The dielectric constant of gold is derived from the Drude model [23]:
Where, εAu refers to the permittivity of gold, ε∞ represents the permittivity at high frequency with a value of 5.9673. ωD is the plasma frequency and ωD/2π = 2113.6 THz γD is the damping frequency, γD/2π = 15.92 THz. The angular frequency can be expressed as ω = 2πc/λ, c is the velocity of light in vacuum. ∆ε = 1.09, ΓL/2π = 104.86 THz, and ΩL/2π = 650.07 THz.
Figure 2 is the simulation experimental system of the proposed sensing structure. A voltage is applied along the PCF section direction and a magnetic field is applied radially along the PCF. The proposed PCF is connected with two single-mode fibers (SMFs), which can be considered as a bridge between broadband light and optical spectrum analyzer (OSA). The incident light passes through the PCF sensing structure and finally obtains the loss characteristics in OSA. The applied voltage and magnetic field can be detected by numerical analysis.
Results and discussion
Numerical simulation of the proposed PCF sensing structure is gotten by the finite element method (FEM) with perfectly matched layer boundary conditions.
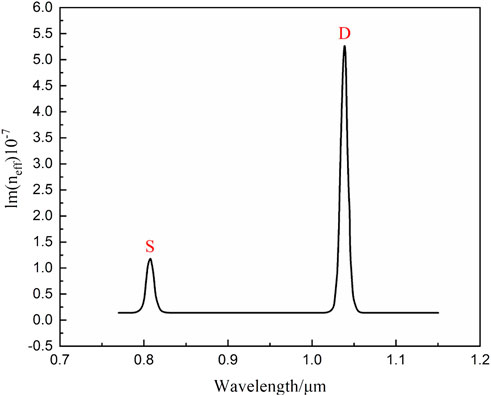
The surface plasmon polariton (SPP) mode and defect mode of the PCF resonate with the core mode, respectively, to generate two separate loss peaks in the optical fiber spectrum, as shown in Figure 3. NLC and MF are selectively filled in the PCF. The change of the refractive index in the PCF, which is caused by the applied voltage and magnetic field, leads to the displacements of the loss peaks. The displacements of the loss peaks can be analyzed to realize the electromagnetic double-parameter sensing.
The loss characteristics of PCF are analyzed by the imaginary part Im (neff) of the effective refractive index neff in core mode, as shown in Figure 3, where the temperature is 25°C, the magnetic field intensity is 210 Oe, and the voltage is 35 V. From Figure 3, it can be seen that there are two separate resonance loss peak S and D in the near-infrared spectroscopy (NIR). Loss peak S is at 0.805 μm and is controlled by the SPR channel for voltage sensing. Loss peak D is at 1.037 μm and is controlled by the directional coupling channel for magnetic field sensing.
Through numerical simulation, it is found that the relative position of the resonance peak of the directional coupling magnetic field sensing does not vary with the influence of the SPR sensing channel. In addition, the SPR voltage sensing is not affected by the directional coupling sensing channel. Hence, the SPR sensing channel and the directional coupling sensing channel are relatively independent.
The structural parameters of the proposed sensing structure have a great influence on confinement loss and sensing properties. The main parameters of PCF affecting the double-parameter sensing properties are the number of air hole layers (N), the lattice constant (Λ), the air hole diameter (d), and the gold film thickness (t). Among these, the lattice constant Λ and the number of air hole layers N have been calculated to have almost no effect on sensing performance. Therefore, N is determined to be 3 and Λ to be 8 μm. On this basis, the influence of d, and t on voltage and magnetic field double-parameter sensing are analyzed in the following sections.
Analysis of voltage sensing characteristics
Dispersion characteristics and loss characteristics of core mode, as well as the dispersion characteristics of SPP mode, are shown in Figure 4, where the temperature is 25°C, the magnetic field intensity is 210 Oe, and the voltage is 35 V. When the resonance matching condition is satisfied between core mode and SPP mode at the point A, the energy is transferred from core mode to SPP mode, the SPR effect occurs. The loss of core mode increases and finally reaches the maximum. Hence, a narrow loss peak at resonance wavelength of 0.805 μm occurs. The corresponding field distribution of core mode is shown in Figure 4(1). When neffc < neffs, the resonance matching condition is not satisfied at the point B, the energy will be concentrated in the fiber core. The corresponding distribution of the core mode is shown in Figure 4(3). Here, neffs is the real part of the effective refractive index of SPP mode, neffcis the real part of the effective refractive index of core mode. When neffc > neffs, the energy is limited in the SPP mode at the point C, and the corresponding distribution of the SPP mode is shown in Figure 4(2).
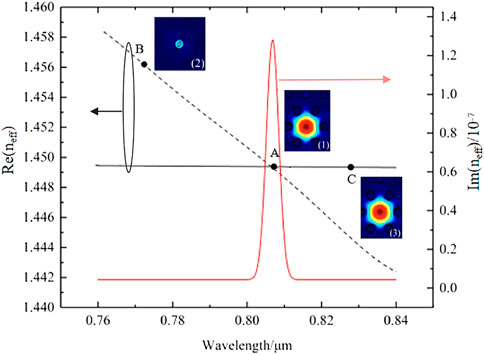
FIGURE 4. Dispersion characteristics (black solid line) and loss characteristics (red solid line) of core mode, as well as the dispersion characteristics (dotted black line) of SPP mode. (Illustrations (1) and (3) are the field distributions of core mode at points (A,C). Illustration (2) is the field distribution of SPP mode at point (B).).
Figure 5A shows the loss curves of core mode under SPR effect for air hole diameters d of 0.40Λ, 0.42Λ, and 0.44Λ, respectively. As can be seen, the resonance matching point is shifted towards a longer wavelength with the increase of cladding air holes. At the same time, the loss peak and the full width at half-maximum (FWHM) both reduced significantly. Figure 5B shows the variation of resonance wavelength with voltage for different d. The voltage sensing sensitivity is 2.06 nm/V, 2.11 nm/V, and 2.07 nm/V when d is 0.40Λ, 0.42Λ, and 0.44Λ, respectively. On balance, it is determined that the SPR effect-based voltage sensing is best achieved with an air hole diameter of d = 0.42Λ.
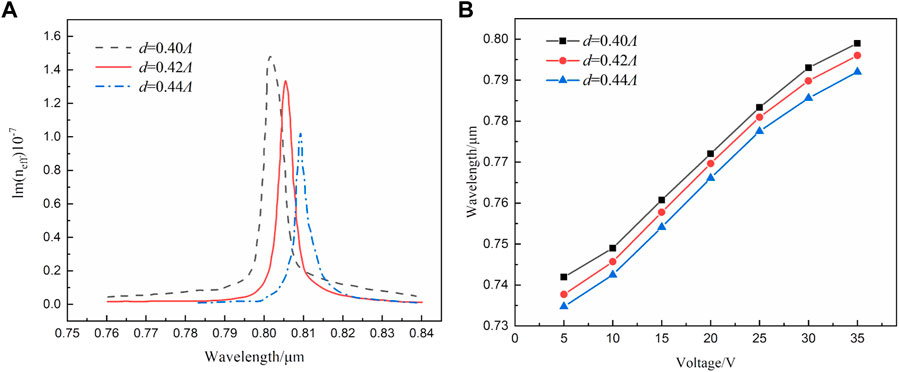
FIGURE 5. Influence of different air hole diameter d on sensing characteristics under SPR effect by setting N = 3, Λ = 8 μm, t = 40 nm. (A) The loss curves of core mode for different d. (B) The resonance wavelength with voltage for different d.
The influence of the gold film thickness t on the voltage sensing characteristics under SPR effect is then discussed. The loss curves of core mode for gold film thicknesses t of 30 nm, 40 nm, and 50 nm are shown in Figure 6A, respectively. As t increases, the loss peak decreases significantly. This is due to the thickened gold film absorbing the energy propagating from the fiber core to the cladding. As a result, the liquid crystal gains very weak energy in air hole A, which weakens the SPR resonance strength and reduces the loss peak. Figure 6B shows the variation of resonance wavelength with voltage for different t. The voltage sensing sensitivity is almost equal for different t. After comprehensive consideration, the final gold film thickness is determined as t = 40 nm.
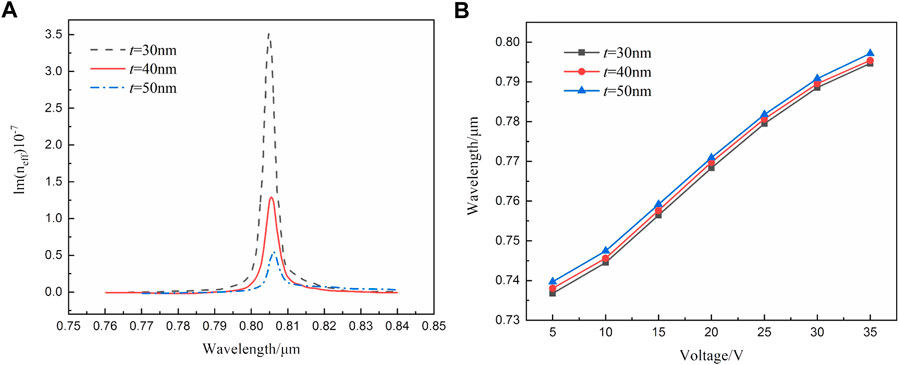
FIGURE 6. Influence of Au thickness t on sensing characteristics under SPR effect by setting N = 3, Λ = 8 μm, d = 0.42Λ. (A) The loss curves of core mode for different t (B) The resonance wavelength with voltage for different t.
The refractive index of E7 NLC is changed with applied voltage, the matching position between the core mode and defect mode is changed, which makes shifting of the loss peak of the core mode in the PCF. Therefore, the voltage can be measured indirectly from the position of the core mode’s loss peak. The voltage sensitivity can be obtained by calculating the shift of the resonance wavelength, which is expressed as:
where
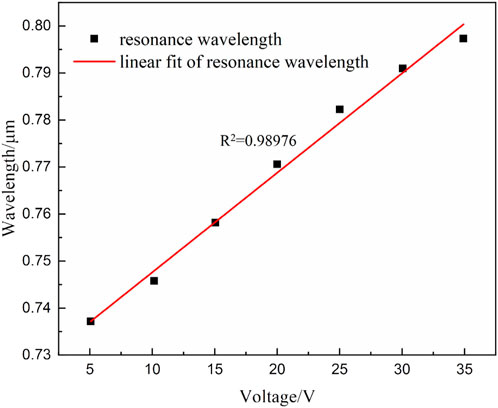
At the situation of 25°C and 210 Oe, the relationship between resonant wavelength and voltage is shown in Figure 7, by setting N = 3, Λ = 8 μm, d = 0.42Λ, t = 40 nm. The loss peak has a redshift with increasing voltage. In the voltage range of 5–35 V, the voltage sensitivity of the proposed PCF sensor is 2.11 nm/V and the linearity is 0.98976.
Analysis of magnetic field sensing characteristics
Dispersion characteristics and loss characteristics of core mode, as well as the dispersion characteristics of defect mode in directional coupling channel, are shown in Figure 8, where the temperature is 25°C, the magnetic field intensity is 210 Oe, and voltage is 35 V. When the wave vector matching condition is satisfied between core mode and defect mode at the point A, the energy is mostly transferred from core mode to defect mode, the directional coupling effect occurs. The loss of core mode increases and finally reaches the maximum. Hence, a narrow loss peak at resonance wavelength of 1.037 μm occurs. The corresponding field distributions of the core mode and defect mode at the directional coupled state are shown in Figure 8(1). When neffc < neffd, the wave vector matching condition is not satisfied at the point B, the energy is concentrated in the core. The corresponding distribution of the defect mode is shown in Figure 8(2). Here, neffd is the real part of the effective refractive index of defect mode. When neffc > neffd, the energy is limited in the defect mode at the point C, the corresponding distribution of the core mode is shown in Figure 8(3).
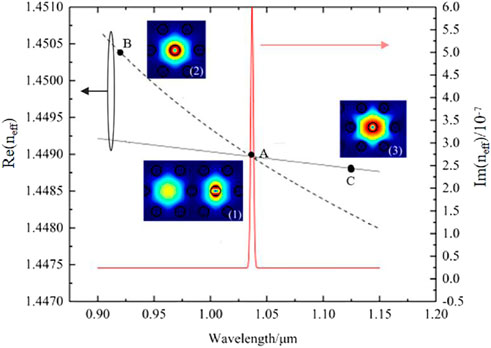
FIGURE 8. Dispersion characteristics (black solid line) and loss characteristics (red solid line) of core mode, as well as the dispersion characteristics (dotted black line) of defect mode in directional coupling channel. [Illustrations (1) is the field distributions of core mode and defect mode at point (A). Illustration (2) is the field distribution of directional coupled-mode at point (B). Illustrations (3) is the field distributions of core mode at point (C)].
Figure 9A shows the loss curves of core mode for air hole diameters d of 0.40Λ, 0.42Λ, and 0.44Λ under directional coupling effect, respectively. With the increase of diameter d, the resonance wavelength shifts toward longer wavelength while the FWHM remains. Figure 9B shows the variation of resonance wavelength with magnetic field for different d. The magnetic field sensing sensitivity is 0.79 nm/Oe, 0.86 nm/Oe, and 0.68 nm/Oe when the air hole diameters d is 0.40Λ, 0.42Λ, and 0.44Λ, respectively. After comprehensive consideration, the final gold film thickness is determined as d is 0.42Λ.
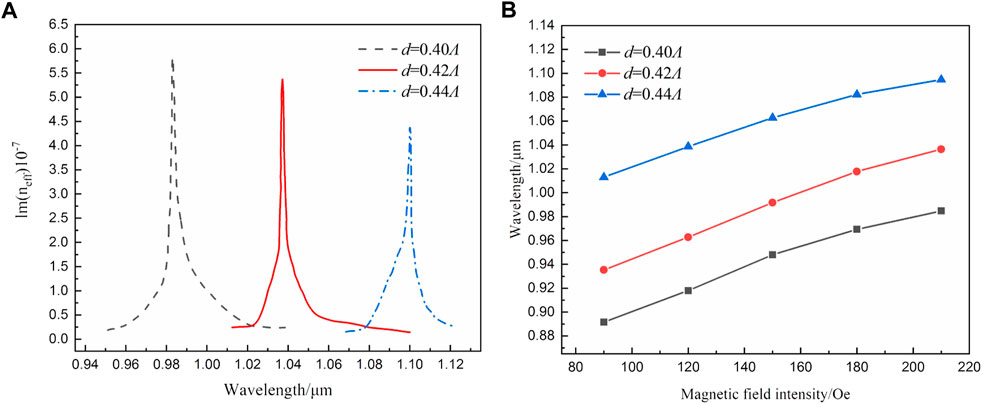
FIGURE 9. Influence of different air hole diameter d on sensing characteristics under directional coupling effect by setting N = 3, Λ = 8 μm, t = 40 nm. (A) The loss curves of core mode for different d. (B) The resonance wavelength with magnetic field intensity for different d.
Thus magnetic field can be measured indirectly from the position of the core mode’s loss peak. The magnetic field sensitivity can be obtained by calculating the shift of the resonance wavelength, which is expressed as:
where
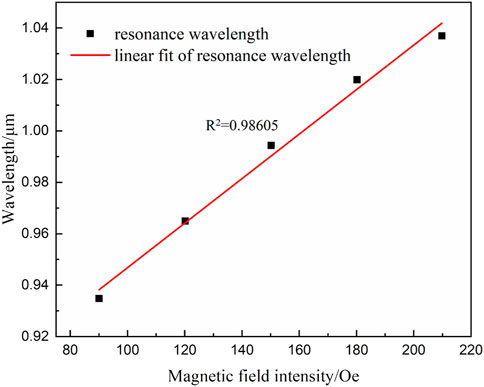
At the situation of 25°C and 35 V, the relationship between resonant wavelength and magnetic field intensity is shown in Figure 10 by setting N = 3, Λ = 8 μm, d = 0.42Λ, t = 40 nm. The loss peak has a redshift with increasing magnetic field intensity. In the magnetic field range of 90–210 Oe, the magnetic field sensitivity of the proposed PCF sensor is 0.86 nm/Oe and the linearity is 0.98605.
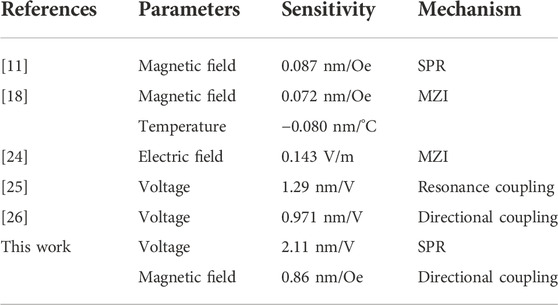
Table 1 shows a comparative study between the proposed design and other sensors reported in recent years in terms of sensing performance. It can be seen that PCF electromagnetic sensing structure in this paper has a higher sensitivity and is able to detect voltage and magnetic field double-parameter.
Conclusion
A novel electromagnetic double-parameter PCF sensing structure combined with the SPR effect and directional coupling effect has been proposed in this paper. NLC is filled in a gold-coated air hole to form the SPR channel for voltage sensing detection. MF is filled in another air hole to form the directional coupling channel for magnetic field sensing detection. The SPP mode and defect mode of the PCF resonate with the core mode respectively, to generate two independent loss peaks in the optical fiber spectrum. It can be seen that in the range of 5–35 V and 90–210 Oe, the sensitivities of voltage and magnetic field reach 2.11 nm/V and 0.86 nm/Oe respectively with good linearity. The electromagnetic dual-parametric sensing structure designed in this paper has the advantages of simple structure and the ability to achieve simultaneous independent sensing of both voltage and magnetic field. The proposed dual-parametric sensing structure has potential application prospects in electromagnetic environment monitoring.
Data availability statement
The raw data supporting the conclusion of this article will be made available by the authors, without undue reservation.
Author contributions
WS: Supervision, project administration, writing review and editing. RM: Writing-review, project administration, data curation and editing. XG: Writing-original draft. RJ: Writing-review and editing. MS: Writing-review and editing. QL: Writing-review and editing. HZ: Writing-review and editing. LZ: Writing-review and editing. HW: Funding acquisition. All authors have read andagreed to the published version of the manuscript.
Funding
This work was supported in part by National Natural Science Foundation of China under Grant 61571237, and in part by General program of Natural Science Foundation of Jiangsu Province under Grant BK20221330.
Conflict of interest
The authors declare that the research was conducted in the absence of any commercial or financial relationships that could be construed as a potential conflict of interest.
Publisher’s note
All claims expressed in this article are solely those of the authors and do not necessarily represent those of their affiliated organizations, or those of the publisher, the editors and the reviewers. Any product that may be evaluated in this article, or claim that may be made by its manufacturer, is not guaranteed or endorsed by the publisher.
References
1. Christoforidis GC, Papadopoulos TA, Parisses C, Mantzaras GE. Photovoltaic power plants as a source of electromagnetic interference to metallic agricultural pipelines. Proced Technol (2013) 8(3):192–9. doi:10.1016/j.protcy.2013.11.027
2. Peng J, Jia SH, Bian JM, Zhang S, Liu J, Zhou X. Recent progress on electromagnetic field measurement based on optical sensors. Sensors (2019) 19(13):2860. doi:10.3390/s19132860
3. Gordon KL. Thermometry and dosimetry of heat with specific reference to the liquid-crystal optical fiber temperature probe. Radiat Environ Biophys (1980) 17(3):233–43. doi:10.1007/BF01323650
4. Chaudhary VS, Kumar D, Kumar S. Gold-immobilized photonic crystal fiber-based SPR biosensor for detection of malaria disease in human body. IEEE Sens J (2021) 21(16):17800–7. doi:10.1109/JSEN.2021.3085829
5. Mishra GP, Kumar D, Chaudhary VS, Kumar S. Design and sensitivity improvement of microstructured-core photonic crystal fiber based sensor for methane and hydrogen fluoride detection. IEEE Sens J (2021) 22(2):1265–72. doi:10.1109/JSEN.2021.3131694
6. Chaudhary VS, Kumar D, Kumar S. Au-TiO2 coated photonic crystal fiber based SPR refractometric sensor for detection of cancerous cells. IEEE Trans Nanobioscience (2022) 1. doi:10.1109/TNB.2022.3219104
7. Meng QY, Ren GH. Experimental study on electric field sensing of reflective doped liquid crystal photonic crystal fiber. J Optoelectonics·Laser (2012) 23(9):1713–6. doi:10.16136/j.joel.2012.09.005
8. Huang YJ, Wang Y, Mao C, Wang J, Wu H, Liao C, et al. Liquid-crystal-filled side-hole fiber for high-sensitivity temperature and electric field measurement. Micromachines (2019) 10(11):761. doi:10.3390/mi10110761
9. Liu H, Wu CQ, Lan SF, Yang W. Suspended optical fiber voltage sensor based on all polarization state detection. Acta Photonica Sinca (2014) 43(7):706016. doi:10.3788/gzxb20144307.0706016
10. Wang JK, Ying Y, Gao ZJ, Cheng SY, Si GY. Surface plasmon resonance (SPR) based temperature and magnetic field sensor in a dual-core D-shaped photonic crystal fiber (PCF). Instrumentation Sci Technol (2021) 1(17):271–87. doi:10.1080/10739149.2021.1994417
11. Islam MR, Khan MMI, Siraz S, Islam M, Mehjabin F, Rahman M, et al. Design and analysis of a QC-SPR-PCF sensor for multipurpose sensing with supremely high FOM. Appl Nanosci (2022) 12(1):29–45. doi:10.1007/s13204-021-02150-6
12. Liu H, Wang Q, Ding Y, Li HW, Wang M, Wang HR, et al. Concurrent measurements of temperature and magnetic-field based on the combined use of modal interference and directional coupling in photonic crystal fiber. Optik (2019) 179:62–70. doi:10.1016/j.ijleo.2018.10.132
13. Liang Y, Zhang H, Guo H, Wang Y, Gao Y, Ma H, et al. Simultaneous measurement of temperature and magnetic field based on directional resonance coupling in photonic crystal fibers. Opt Commun (2017) 391:111–5. doi:10.1016/j.optcom.2017.01.024
14. Zhang YJ, Wang LZ, Jia PG, Zhu F, Zhai C, Liu L, et al. High-sensitivity refractive index sensor with cascaded dual-core photonic crystal fiber based on vernier effect. Optik (2022) 256:168488. doi:10.1016/j.ijleo.2021.168488
15. Zhao Y, Lv RQ, Ying Y, Wang Q. Hollow-core photonic crystal fiber Fabry-Perot sensor for magnetic field measurement based on magnetic fluid. Opt Laser Technol (2012) 44(4):899–902. doi:10.1016/j.optlastec.2011.11.011
16. Greice KBC, Gouvêa PMP, Soares LMB, JoãoPereira MB, Favero F, ArthurBraga MB, et al. In-fiber Fabry-Perot interferometer for strain and magnetic field sensing. Opt Express (2016) 24(13):14690–6. doi:10.1364/OE.24.014690
17. Taghizadeh M, Bozorgzadeh F, Ghorbani M. Designing magnetic field sensor based on tapered photonic crystal fibre assisted by a ferrofluid. Sci Rep (2021) 11(1):14325. doi:10.1038/s41598-021-93568-z
18. Li XG, Zhou X, Zhao Y, Lv RQ. Multi-modes interferometer for magnetic field and temperature measurement using Photonic crystal fiber filled with magnetic fluid. Opt Fiber Technol (2018) 41(9):1–6. doi:10.1016/j.yofte.2017.12.002
19. Zhao Y, Wu D, Lv RQ, Li J. Magnetic field measurement based on the sagnac interferometer with a ferrofluid-filled high-birefringence photonic crystal fiber. IEEE Trans Instrum Meas (2016) 65(6):1503–7. doi:10.1109/TIM.2016.2519767
20. Wu T, Yang D, Liu Z, Yang Z, Cao W, Wang Y. Multifunctional optoelectronic device based on liquid crystal selectively filled flat-plate photonic crystal fiber. Optik (2021) 250:168328. doi:10.1016/j.ijleo.2021.168328
21. Hong CY, Horng HE, Yang SY. Tunable refractive index of magnetic fluids and its applications. Phys Stat Sol (2004) 1(7):1604–9. doi:10.1002/pssc.200304388
22. Malitson IH. Interspecimen comparison of the refractive index of fused silica. J Opt Soc Am (1965) 55(10):1205–9. doi:10.1364/josa.55.001205
23. Vial A, Grimault AS, Macías D, Barchiesi D, de la Chapelle ML. Improved analytical fit of gold dispersion: Application to the modeling of extinction spectra with a finite-difference time-domain method. Phys Rev B (2005) 71(8):085416. doi:10.1103/physrevb.71.085416
24. Zhao Y, Zhang YN, Lv RQ, Li J. Electric field sensor based on photonic crystal cavity with liquid crystal infiltration. J Lightwave Technol (2017) 35(16):3440–6. doi:10.1109/JLT.2016.2576500
25. Wang WL, Liu Q, Liu ZY, Wu Q, Fu YQ. Simulation of a temperature-compensated voltage sensor based on photonic crystal fiber infiltrated with liquid crystal and ethanol. Sensors (2022) 22(17):6374. doi:10.3390/s22176374
Keywords: surface plasmon resonance, directional coupling, photonic crystal fiber, voltage, magnetic field, E7 nematic liquid crystal, sensor
Citation: Shi W, Mu R, Guo X, Jiang R, Shangguan M, Li QF, Zhang H, Zhang L and Wan H (2022) Double-parameter sensing of voltage and magnetic field based on photonic crystal fiber. Front. Phys. 10:1091435. doi: 10.3389/fphy.2022.1091435
Received: 07 November 2022; Accepted: 17 November 2022;
Published: 29 November 2022.
Edited by:
Santosh Kumar, Liaocheng University, ChinaReviewed by:
Dharmendra Kumar, Madan Mohan Malaviya University of Technology, IndiaJin Li, Northeastern University, China
Copyright © 2022 Shi, Mu, Guo, Jiang, Shangguan, Li, Zhang, Zhang and Wan. This is an open-access article distributed under the terms of the Creative Commons Attribution License (CC BY). The use, distribution or reproduction in other forums is permitted, provided the original author(s) and the copyright owner(s) are credited and that the original publication in this journal is cited, in accordance with accepted academic practice. No use, distribution or reproduction is permitted which does not comply with these terms.
*Correspondence: Weihua Shi, bmp1cHRfc2hpd2hAMTI2LmNvbQ==
†These authors have contributed equally to this work
 Weihua Shi*†
 Rongqiu Mu
 Rushan Jiang