- 1Data Science and Technology, North University of China, Taiyuan, China
- 2School of Mathematics, North University of China, Taiyuan, China
Acute respiratory illness caused by human adenovirus have been increasing in morbidity and mortality in recent years. Currently, isolation of symptomatic infected individuals is the primary means of controlling outbreaks in closed spaces such as schools and military camps. However, the disease is still spreading despite the implementation of control measures. To reveal the underlying mechanism of this phenomenon, we propose a dynamic model that considers invisible transmission and isolated confirmed cases. By calculating and analyzing the control reproduction number, it is found that asymptomatic infected individuals play an important role in the spread of the epidemic. Therefore, in the absence of specific vaccines, non-pharmaceutical interventions such as quarantine of exposed individuals are effective means to mitigate severity. The results show that the earlier the control of invisible transmission is implemented, the lower the peak and the shorter the duration of the outbreak. These findings will provide the theoretical basis and recommendations for prevention and control of human adenovirus transmission in closed spaces.
1 Introduction
Acute respiratory illness (ARI) is a widespread disease with increasing morbidity and mortality year by year [1–3]. The common pathogen causing respiratory infections is human adenovirus (HAdV), which can cause human illnesses ranging from mild upper respiratory infections to lethal pneumonia diseases [4]. HAdV first appeared in 1953, was isolated from a small proliferating gland in the tonsils of children who had been surgically removed, and was officially named in 1956. It is a kind of DNA virus with more than 90 serotypes identified and divided into seven subgenera, among which respiratory infections are mostly caused by subgenus B, subgenus C and subgenus E [5, 6]. HAdV is highly contagious and often causes outbreaks, and it is transmitted primarily through human behavioral contact or environmental contact such as air and water [7]. Adenovirus infections are most prevalent in winter and spring, and mainly happen in enclosed and crowded places, like military, school, and hospital. People are universally susceptible, about half of them are asymptomatic infections, and those who recover have no permanent immunity and can be reinfected again. If the virus does not cause damage to other vital organs, an infected person can heal on its own, but if it causes damage to vital organs, it can be life-threatening. Currently, no adenovirus vaccine is available in China, only United States military is taking the oral adenovirus vaccine of type 4 and type 7. Therefore, it is essential to study the mechanisms of adenovirus transmission in specific places and to explore the role of non-pharmacological interventions to prevent the spread of HAdV. Our paper focuses on ARI induced by human adenovirus in closed schools. On campus, type B-7, type B-14 and type B-55 are the main pathogens of the disease. Among them, type B-7 can cause febrile respiratory illness, bronchitis and pneumonia. Type B-14, a virus type previously thought to be less pathogenic, has attracted significant attention for causing an epidemic of severe respiratory infections, which can even cause fatal injuries. The case fatality rate for ARI caused by B-14 is 5 percent in four states of the United States of America [8, 9]. Type B-55, a novel type B adenovirus first identified in China in 2006 and characterized in 2010, is a recombinant gene of type B-11 and type B-14 [10–13]. Outbreaks of respiratory infections caused by type B-55 in adults primarily cause symptoms of upper respiratory tract infections and are likely to occur in densely populated, high-intensity military training places. In addition, adenovirus spreads rapidly and is prone to severe cases [13]. The main reasons why ARI caused by HAdV is prone to prevalence and outbreaks on campus are as follows. First of all, the clinical manifestations of adenovirus infection are very similar to other respiratory pathogens such as parainfluenza, and it is difficult to differentiate the symptoms and can only be determined by laboratory diagnosis. Second, the high concentration of students, especially during classes or during meals, is consistent with all factors for the occurrence and prevalence of respiratory infections. And finally, there is currently no available adenovirus vaccine in China.
Dynamical modeling is an essential and effective method for revealing the transmission mechanism of infectious diseases and evaluating interventions. It is widely used in the study of various infectious diseases, for example, in the study of epidemics such as Brucellosis [14] Influenza [15, 16], Foot-and-mouth disease [17], Ebola virus [18], Severe Acute Respiratory Syndromes [19] and COVID-19 [20–24]. In recent years, HAdV has been studied from the perspective of epidemiology and biomedicine [25–28], examining data obtained from laboratory diagnoses, giving certain incidence rates and epidemiologic characteristics of each disease [3, 29]. In 2020, Guo et al. [30] proposed an individual-based random collision model from the perspective of dynamic model to simulate the spread of adenovirus type 7 in a military camp. The model is highly accurate and provides greater flexibility in setting population exposure and the activity of different types. However, the literature lacks a setting for invisible infections, resulting in incomplete transmission routes for adenovirus and underestimating its actual transmission capacity.
In fact, a large part of the ARI outbreaks caused by HAdV stems from the presence of asymptomatic infected individuals. It is impossible to actively and effectively avoid contact with them because we are unable to identify them, which leads to the spread of the virus. Asymptomatically infected individuals are not only a prominent feature of HAdV transmission, but also a critical factor in current preventive and control measures. In addition, many non-pharmacological interventions, including quarantine measure, have been implemented in military camps and schools to control outbreaks and halt transmission of the disease. Arino et al. [31] and Wang et al. [32] developed dynamic model on asymptomatic infected individuals and estimated the importance of the proportional parameter representing symptomatic infected for the pandemic. Jin et al. [33] considered the impact of quarantine strategy, and the results suggest that quarantine has a significant role to reduce malaria transmission.
With the purpose of theoretically revealing the impact of the hidden transmission route on adenovirus transmission, we constructed models containing asymptomatic infected and isolated individuals to explore the nature of HAdV transmission based on actual data. The structure of this paper is shown as follows. Firstly, through the fitting analysis of three groups of real data, the model is proved to be correctness, practicability and universality. Then, through theoretical analysis, the expression of control reproduction number is obtained and the values of the three types of data are calculated to be greater than one, which is the reason why the epidemics is still outbreak despite a series of measures taken by the school. Further, by analyzing the sensitivity of the model parameters, we find the main parameters that could control the spread of the epidemic, and find that the invisible transmission plays an important role in the high outbreak of the epidemic. In the absence of specific vaccines and in order to effectively the aim of effectively control the invisible transmission, non-pharmaceutical interventions are effective means to mitigate severity.
2 Materials and methods
2.1 Data
We will present three complete sets of confirmed cases of ARI caused by HAdV, which occurred in different cities of China and with different virus types. Adenovirus type B-7 was an outbreak that occurred at a school in Tangshan, Hebei Province in 2019, type B-14 occurred at a school in Dunhuang, Gansu province in late 2014, and type B-55 data were obtained from an outbreak at a school in Baoding, Hebei Province in 2012. The data of three types are shown in Figure 2. And we will fit the three type data with following mathematical model. In fact, the number of cases reported daily is so small that the model is fitted with cumulative data of confirmed persons. It is essential to note that the early confirmed cases of type B-14 include other febrile cases due to the lack of laboratory diagnosis. So, in order to eliminate the effect of other viruses, we select the later data (containing only confirmed cases of type B-14) for the fits to validate the applicability of the model to the same adenovirus type.
2.2 Model formulation
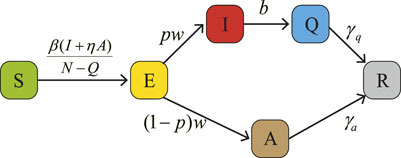
Our research is mainly to establish an appropriate and reasonable model to help the school to solve the difficulties encountered in the process of HAdV research. As HAdV causes a small scare on campus, some schools have implemented quarantine measures for those infected with symptoms. Before presenting the dynamic model, we explain the meaning of the variables involved in the model. The total population of model is divided into the following six groups:
• S(t): the all susceptible individuals in the school at time t who will be infected when they contact with infected individuals;
• E(t): the group of latent persons at time t, indicating that susceptible persons have been infected, but have not yet developed any symptoms and cannot infected other susceptible people;
• I(t): the group of symptomatically infected persons at time t who exhibit symptoms of HAdV and can infect other susceptible persons;
• A(t): the group of asymptomatically infected persons at time t who do not exhibit symptoms of HAdV but can infect other susceptible persons;
• Q(t): the group of individuals isolated from symptomatically infected persons at time t. In this group, infections will not infect susceptible population;
• R(t): the group of recovered persons at time t.
Furthermore, the dynamic model is developed on the basis of the following assumptions.
• This paper focuses on the short-term transmission of infectious diseases within enclosed places, and therefore assumes that there are no immigration, no natural births and no natural deaths. In addition, because there are no deaths in the outbreak we will study, the model hypothesizes no deaths due to disease. Thus, the total population in the closed place remains constant, denoted as N.
• It is noted that adenovirus is seasonal, but the outbreak of ARI will lasts less than 3 months, which is not enough to span a season, so our model does not consider the seasonality of the virus. On the other hand, given the short duration of the outbreak, recovered individuals are considered immune for the duration, in other words, recovered individuals will not be reinfected.
• The incidence of infectious diseases is considered to be the standard incidence, i.e.
• In Equation 1, the proportion of latent people that get symptomatic disease is defined by the parameter p (0 ≤ p ≤ 1), and the parameter η (0 < η ≤ 1) denotes the reduction factor of the contagiousness of asymptomatic infections [34]. Since asymptomatic infected individuals are infectious, we assume that η > 0. Indeed, due to the lack of complete clinical data on asymptomatic infected individuals, the model will have a challenge in ascertaining the percentage of asymptomatic infections and the contagiousness of asymptomatic infections. In this case, we assume that an asymptomatic infected person is as infectious as a symptomatic infected person, i.e. η = 1, as shown in Equation 2.
• When the disease was discovered, the school immediately took control measures. Infected persons appearing symptoms are sent to isolation and treatment at a rate of b.
According to the pathogenesis and transmission of HAdV, we establish the compartmental dynamic model as shown in Figure 1. The specific mathematical model is represented by Equations 1, 2, while Table 1 contains the description and the values of the relevant parameters.When the factor satisfies η = 1, the model is:
In the following study, we will discuss around the model 2), including the dynamic analysis and practical application of that.
2.3 Model analysis
2.3.1 The control reproduction number
Before conducting the mathematical analysis, we observe that the last equation of model 2) is uncoupled to the others, so that the dynamic analysis of the original model is transformed into the study of the following subsystem.
Now, we give the forward invariant region of the model, it means that the initial value of the model in the positive invariant region Ω and the solution of the model remains in this region for all t (t > 0).
2.3.2 Stability analysis
3 Results
3.1 Fitting result
After a theoretical analysis of the model, we will examine the broad applicability of the model 2). We use Markov-chain Monte-Carlo (MCMC) method to fit the cumulative symptomatically infected cases (see Figure 2). The implementation of Markov chain simulation results of three sets of data in 10,000 samples are shown in Figure 3, Figures 4, 5, respectively. And the Geweke is used for Markov convergence diagnosis of the estimated parameters in the three different types, which is shown in Table 2. In addition, there are other values obtained by MCMC program, such as the mean values, variance values and MCMC errors of the estimated parameters.
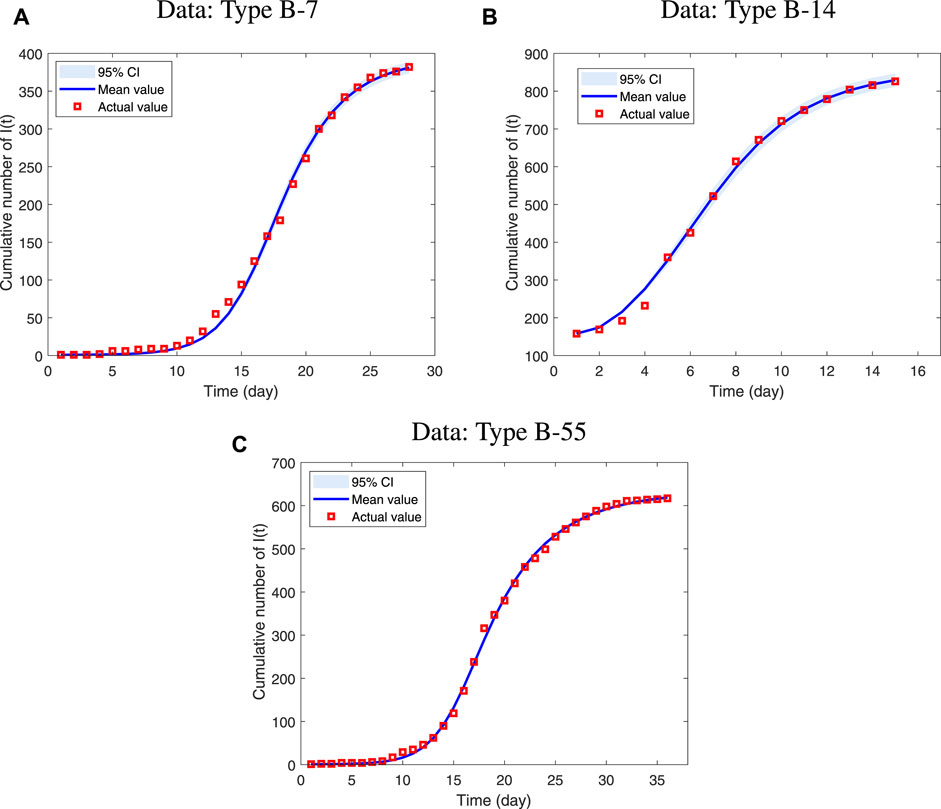
FIGURE 2. MCMC fitting results of cumulative symptomatically infected cases in three types of data respectively, where Red squares are represent the real data and blue lines are fitting curves. (A) The data type is B-7 and it happened at a school in Tangshan. The onset time was from 2019.01.26 to 2019.02.22. (B) The data type is B-14 and it happened at a school in Dunhuang. The onset time was from 2014.12.26 to 2015.02.02 (C) The data type is B-55 and it happened at a school in Baoding. The time of the disease was from 2012.01.24 to 2012.02.28.
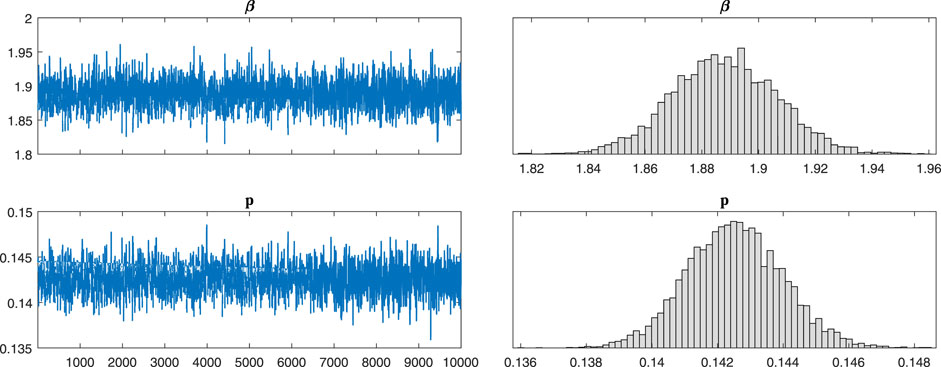
FIGURE 3. The implementation of Markov chain simulation results of three sets of data in 10,000 samples. It is simulation results for parameters β and p in type B-7.
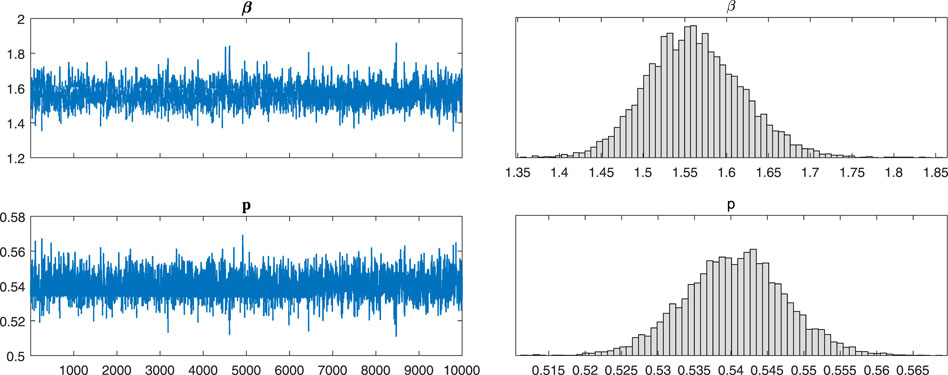
FIGURE 4. The implementation of Markov chain simulation results of three sets of data in 10,000 samples. It is simulation results for parameters β and p in type B-14.
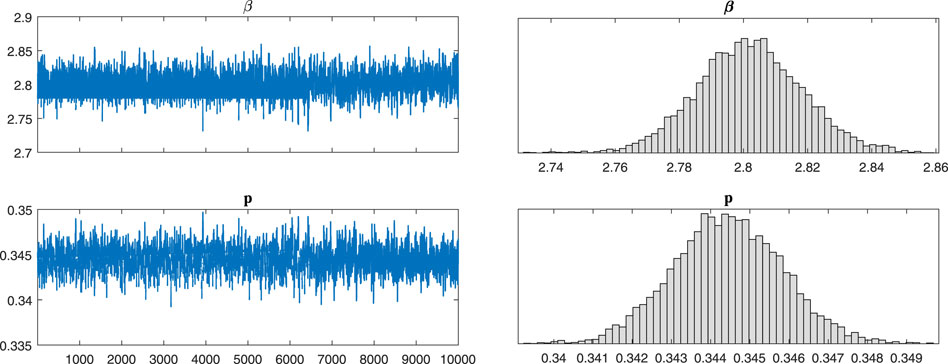
FIGURE 5. The implementation of Markov chain simulation results of three sets of data in 10,000 samples. It is simulation results for parameters β and p in type B-55.
In the graphs above, the three sets of real confirmed data fit well with the model simulated data. While ignoring the differential types of human adenovirus, our proposed model can reflect the transmission law of ARI caused by HAdV in schools under isolation conditions. The estimated results of the parameters and specific values of other model parameters are shown in Table 3. By calculation, the control reproduction numbers of different adenovirus type are 10.7898, 9.9524 and 12.9512 respectively. From the results, the control reproduction number of all three data is around ten, which is generally consistent with the total number of symptomatic and asymptomatic infections at the beginning of the epidemic in the real situation. As the number of susceptible people decreases, the control reproduction number also decreases, and in a closed space, the epidemic will quickly spread to the entire campus in about a month. At the same time, Rc > 1 can be interpreted by the fact that the epidemic is still prevalent despite the isolation control efforts, and that the trajectory increases to a maximum value before falling back to zero since the model has only one disease-free equilibrium point.
3.2 Sensitivity analysis
In an attempt to find the key factors contributing to the outbreak and effective control of the spread of the epidemic, a series of sensitivity analyses of model 2) are presented below. For different types of HAdV, the trends in the sensitivity analysis are the same due to the use of the same mathematical model. Therefore, we only choose the B-7 type as a case for analysis.
3.2.1 Sensitivity analysis about three groups
In this section, we discuss the effects of changes in each parameter in the model on the population of S(t), I(t) and A(t), which are the groups of most concern in practical life, and observe trends in the number of people in different populations. In each case, the values of the varying parameter are given in each figure.
Figure 6 illustrates the sensitivity of transmission rate, reflecting the impact of different parameter β on the three groups. The rate of change in susceptible individuals is slowing as parameter β decreases, but the final size of susceptible individuals still closes to zero, which means that all people in school are infected. For infected people, both symptomatic and asymptomatic, the peak of outbreak of diseases decreases with the decreasing transmission rate. But the time to reach the peak is delayed, at the same time, the whole period of the epidemic will last longer.
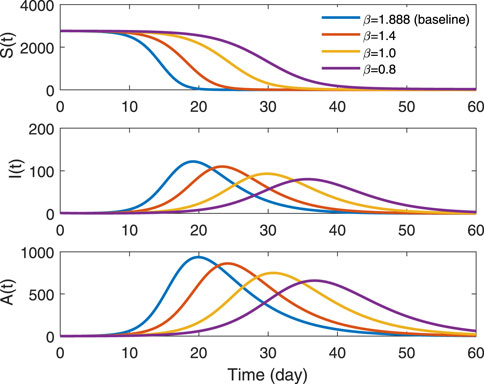
FIGURE 6. Trends in different transmission rates in groups S(t), I(t) and A(t). The solid blue line represents β = 1.888, which is the estimated value in data type B-7. The red line indicates β = 1.4, the yellow denotes β = 1.0, the purple denotes β = 0.8.
Figure 7 reveals the sensitivity of the proportion of symptomatic infections (parameter p) on three groups. We can know that the disease is still prevalent since the final size closes to zero in group S(t). The changes in peak values in groups I(t) and A(t) are completely opposite. The peak of outbreak increases in symptomatically infected people with the increasing proportion. On the contrary, the peak decreases in asymptomatically infected people.
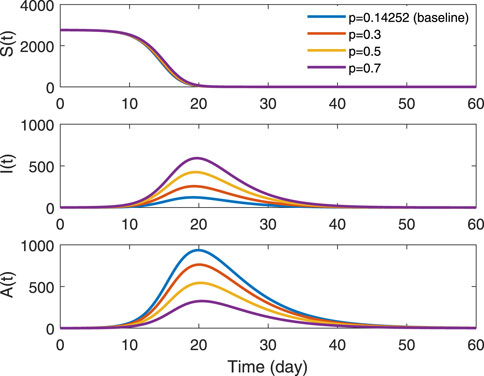
FIGURE 7. Trends in various proportions of symptomatic infections in groups S(t), I(t) and A(t). The solid blue line represents p = 0.14252, which is the estimated value in data type B-7. The red indicates p = 0.3, the yellow is p = 0.5 and the purple denotes p = 0.7.
Figure 8 shows the effect of isolation rate of symptomatic infections, parameter b, on three groups. The denominator of parameter b represents the time from symptom onset of infected people to isolation. The shorter the time, the lower the peak of outbreak in symptomatically infected people and the whole period of the epidemic will last shorter. Changes of parameter had little effect on the group A(t), but the peak of the disease is delayed as the denominator decreases. It indicates that the earlier isolation measures are taken, the more effective they are in controlling outbreaks of symptomatically infected people. But the disease is still prevalent.
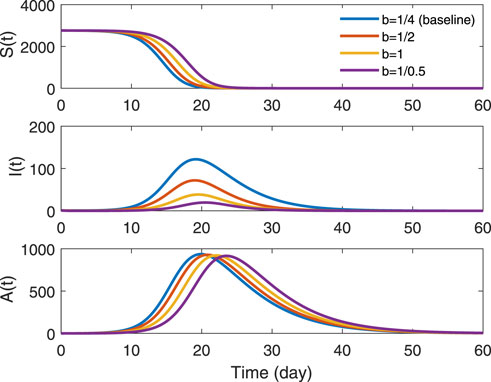
FIGURE 8. Trends in different isolation rates of symptomatic infections in groups S(t), I(t) and A(t). The solid blue line represents b = 1/4, which is the real value in data type B-7. The red indicates b = 1/2, the yellow is b = 1/1 and the purple denotes b = 1/0.5.
Although the peak value and duration of the outbreak of group I(t) in Figures 7, 8 are reduced, the entire outbreak is still prevalence and group S(t) is still fully infected. From the figures, we can clearly see that it is due to the existence of asymptomatic infections A(t), and its change does not reduce with the decrease of symptomatic infections I(t). On the contrary, its peak value either increases or the time to reach the peak value is delayed. A prominent feature of adenovirus transmission is the inclusion of asymptomatic infected persons, which is one of the breakthroughs of prevention and control, but also the difficulty of them.
As shown in the simulation results above, the susceptible population eventually converges to zero for all cases, and the underlying reason for this phenomenon is because the control reproduction number of the model satisfies Rc > 1 for each of the mentioned values of the parameters. Therefore, a condition satisfying Rc < 1 needs to be found in order to eradicate this epidemic.
3.2.2 Sensitivity analysis about the control reproduction number
Since both symptomatic and asymptomatic infected individuals contribute to the spread of the outbreak, we will not distinguish them explicitly anymore. This section will consider the impact of all infected individuals per unit time on the outbreak, which can be portrayed by the control reproduction number. Although the model 2 has six parameters, in real life, we currently have control over only three parameters, so we will only conduct sensitivity analysis on them below.
From Figure 9, it is easy to find that, as long as the transmission rate β is low, no matter what the values of parameters p and b are, the control reproduction number will be less than 1. At this time, the epidemic will not break out, and population of S(t) will eventually tend to a non-zero constant. The value of the parameter β plays an important role on control reproduction number. However, keeping the parameter β small is hard to do. If transmission rate is uncontrollably small, both the parameter b and the parameter p need to be large. This phenomenon is also illustrated in Figure 10. In addition, the change in b and p is inversely proportional. Since the expressions of the three groups about the reproduction number are consistent, and only the parameter values have slight differences, the parameter sensitivity changes of each type are also consistent. Therefore, Figure 10 only shows the trend of parameter changes for type B-7.

FIGURE 9. Sensitivity analysis of three parameters on the control reproduction number Rc, these three parameters are β, p and b. The different color indicates the different value of the parameter β. The entire surface represents the control reproduction number satisfies Rc = 1. Above the surface represents Rc > 1, and conversely, below the surface is Rc < 1. (A–C) are sensitivity analyses of types B-7, B-14, and B-55, respectively.

FIGURE 10. Sensitivity analysis of two parameter of β, b and p. The different colored dashed line shows the different values of the control reproduction number and parameters are numerical values of type B-7. (A) is sensitivity analysis of p and b, (B) is sensitivity analysis of β and b, and (C) is sensitivity analysis of β and p.
The biological significance of the changes in parameters β and b is obvious, and similarly, p has a very intuitive interpretation. It also makes sense in a biological sense that a higher parameter p means more people have symptoms, at the same time, the number of people who have symptoms can be effectively controlled by isolation. However, the number of asymptomatic infections decreases, which reduces the number of infections in the population. Under the values of the above three real parameters, it can be seen from the numerical analysis that the value of the controllable parameters β, b and p needs to reach a very extreme situation to control the epidemic in the three schools, i.e. Rc < 1. Therefore, the next section presents the use of non-pharmaceutical interventions to mitigate the severity of the outbreak and thus effectively control transmission.
3.3 Control model with the non-pharmaceutical intervention
Through the above analysis, we know that the key reason why the epidemic is still serious is that asymptomatic infected people are not under control even though schools have implemented isolation measures for symptomatic infections. In the absence of vaccination, non-pharmaceutical interventions are a very effective way to mitigate the severity of an epidemic, aiming to effectively reduce the spread of the virus by reducing the peak or duration of outbreaks. Since the diagnostic methods for HAdV include antigen detection, polymerase chain reaction, virus isolation and serology, individuals infected with adenovirus can be detected within a limited time. Therefore, we recommend implementing quarantine of exposed individuals in order to effectively reduce the influence of infected people without symptom. In this section, we will provide a control model to characterize the impact of non-pharmaceutical interventions to quarantine suspected cases on the outbreak. The specific equations and flow chart can be seen in Eq. 9 and Figure 11, respectively.
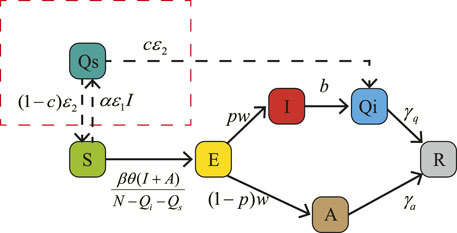
FIGURE 11. A flow diagram of human adenovirus transmission in school with non-pharmaceutical interventions. The red dotted box indicates the quarantine of suspected cases.
In Figure 11, we add the quarantine content in the red dotted box and αɛ1I(t) indicates suspected cases, where α represents the most intimate mates around each isolating patient in unit time. Parameter ɛ1 is quarantined rete, whose denominator represents the time from symptom onset of one symptomatically infected people to its intimate mates isolated. It should be less than the value of parameter b, we set ɛ = 1/5 here. Parameter c (0 ≤ c ≤ 1) is the proportion of susceptible persons confirmed to be infected in quarantine population, combining symptomatically and asymptomatically infected person. Without any experimental data, we assume c = 0.3 in this section. Parameter ɛ2 is removal rate from group Qs, whose denominator represents the time of laboratory diagnosis which is about one to 2 hours. Here, we assume ɛ2 = 1/0.5. It should be noted that the group Qi, in this control model, includes both symptomatic and asymptomatic infected people. In addition, In a closed environment, as the number of people isolated increases, the ability of the disease to spread decreases. Therefore, we will add a parameter θ (0 ≤ θ ≤ 1) to characterize this phenomenon as a decreasing factor in the rate of disease transmission to reflect the reduction in disease incidence due to population density reduction caused by quarantine. For an intuitive comparison with the original model 2, we set the value is θ = 1 here.
3.3.1 Numerical simulations
In this section, we will explore the effect of initiating quarantine measures at different times. Here, adenovirus type B-55 is selected as the research object, and the specific parameter values are shown in Table 3 and Table 4. The group of symptomatically infected cases is the main focus of attention. Our expectation is to expect a smaller peak value and to end it as soon as possible. Figure 12 illustrates the impact of starting a non-pharmaceutical intervention at different time points. It is easy to see that the earlier quarantine measures are implemented at school, the lower the peak and shorter the duration of the outbreak, and the sooner the outbreak ends. In addition, even if schools implement quarantine measures after peak time, although there is no action against the peak value, it can still greatly shorten the duration of the outbreak. Measures to quarantine suspected cases in the absence of vaccine greatly reduce the risk of transmission from an infected person exposed to the environment.
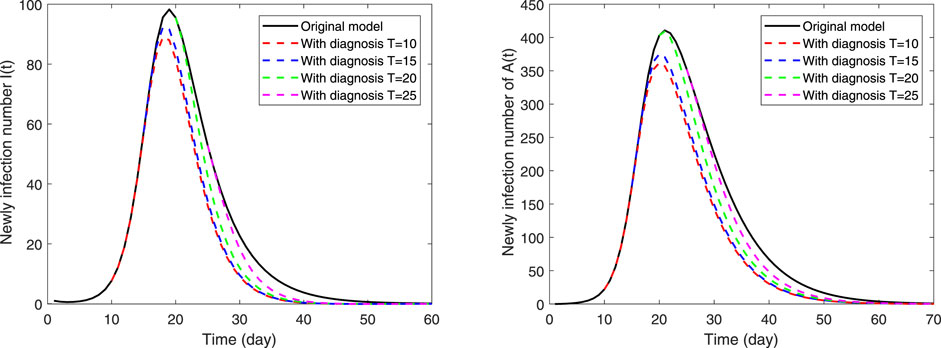
FIGURE 12. The impact of different intervention times on the epidemic. The black solid black line is the baseline, the left picture is the number of new symptomatic infections I(t), and the right is the number of new asymptomatic infections A(t). The red dashed line indicates the implementation of the intervention to quarantined suspected cases on the 10th day of the outbreak and the blue dashed line is on the 15th day. But the green and magenta dashed line indicate the implementation on the 20th day and 25th day, respectively, which both exceed the peak time for newly infection cases.
In addition, other non-pharmaceutical interventions should be implemented, such as drinking more water, eating fresh food and strengthening physical exercise to improve immunity of people. People also should keep the indoor environment clean, wear a mask when going out, and avoid contact with patients to prevent infection. Everyone should be careful to avoid contact with potential sources of infection and try to avoid contact with people with colds during an adenovirus epidemic. All of the above measures are applied in the control model as reflected in parameter θ, whose sensitivity is the same as that of parameter β. However, in real life, it is difficult to implement the measures about quarantine of suspected cases. So it is necessary to strengthen the ideological publicity on infectious diseases in school, and pay attention to and adjust psychological problems of suspected people. Furthermore, the school should strictly implement isolation prevention and control measures for patients to avoid cross-infection.
4 Conclusion
We study the transmission law of ARI caused by HAdV occurring in Chinese schools from a mathematical perspective, and verified the correctness and practicability of our model by fitting the data of B-7, B-14 and B-55 types. Through mathematical calculations, we obtain the specifical expression of the control reproduction number, from which we can explain that the ARI is still prevalent because the control reproduction number satisfies Rc > 1, thus, ARI is not eradicated. In addition, some series of sensitivity analyses are done on the parameters of the model in order to find the main factors influencing the spread of the epidemic. During the research process, we find that asymptomatic infection is the main factor leading to the outbreak of the disease when relevant measures are implemented in schools. Vaccines are an effective means of reducing the prevention of outbreaks, and the resumption of adenovirus vaccination in the United States military in March 2011 has reduced the incidence. But, for now, only the U.S. military has the vaccine. In the absence of a vaccine, we propose non-pharmaceutical interventions to control the impact of asymptomatic infection on the epidemic, which can be effective in mitigate the severity of the outbreak.
Consequently, in order to effectively control the outbreak, we propose the control model to quarantine the exposed individuals, and the results indicate that the invention is effective in mitigating the spread of the outbreak. Thus, in the absence of a specific vaccine, we strongly recommend implementing quarantine measures, although this can be very stressful on campus. The reasons are as follows. First, the epidemic will affect the normal education and life of students. The implementation of quarantine allows other students to continue their normal lives while the suspected case is quarantined, and in addition, patients can return to their normal lives and studies as soon as they recovery. Second, it can reduce the uncertainty of the invisible transmission route. Last, though the fatality rate of disease is very low, the number of deaths caused by HAdV is increasing year by year. Thus, the implement of measures can be taken to detect and treat the severe patients in time to reduce mortality.
In further planning, Large amounts of data from different types of HAdV are needed to discover the difference between types B-7, B-14 and B-55. Therefore, dynamic models can be useful tools for predicting disease. In our analysis, we assume the infectivity of those infected by symptomatic and asymptomatic infection is consistent, that is η = 1. However, there can be significant heterogeneity in the infection rates of different infected individuals [40]. For a more accurate analysis, it should be set 0 < η < 1. However, this special value needs to be acquired by fitting a large amount of real data, and different values may be obtained for different types of HAdV, which is a direction we need to research in the future.
Data availability statement
The original contributions presented in the study are included in the article/supplementary material, further inquiries can be directed to the corresponding author.
Author contributions
All authors have made great contributions to the writing of study and approved the submitted version. WZ, XL, XM and YZ established dynamical modeling. WZ and XL participated in the program design and provided valuable comments on the manuscript writing. WZ, XL and XM collected and processed the relevant published data. XL, XM and YZ guided and improved the manuscript.
Funding
This work is supported by National Natural Science Foundation of China (grants 12022113, 12126416 and 12101573), Henry Fok foundation for young teachers (grant 171002), Outstanding Young Talents Support Plan of Shanxi province, Fundamental Research Program of Shanxi Province (grant 20210302124381) and Graduate Innovation Project of Shanxi Province (2022Y587).
Conflict of interest
The authors declare that the research was conducted in the absence of any commercial or financial relationships that could be construed as a potential conflict of interest.
Publisher’s note
All claims expressed in this article are solely those of the authors and do not necessarily represent those of their affiliated organizations, or those of the publisher, the editors and the reviewers. Any product that may be evaluated in this article, or claim that may be made by its manufacturer, is not guaranteed or endorsed by the publisher.
References
1. Doan Q, Enarson P, Kissoon N, Klassen TP, Johnson DW. Rapid viral diagnosis for acute febrile respiratory illness in children in the emergency department. Cochrane Database Syst Rev John Wiley & Sons, Ltd (2014). doi:10.1002/14651858.CD006452.pub2
2. Dongliu Y, Guoliang Y, Haocheng X, Shuaijia Q, Li B, Yanglei J. Outbreak of acute febrile respiratory illness caused by human adenovirus b p14h11f14 in a military training camp in shandong China. Arch Virol (2016) 161:2481–9. doi:10.1007/s00705-016-2949-x
3. Kogan R, Maggi L, Mendoza C, Mendoza N C. Seguimiento clínico y factores de riesgo en niños con enfermedades respiratorias por adenovirus. Rev Chil Pediatr (2007) 78:261–7. doi:10.4067/S0370-41062007000300004
4. Heo JY, Noh JY, Jeong HW, Choe KW, Song JY, Kim WJ, et al. Molecular epidemiology of human adenovirus–associated febrile respiratory illness in soldiers, South Korea1. Emerg Infect Dis (2018) 24:1221–7. doi:10.3201/eid2407.171222
5. Chen W, Wang S, Zhang W, Qian Q, Wen L, Xu YY, et al. Epidemiological characteristics of human adenovirus associated respiratory diseases in China. Mil Med Sci (2017) 041:814–21.
6. Yoo H, Gu SH, Jung J, Song DH, Yoon C, Hong DJ, et al. Febrile respiratory illness associated with human adenovirus type 55 in South Korea military, 2014–20161. Emerg Infect Dis (2017) 23:1016–20. doi:10.3201/eid2306.161848
7. Kuorinka I, Jonsson B, Kilbom A, Vinterberg H, Biering-Sørensen F, Andersson G, et al. Standardised nordic questionnaires for the analysis of musculoskeletal symptoms. Appl Ergon (1987) 18:233–7. doi:10.1016/0003-6870(87)90010-X
8. Song J, Lee H, Cho E. Epidemiological investigation of the outbreak of acute respiratory infection caused by adenovirus type b55 in a physical education school in 2017. Infect Chemother (2019) 51:119–29. doi:10.3947/ic.2019.51.2.119
9. Yoon H, Jhun BW, Kim H, Yoo H, Park SB. Characteristics of adenovirus pneumonia in Korean military personnel, 2012–2016. J Korean Med Sci (2017) 32:287–95. doi:10.3346/jkms.2017.32.2.287
10. Gu L, Qu J, Sun B, Yu X, Li H, Cao B. Sustained viremia and high viral load in respiratory tract secretions are predictors for death in immunocompetent adults with adenovirus pneumonia. PloS one (2016) 11:e0160777. doi:10.1371/journal.pone.0160777
11. Yoon H, Jhun BW, Kim SJ, Kim K. Clinical characteristics and factors predicting respiratory failure in adenovirus pneumonia. Respirology (2016) 21:1243–50. doi:10.1111/resp.12828
12. Xu L, Liu J, Liu C, Duan Y, Zhu Y, Xu B, et al. Case-control study of the epidemiological and clinical features of human adenovirus 55 and human adenovirus 7 infection in children with acute lower respiratory tract infections in beijing, China, 2008–2013. BMC Infect Dis (2018) 18:634–6. doi:10.1186/s12879-018-3520-z
13. Liu J, Nian QG, Zhang Y, Xu LJ, Hu Y, Li J, et al. In vitro characterization of human adenovirus type 55 in comparison with its parental adenoviruses, types 11 and 14. PloS one (2014) 9:e100665. doi:10.1371/journal.pone.0100665
14. Ma X, Sun GQ, Wang ZH, Chu YM, Jin Z, Li BL. Transmission dynamics of brucellosis in jilin province, China: Effects of different control measures. Commun Nonlinear Sci Numer Simulation (2022) 114:106702. doi:10.1016/j.cnsns.2022.106702
15. Chowell G, Ammon C, Hengartner N, Hyman J. Transmission dynamics of the great influenza pandemic of 1918 in geneva, Switzerland: Assessing the effects of hypothetical interventions. J Theor Biol (2006) 241:193–204. doi:10.1016/j.jtbi.2005.11.026
16. Arino J, Brauer F, Van Den Driessche P, Watmough J, Wu J. A model for influenza with vaccination and antiviral treatment. J Theor Biol (2008) 253:118–30. doi:10.1016/j.jtbi.2008.02.026
17. Sun GQ, Zhang HT, Chang LL, Jin Z, Wang H, Ruan S. On the dynamics of a diffusive foot-and-mouth disease model with nonlocal infections. SIAM J Appl Math (2022) 82:1587–610. doi:10.1137/21M1412992
18. Madubueze CE, Kimbir AR, Aboiyar T. Global stability of ebola virus disease model with contact tracing and quarantine. Appl Appl Math: Int J (AAM), 13 (2018). p. 25.
19. Riley S, Fraser C, Donnelly CA, Ghani AC, Abu-Raddad LJ, Hedley AJ, et al. Transmission dynamics of the etiological agent of sars in Hong Kong: Impact of public health interventions. Science (2003) 300:1961–6. doi:10.1126/science.1086478
20. Ma X, Luo XF, Li L, Li Y, Sun GQ. The influence of mask use on the spread of Covid-19 during pandemic in New York city. Results Phys (2022) 34:105224. doi:10.1016/j.rinp.2022.105224
21. Brown RA. A simple model for control of Covid-19 infections on an urban campus. Proc Natl Acad Sci U S A (2021) 118:e2105292118. doi:10.1073/pnas.2105292118
22. Baleanu D, Abadi MH, Jajarmi A, Vahid KZ, Nieto J. A new comparative study on the general fractional model of Covid-19 with isolation and quarantine effects. Alexandria Eng J (2022) 61:4779–91. doi:10.1016/j.aej.2021.10.030
23. Barlow M, Marshall N, Tyson R. Optimal shutdown strategies for Covid-19 with economic and mortality costs: British columbia as a case study. R Soc Open Sci (2021) 8:202255. doi:10.1098/rsos.202255
24. Asamoah JKK, Okyere E, Abidemi A, Moore SE, Sun GQ, Jin Z, et al. Optimal control and comprehensive cost-effectiveness analysis for Covid-19. Results Phys (2022) 33:105177. doi:10.1016/j.rinp.2022.105177
25. Sharma P, Martis PC, Excoffon KJ. Adenovirus transduction: More complicated than receptor expression. Virology (2017) 502:144–51. doi:10.1016/j.virol.2016.12.020
26. Chen RF, Lee CY. Adenoviruses types, cell receptors and local innate cytokines in adenovirus infection. Int Rev Immunol (2014) 33:45–53. doi:10.3109/08830185.2013.823420
27. Ginsberg H, Prince G. The molecular basis of adenovirus pathogenesis. Infect Agents Dis (1994) 3:1
28. Jones MS, Harrach B, Ganac RD, Gozum MM, dela Cruz WP, Riedel B, et al. New adenovirus species found in a patient presenting with gastroenteritis. J Virol (2007) 81:5978–84. doi:10.1128/JVI.02650-06
29. Hage E, Liebert UG, Bergs S, Ganzenmueller T, Heim A. Human mastadenovirus type 70: A novel, multiple recombinant species d mastadenovirus isolated from diarrhoeal faeces of a haematopoietic stem cell transplantation recipient. J Gen Virol (2015) 96:2734–42. doi:10.1099/vir.0.000196
30. Guo Z, Xu S, Tong L, Dai B, Liu Y, Xiao D. An artificially simulated outbreak of a respiratory infectious disease. BMC Public Health (2020) 20:135. doi:10.1186/s12889-020-8243-6
31. Arino J, Brauer F, van den Driessche P, Watmough J, Wu J. Simple models for containment of a pandemic. J R Soc Interf (2006) 3:453–7. doi:10.1098/rsif.2006.0112
32. Wang Y, Wei Z, Cao J. Epidemic dynamics of influenza-like diseases spreading in complex networks. Nonlinear Dyn (2020) 101:1801–20. doi:10.1007/s11071-020-05867-1
33. Jin X, Jin S, Gao D. Mathematical analysis of the ross-MacDonald model with quarantine. Bull Math Biol (2020) 82:47–26. doi:10.1007/s11538-020-00723-0
34. Zhang Q, Wang D. Antiviral prophylaxis and isolation for the control of pandemic influenza. Int J Environ Res Public Health (2014) 11:7690–712. doi:10.3390/ijerph110807690
35. Ngonghala CN, Iboi E, Eikenberry S, Scotch M, MacIntyre CR, Bonds MH, et al. Mathematical assessment of the impact of non-pharmaceutical interventions on curtailing the 2019 novel coronavirus. Math biosciences (2020) 325:108364. doi:10.1016/j.mbs.2020.108364
36. Diekmann O, Heesterbeek JAP. Mathematical epidemiology of infectious diseases: Model building, analysis and interpretation. New York: John Wiley & Sons (2000).
37. Van den Driessche P, Watmough J. Reproduction numbers and sub-threshold endemic equilibria for compartmental models of disease transmission. Math biosciences (2002) 180:29–48. doi:10.1016/S0025-5564(02)00108-6
38. La Salle JP. The stability of dynamical systems (J. P. Lasalle). SIAM Rev Soc Ind Appl Math (1979) 21:418–20. doi:10.1137/1021079
39. Garba SM, Lubuma JMS, Tsanou B. Modeling the transmission dynamics of the Covid-19 pandemic in South Africa. Math biosciences (2020) 328:108441. doi:10.1016/j.mbs.2020.108441
Keywords: human adenovirus, dynamical model, control reproduction number, sensitivity analysis, non-pharmacological interventions, quarantine measures
Citation: Zhang W, Ma X, Zhang Y and Luo X (2022) Dynamical models of acute respiratory illness caused by human adenovirus on campus. Front. Phys. 10:1090234. doi: 10.3389/fphy.2022.1090234
Received: 05 November 2022; Accepted: 05 December 2022;
Published: 15 December 2022.
Edited by:
Ling Xue, Harbin Engineering University, ChinaReviewed by:
Yi Wang, China University of Geosciences Wuhan, ChinaSanling Yuan, University of Shanghai for Science and Technology, China
Copyright © 2022 Zhang, Ma, Zhang and Luo. This is an open-access article distributed under the terms of the Creative Commons Attribution License (CC BY). The use, distribution or reproduction in other forums is permitted, provided the original author(s) and the copyright owner(s) are credited and that the original publication in this journal is cited, in accordance with accepted academic practice. No use, distribution or reproduction is permitted which does not comply with these terms.
*Correspondence: Xiaofeng Luo, bHVveGlhb2ZlbmdAbnVjLmVkdS5jbg==
 Wei Zhang1,2
 Xiaofeng Luo