- 1College of Mathematical Sciences, Harbin Engineering University, Harbin, Heilongjiang, China
- 2China Animal Health and Epidemiology Center, Qingdao, Shandong, China
Contact tracing is an important tool to contain the spread of many airborne diseases. We develop an approximated pairwise model to investigate the impact of non-Markovian awareness process among infectious individuals represented by pairwise endemic models. We derive the basic reproduction number and the final epidemic size, which are dependent on the tracing rate and the distribution of awareness process. The model analysis provides the threshold of contact tracing rate. When the contact tracing rate is greater than the threshold, the basic reproduction number will be less than one, then the epidemic will eventually die out. The analysis further shows that, higher variance in the awareness process generates smaller basic reproduction number, lower tracing threshold, and larger final epidemic size, when the mean awareness period is fixed. Extensive numerical analysis show the comprehensive effects of tracing rates and non-Markovian awareness processes on human behavior and the transmissibility ability of epidemic. It turns out that large tracing rates and high variances in awareness process lead to obvious reductions in contacts between susceptible and infectious individuals, so as to curb the transmission of infectious diseases. Moreover, contact tracing is more effective in reducing the number of infected individuals and the contacts between susceptible and infected individuals when the awareness process has a larger variance.
1 Introduction
Mutual contacts among individuals exist in the real world. It is necessary to incorporate the interaction among infectious and susceptible individuals when studying the epidemic spread. Many approaches (based on nodes, pairwise, edges and so on) have been established and used to investigate the interaction of individuals in the network [1–5]. Contact tracing is a useful strategy in epidemic surveillance [6, 7]. The close contacts of an infected individual can be identified by contact tracing and have the chance to be infected. Screening and isolating these individuals is an effective way of identifying potentially infected individuals. By tracing the contacts of infected individuals, the identified infected individuals can be isolated and treated, and the transmission chains of epidemic can be detected and stopped so as to mitigate the spread of the epidemic.
Many mathematical models are developed to investigate the effect of contact tracing in controlling the spread of infectious diseases from the individual-based models (IBMs) to the ordinary differential equations (ODEs) at the population level. Kretzschmar et al. (1996) used IBMs to study the spread of two sexually transmitted diseases through simulations and found that contact tracing for targeting the highly sexually active core group is very effective in reducing the prevalence [8]. Kasaie et al. (2014) investigated the impact of household contact tracing for tuberculosis in a moderate-burden setting [9]. Peak et al. (2017) used IBMs to compare the effectiveness of contact tracing for Ebola, influenza, and SARS in simulations [10]. To obtain more analytic results on contact tracing, mean-field and pairwise approximation models are developed [11–13]. Eames (2007) utilized pairwise models on networks to compare the effects of recursive tracing and one-step tracing [14]. Heijne et al. (2010) applied pair approximation models to predict the impact of contact tracing on chlamydia prevalence [15]. Barlow (2020) studied the effect of contact tracing from the view of branching processes and phenomenological approaches [16].
In addition, the awareness of infection among infected individuals plays a key role in the spread of slowly progressive diseases. Many researchers focused on studying the roles of the public awareness among susceptible individuals in the spreading of diseases, and showed that raising awareness of protection among susceptible individuals can effectively contain epidemic spread [17–21]. However, to examine the effects of the infection awareness among infected individuals on the epidemic theoretically is still a great challenge. Some previous studies indicated that asymptomatic or mild infections are likely to cause outbreaks and rapid transmission in communities [22–24]. Even rapid contact tracing and antigen testing are effective in control the spread of infectious diseases and can be widely used, large numbers of infected individuals are unaware of their infection so that the epidemic spread is uncertain [25–27]. Considering the complexity of awareness process, we define the awareness process of infectious status, which starts from being infected to the time when realizing being infected, as a non-Markovian process in this study. The reason is that recent empirical observations show that non-Markovian transmission process, which refers to the spreading processes with non-exponential distributions, is more realistic [28–30]. Kiss et al. (2015) presented pairwise network models with non-Markovian recovery period to provide links between non-Markovian dynamics and pairwise delay differential systems [31]. Sherborne et al. analyzed the characteristics of an edge-based model with arbitrary transmission and recovery process [32]. Li et al. (2018) considered the fixed infectious period in an SIR pairwise model [33]. The existence of non-exponential distribution shows richer dynamics of epidemic spread [34–38], where the epidemic curves are different when the infectious periods have different distributions even with the same mean [39, 40].
In this work, we incorporate the non-Markovian process into pairwise models to consider the impacts of contact tracing and the awareness of infection status on the epidemic spread. Our work has following contributions. First, we derive the basic reproduction number and the contact tracing threshold for the non-Markovian pairwise model, and prove that the basic reproduction number will be less than one when the contact tracing rate is larger than the threshold. Second, we investigate the impacts of contact tracing and the awareness of infectious status on epidemic spreading. The work is organized as follows. We develop pairwise models incorporating contact tracing and non-Markovian awareness process for epidemic networks in Section 2. In Section 3, we analyze the positive invariance of the model, derive the basic reproduction number, and obtain the final epidemic size relation by rigorous analysis. Section 4 provides the theoretical results on the threshold of effective tracing rate and the effects of non-Markovian awareness processes. Numerical simulations are given in Section 5. Discussion is presented in Section 6.
2 Model description
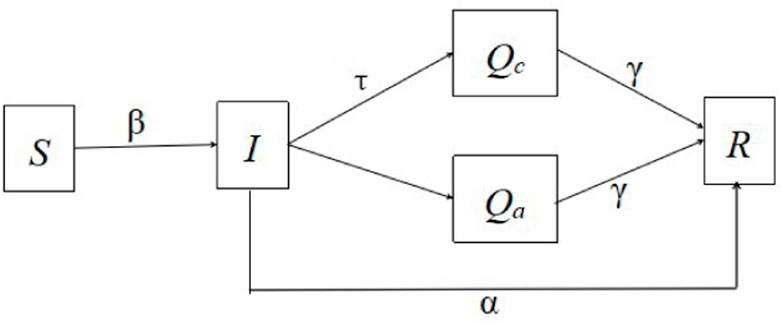
We develop a pairwise network model with continuous non-Markovian awareness process to investigate the impacts of contact tracing on epidemics. Five classes are included in this model, namely, susceptible individuals (S), infected individuals (I), traced infected individuals (Qc), infected individuals who are aware of their own infectious status and treated (Qa), and recovered individuals (R). The susceptible individuals become infectious when they are infected. The infected individuals can be divided into three groups, that is, those who will be traced at the rate, τ, those who recover naturally at the rate, α, and those who are aware of infection and go to the hospital initiatively in a non-Markovian process. We consider the transition process from the state I to the state Qa as the awareness process of infection among infected individuals, which can be described by a random variable, X. The probability density function of X is f(s). The corresponding cumulative function is F(s) and the survival function is ξ(s) = 1 − F(s). ϕ(s) represents the density of nodes from state I to state Qa with respect to the age of s at the initial time. Furthermore, all individuals in classes Qc and Qa will be quarantined and treated. The infected individuals who are successfully treated will enter the recovered class at the rate, γ. The total number of individuals is N, i.e., [S] + [I] + [Qc] + [Qa] + [R] = N, where [A] is the number of individuals in state A. We use the notation [AB] to represent the expected number of links that connect a node in state A and a node in state B. Let m be the average degree in this network model.
The schematic diagram is depicted in Figure 1. Let i(t, a) be the density of the infected nodes with infection age a at time t, then the total number of infected nodes at time t is
in which h(a) = −ξ′(a)/ξ(a) = f(a)/ξ(a), i(t, 0) = β[SI](t), and i(0, a) = ϕ(a). Here, we assume that lima→∞ϕ(a) = 0 according to the biological feasibility. From Eq. 1 and the boundary conditions of i(t, a), we deduce the representation of i(t, a) according to the work in [37] as follows.
Then, using the properties of h(a), we obtain that
Similarly, the expected number of links between S and I at time t is
where Si(t, 0) = β[SSI](t) and
Solving the Eq. 4, we obtain the representation of Si(t, a) according to the work in [37].
Applying the Eqs 5, 6, we have
Therefore, the resulting pairwise model can be constructed with integro-differential terms in Model (8) as follows
In Model (8), the spread of the disease relates to the number of contacts between susceptible and infected individuals. Therefore, we use Model (9), a simplified form of Model (8), to study the dynamics of the spreading process.
3 Mathematical analysis
In this section, we determine the feasible solution region, calculate the basic reproduction number, and derive the final epidemic size of Model (9).
3.1 Feasible solution region
We study the feasible solution region of Model (9), and the following proposition holds.
3.2 The basic reproduction number
In order to determine the expected number of infections generated by a new infection in a fully susceptible population [43], we derive the basic reproduction number. Note that Model (9) has a disease-free equilibrium
We calculate the basic reproduction number, R0, of Model (9) according to the method in [44]. Here, R0 is the expected lifetime of an S-I link multiplied by the number of newly generated S-I links per unit time [31]. In Model (9), an S-I link is removed in four ways: (I) the identification of I nodes by contact tracing, (II) the recovery of I nodes, (III) the infection of S nodes by I nodes, and (IV) the awareness of I nodes for seeking treatments initiatively. Let the random variable, Z, be the lifetime of an infected S-I link. Assume that the infection process of S node in the S-I link has density function fI(t) and survival probability ξI(t), the tracing process on I node has density function fT(t) and survival probability ξT(t), and the self-recovery process of I node has density function fR(t) and survival probability ξR(t). Note that f(t) and ξ(t) are the density function and the survival probability of the awareness process from state I to state Qa, respectively. Then, the expected lifetime of an S-I link can be described as follows.
We assume that the infection process and the tracing process follow Markovian processes, and the awareness process follows a non-Markovian process throughout this work. Hence, we have
where
3.3 The final epidemic size
In this subsection, we derive the expression of final epidemic size that can be used to calculate the total number of infections during an epidemic. We denote [S]∞ = limt→∞[S](t) and s∞ = [S]∞/S0. Solving the fourth equation of Model (9), we have
where
Hence,
Substituting the above expression of [SI] into the first equation of Model (9) and integrating it, we have
where
Let t → ∞ in Eq. 16, we get
For the formation of final size, we need to solve the integration,
and
Moreover,
Because the number of initial infected individuals is small relative to the numbers of initial susceptible individuals and total population, we can assume that ϕ(a)/N ≈ 0 and [SI](0)/S0 ≈ 0. Denote s∞ = [S]∞/S0. Substituting the integrations (19), (20), (21) and (22) into Eq. 18, we obtain that
It is easy to prove that the equation
4 Case study
In this section, we apply the pairwise network model to determine the threshold of contact tracing rate and the effects of non-Markovian awareness process on epidemics theoretically.
4.1 Threshold of effective contact tracing rate
To investigate the minimum value of the effective contact tracing rate, we rewrite the basic reproductive number, R0, as the function of τ, i.e.
where
4.2 Impacts of the variance of awareness process on the epidemic
The awareness process of infection among infectious individuals can be affected by many random factors, such as the propaganda for preventing the epidemic, the awareness level on the risks of disease and the immunity of an individual.
Here, we provide some conditions which insure that higher variance in the awareness process induces smaller basic reproduction number, larger final epidemic size, and smaller threshold of contact tracing rate. Let the random variable X be the transition time of awareness process with probability density function f(t) and cumulative distribution function F(t). Denote
5 Numerical simulations
To illustrate the accuracy of the analytical results, we compare the effects of different contact tracing rates and non-Markovian awareness processes by numerical simulations. The numerical simulations are performed with N = 1000, β = 0.1, α = 1/20, γ = 1/3, and m = 10. The initial conditions are [S](0) = 999, [I](0) = 1, [Qc](0) = [Qa](0) = [R](0) = 0,
First, we focus on the effects of different contact tracing rates and awareness processes on the epidemic spreading.
Figure 2 shows the impacts of parameters on the basic reproduction number, R0. The contours of R0 as the function of the contact tracing rate and distribution parameters of awareness process are provided in Figure 2A, Figure 2B and Figure 2C. These simulations indicate that the basic reproduction number decreases as the contact tracing rate, τ, increases and the mean of awareness process decreases. Besides, the reduction in R0 that achieved by increasing τ is smaller when τ is larger. This means that it is relatively difficult to reduce the basic reproduction number by increasing the contact tracing rate when the contact tracing rate is larger. In Figure 2D, the basic reproduction numbers are compared when awareness processes have the same mean but different variances. We can observe that when the mean of awareness process is fixed, higher variance in the awareness process leads to smaller basic reproduction number and larger threshold of contact tracing rate. The simulation results in Figure 2 are consistent with the results of our theoretical analysis.
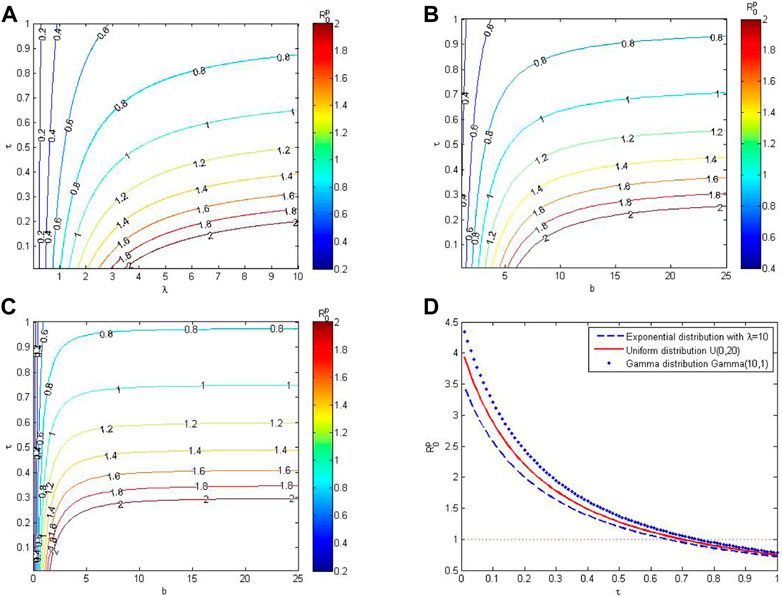
FIGURE 2. Effects of different contact tracing rates and awareness distributions on the basic reproduction number, R0. (A–C) Contours of R0 as the function of tracing rates and distribution parameters. (D) The trend of R0 as the function of tracing rate when the awareness processes have different distributions but the same mean. In which, the variances of E(10), U(0, 20), and Gamma(10, 1) are 100, 100/3, and 10, respectively.
Figure 3 shows the impacts of parameters on the final epidemic size. In Figure 3A, Figure 3B and Figure 3C, the contours of the final epidemic size are depicted as the function of contact tracing rate and distribution parameters of awareness process. We find that the trends of these contours are similar, that is, the final epidemic size increases when the contact tracing rate increases and the mean awareness period decreases. Besides, the increase in the final epidemic size by increasing τ is greater when τ is larger. This indicates that it is relatively easy to increase the final epidemic size by increasing the contact tracing rate when the contact tracing rate is large. In Figure 3D, the awareness processes have the same mean but different variances. The results indicate that larger variance in awareness process contributes to larger final epidemic size when the tracing rate and the mean of awareness process are fixed.
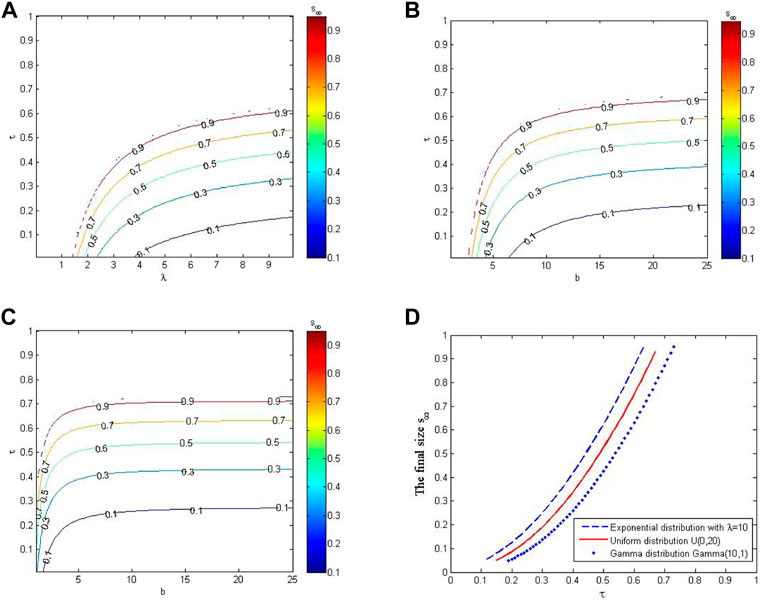
FIGURE 3. Effects of different contact tracing rates and awareness distributions on the final epidemic size, s∞. (A–C) Contours of s∞ as the function of contact tracing rates and distribution parameters. (D) The trend of s∞ as the function of tracing rate when the awareness processes have different distributions but the same mean. Here, the variances of E(10), U(0, 20), and Gamma(10, 1) are 100, 100/3, and 10, respectively.
The proportions of infection in the total population are shown in Figure 4 for different contact tracing rates and different distributions of the awareness process all having the same mean. Two observations can be obtained. First, larger contact tracing rate leads to a smaller and later peak of the proportion of infected individuals. Second, obvious differences exist in proportions of infected individuals despite the mean length of awareness periods is the same. In particular, when the contact tracing rate is fixed, the exponential distribution has the largest variance and leads to the lowest and latest peak in infection proportion.
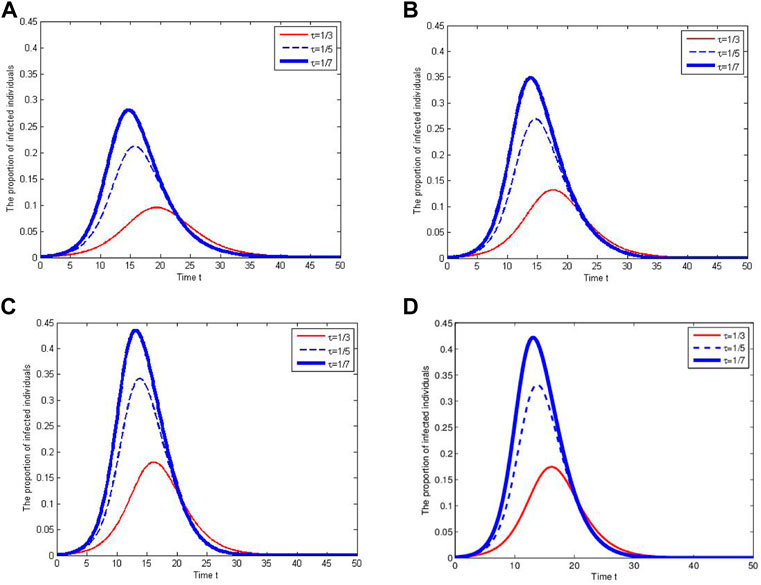
FIGURE 4. Effects of different contact tracing rates and awareness processes on the infection proportion. The awareness process follows the distribution E(10) in (A), U(0, 20) in (B), Gamma(10, 1) in (C) and Gamma(5, 2) in (D), respectively. Here, E(10), U(0, 20), Gamma(10, 1) and Gamma(5, 2) have the same mean but different variances.
Further, we are interested in the dynamics of contact behavior and awareness behavior of humans under different contact tracing rates and awareness processes. Here, we consider two non-Markovian distributions of awareness processes, U(0, 20) and Gamma(10, 1), which have the same mean but different variances. Note that the variance of U(0, 20) is larger than that of Gamma(10, 1).
The number of contacts between susceptible and infected individuals can be reduced by increasing contact tracing rates and the variance of awareness processes. In particular, Figure 5A and Figure 5B show that the number of S-I links has a lower and later peak when the contact tracing rate and the variance of awareness process are larger. The average number of contacts per susceptible individual with infectious individuals has similar characteristics, which is shown in Figure 5C and Figure 5D, respectively. The results indicate that a susceptible individual has less contacts with infectious individuals when the tracing rate is larger or the awareness process has a fixed mean but a larger variance.
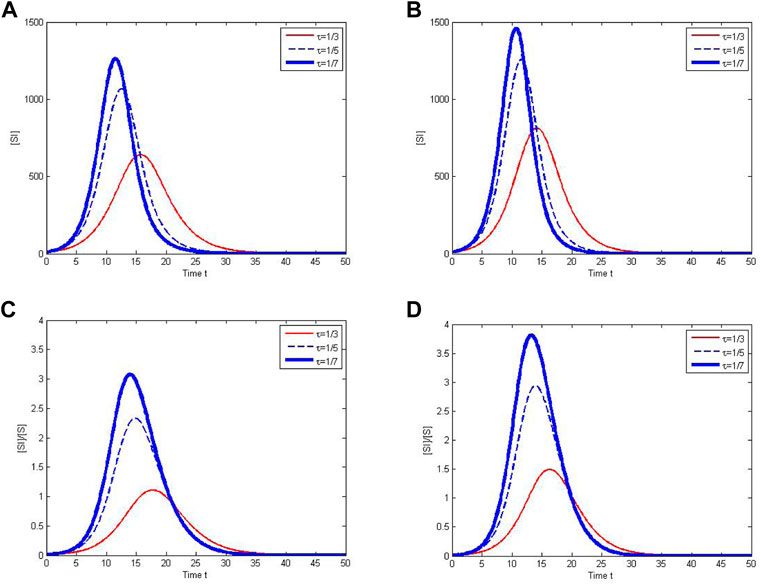
FIGURE 5. The contacts between susceptible and infected individuals under different tracing rates and awareness processes. In (A) and (C), the awareness process follows the uniform distribution U(0, 20). In (B) and (D), the awareness process follows the gamma distribution Gamma(10, 1).
Considering the variation of human awareness, we investigate the impacts of parameters on the proportions of aware individuals and traced individuals in Figure 6. Here, the proportion of aware individuals is the ratio of the cumulative number of aware individuals to the cumulative number of infected individuals, and the proportion of traced individuals is the ratio of the cumulative number of traced individuals to the cumulative number of infected individuals. We find that the proportion of aware individuals is larger when the awareness process has a fixed mean but a larger variance. However, the proportion of aware individuals is lower when the contact tracing is larger, which is possible because more infected individuals are traced in this case.
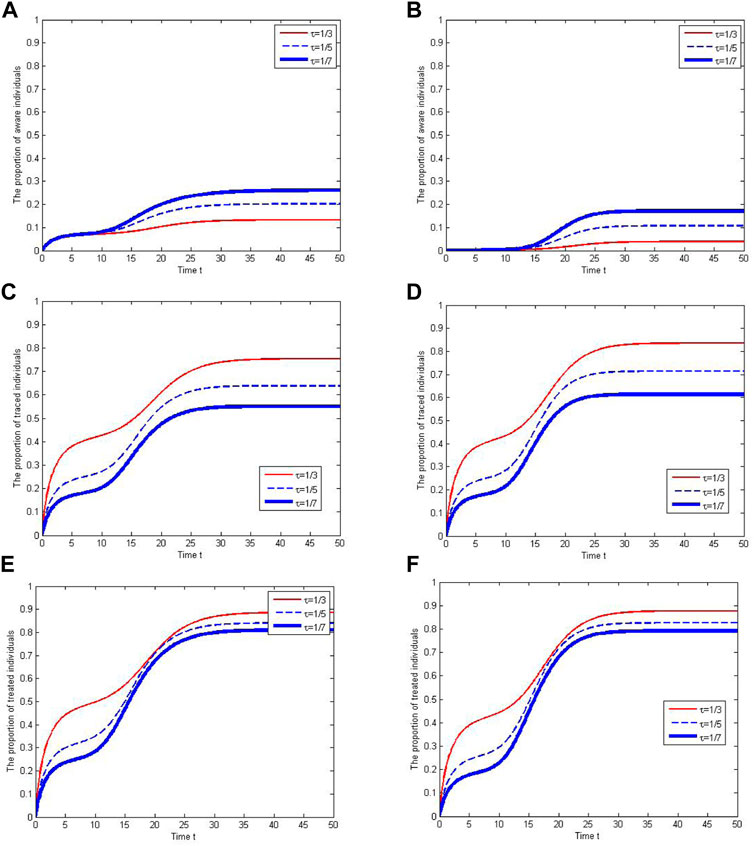
FIGURE 6. The cumulative proportions of aware and traced individuals under different tracing rates and awareness processes. In (A), (C) and (E), the awareness process follows the uniform distribution, U(0, 20). In (B), (D) and (F), the awareness process follows the gamma distribution, Gamma(10, 1). Treated individuals refer to aware individuals and traced individuals.
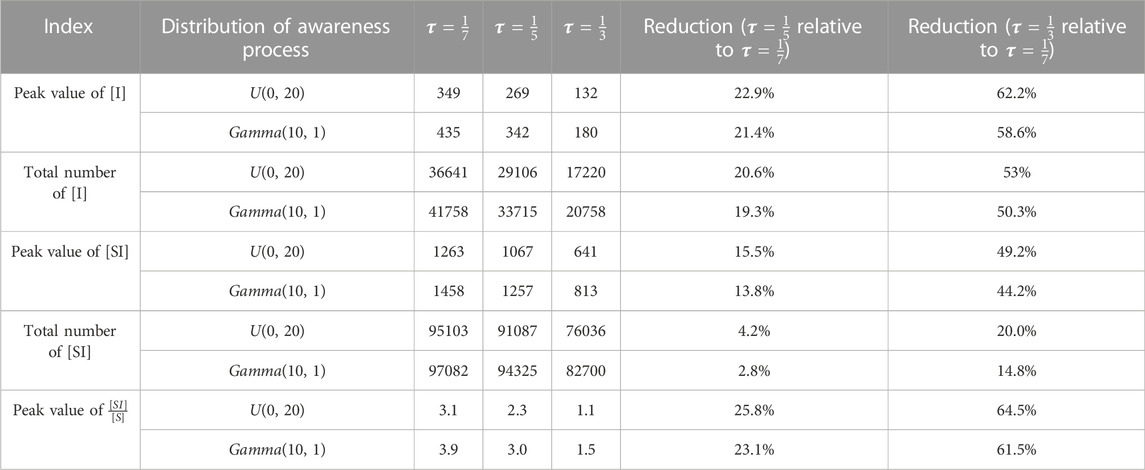
Finally, we investigate the performance of different contact tracing rates and awareness processes in containing epidemic spread in Table 1. Here, five characteristics of the epidemic, namely, the peak value of infected individuals, the total number of the infected individuals, the peak value of [SI], the total number of S-I links, and the peak value of [SI]/[S], are considered. The results indicate that larger reductions can be obtained by using larger contact tracing rates when the awareness process has a larger variance and a fixed mean, which is the combined effects of contact tracing and awareness process on the epidemic. Hence, enhancing contact tracing is more effective in reducing the number of infected individuals and the contacts between susceptible and infected individuals, when the awareness process has larger variance and a fixed mean.
6 Discussion
The objective of this work is to determine the impacts of contact tracing strategy and awareness behavior among infectious individuals on the epidemic. Due to the complexity of human behavior, the non-Markovian awareness process is incorporated into the pairwise model in this work.
Through analyzing the SIR pairwise network model theoretically, we derive the basic reproduction number and an expression of final epidemic size. Moreover, we present the threshold for effective contact tracing rate, such that the basic reproduction number is less than one if the contact tracing rate is larger than the threshold. We prove that when the mean awareness period is fixed, a larger variance in awareness process contributes to a smaller basic reproduction number, a larger final epidemic size and a greater threshold of effective contact tracing rate. Further, two common non-Markovian distributions (Gamma and Uniform) are considered in numerical simulations to verify the analytic results.
We find that the enforcement of contact tracing has great impacts on the transmission of airborne diseases. Increasing the contact tracing rate can decrease the basic reproduction number, increase the final epidemic size, reduce the number of infections, thereby control the spread of disease. When the contact tracing rate is large, increasing contact tracing rate can greatly enlarge the final epidemic size. When the contact tracing rate is small, increasing tracing rate can reduce the basic reproduction number by a larger scale. To reduce the basic reproduction number to be less than one and finally curb the epidemic spread, an effective tracing rate that is larger than the threshold can be employed. Moreover, we find that susceptible individuals reduce their contacts with infectious individuals and more infectious individuals are traced when the contact tracing rate is larger. Hence, effective tracing strategies contribute to contain epidemic spread and reduce the contacts of susceptible individuals with infectious individuals, while the efficiencies of contact tracing vary.
The awareness on the state of infection among infected individuals is another important factor that affects the efficiency of disease control. When the mean awareness period is fixed, larger variance in the awareness process indicates that more infected individuals are aware of their infection in a shorter time. In this case, larger variance in the awareness process leads to smaller basic reproduction number, lower threshold of effective contact tracing rate, and larger treated (aware and traced) proportion of the infected population. Our study suggests that the public health authorities should improve the availability of rapid antigen testing and raise awareness of infectious status, so that more infected individuals are aware of their infected states and seek treatment in a short time. In particular, when the awareness process of infectious status has a larger variance and a fixed mean, contact tracing strategies have better performances in mitigating the spread of disease.
Our study incorporates contact tracing and the non-Markovian awareness process in a pairwise model. The analytical and simulation results help us understand the roles of contact tracing and awareness of humans in controlling the spread of disease. Since the economic costs of implementing contact tracing strategies are high especially when there are a large number of contacts with infected and treated people, public health authorities should also educate the population to maintain awareness about the infection. Rational allocation of resources for implementing contact tracing and awareness education can lead to rapid identification of infections and relieve the financial burden on the health authorities. In addition, our work can be extended by incorporating the non-Markovian infection process and recovery process into the epidemic model, which makes the model more realistic. Furthermore, the homogeneous network in our work is an approximation of the actual contact network. Hence, modelling heterogenous networks to investigate the role of contact tracing and awareness education in controlling the epidemic of infectious diseases will also be studied in our future work.
Data availability statement
The raw data supporting the conclusions of this article will be made available by the authors, without undue reservation.
Author contributions
WS and LX conceived the study and performed the theoretical studies. WS, LX, and JR carried out the numerical analysis. WS, LX, JR, and XS discussed the numerical results and interpreted the biological relevance. WS, LX, and JR wrote the manuscript. All authors reviewed and revised the manuscript.
Funding
WS was supported by the Fundamental Research Funds for the Central Universities of China 3072021 CFP2401. LX is funded by the National Natural Science Foundation of China 12171116 and Fundamental Research Funds for the Central Universities 3072020CFT2402 and 3072022TS2404.
Conflict of interest
The authors declare that the research was conducted in the absence of any commercial or financial relationships that could be construed as a potential conflict of interest.
Publisher’s note
All claims expressed in this article are solely those of the authors and do not necessarily represent those of their affiliated organizations, or those of the publisher, the editors and the reviewers. Any product that may be evaluated in this article, or claim that may be made by its manufacturer, is not guaranteed or endorsed by the publisher.
References
1. Mieghem PV, Omic J, Kooij R. Virus spread in networks. IEEE ACM Trans Netw (2008) 17:1–14. doi:10.1109/TNET.2008.925623
2. Miller J. A note on a paper by erik volz: SIR dynamics in random networks. J Math Biol (2011) 62:349–58. doi:10.1007/s00285-010-0337-9
3. Newman M. Spread of epidemic disease on networks. Phys Rev E (2002) 66:016128. doi:10.1103/PhysRevE.66.016128
4. Pastor-Satorras R, Castellano C, Mieghem PV, Vespignani A. Epidemic processes in complex networks. Rev Mod Phys (2015) 87:925–79. doi:10.1103/RevModPhys.87.925
5. Wang Z, Xia C, Chen Z, Chen G. Epidemic propagation with positive and negative preventive information in multiplex networks. IEEE Trans Cybern (2021) 51:1454–62. doi:10.1109/TCYB.2019.2960605
6. Hethcote H, Yorke J. Gonorrhea transmission dynamics and control. New York, United States: Springer (2014).
7. Müller J, Kretzschmar M. Contact tracing–Old models and new challenges. Infect Dis Model (2021) 6:222–31. doi:10.1016/j.idm.2020.12.005
8. Kretzschmar M, van Duynhoven Y, Severijnen A. Modeling prevention strategies for gonorrhea and Chlamydia using stochastic network simulations. Am J Epidemiol (1996) 144:306–17. doi:10.1093/oxfordjournals.aje.a008926
9. Kasaie P, Andrews J, Kelton W, Dowdy D. Timing of tuberculosis transmission and the impact of household contact tracing. An agent-based simulation model. Am J Respir Crit Care Med (2014) 189:845–52. doi:10.1164/rccm.201310-1846OC
10. Peak C, Childs L, Grad Y, Buckee C. Comparing nonpharmaceutical interventions for containing emerging epidemics. Proc Natl Acad Sci U S A (2017) 114:4023–8. doi:10.1073/pnas.1616438114
11. Keeling M. Correlation equations for endemic diseases: Externally imposed and internally generated heterogeneity. Proc R Soc Lond B (1999) 266:953–60. doi:10.1098/rspb.1999.0729
12. Keeling M, Rand D, Morris A. Correlation models for childhood epidemics. Proc R Soc Lond B (1997) 264:1149–56. doi:10.1098/rspb.1997.0159
13. Satō K, Matsuda H, Sasaki A. Pathogen invasion and host extinction in lattice structured populations. J Math Biol (1994) 32:251–68. doi:10.1007/BF00163881
14. Eames K. Contact tracing strategies in heterogeneous populations. Epidemiol Infect (2007) 135:443–54. doi:10.1017/s0950268806006923
15. Heijne J, Althaus C, Herzog S, Kretzschmar M, Low N. The role of reinfection and partner notification in the efficacy of Chlamydia screening programs. J Infect Dis (2011) 203:372–7. doi:10.1093/infdis/jiq050
17. Jing W, Ma N, Liu W, Zhao Y. The effect of public health awareness and behaviors on the transmission dynamics of syphilis in Northwest China, 2006-2018, based on a multiple-stages mathematical model. Infect Dis Model (2021) 6:1092–109. doi:10.1016/j.idm.2021.08.009
18. Muhammad S, Hincal E, Yusuf A. Mathematical modeling and analysis for the transmission dynamics of blinding trachoma with effect of awareness programs. Results Phys (2021) 28:104683. doi:10.1016/j.rinp.2021.104683
19. Musa S, Qureshi S, Zhao S, Yusuf A, Mustapha U, He D. Mathematical modeling of COVID-19 epidemic with effect of awareness programs. Infect Dis Model (2021) 6:448–60. doi:10.1016/j.idm.2021.01.012
20. Wang Z, Guo Q, Sun S, Xia C. The impact of awareness diffusion on SIR-like epidemics in multiplex networks. Appl Math Comput (2019) 349:134–47. doi:10.1016/j.amc.2018.12.045
21. Yuan Y, Li N. Optimal control and cost-effectiveness analysis for a COVID-19 model with individual protection awareness. Physica A: Stat Mech its Appl (2022) 603:127804. doi:10.1016/j.physa.2022.127804
22. Garrett N, Tapley A, Andriesen J, Seocharan I, Fisher L, Bunts L, et al. High asymptomatic carriage with the Omicron variant in South Africa. Clin Infect Dis (2022) 75:289–92. doi:10.1093/cid/ciac237
23. Kim E, Choe Y, Park H, Jeong H, Chung J, Yu J, et al. Community transmission of SARS-CoV-2 Omicron variant, South Korea, 2021. Emerg Infect Dis (2022) 28:898–900. doi:10.3201/eid2804.220006
24. Sayampanathan A, Heng C, Pin P, Pang J, Leong T, Lee V. Infectivity of asymptomatic versus symptomatic COVID-19. The Lancet (2021) 397:93–4. doi:10.1016/S0140-6736(20)32651-9
25. Lin C, Clark R, Tu P, Tu R, Hsu Y, Nien H. The disconnect in hepatitis screening: Participation rates, awareness of infection status, and treatment-seeking behavior. J Glob Health (2019) 9:010426. doi:10.7189/jogh.09.010426
26. van den Hurk K, Merz E, Prinsze F, Spekman M, Quee F, Ramondt S, et al. Low awareness of past SARS-CoV-2 infection in healthy plasma donors. Cel Rep Med (2021) 2:100222. doi:10.1016/j.xcrm.2021.100222
27. Joung S, Ebinger J, Sun N, Liu Y, Wu M, Tang A, et al. Awareness of SARS-CoV-2 Omicron variant infection among adults with recent COVID-19 seropositivity. JAMA Netw Open (2022) 5:e2227241. doi:10.1001/jamanetworkopen.2022.27241
28. Keeling M, Grenfell B. Understanding the persistence of measles: Reconciling theory, simulation and observation. Proc R Soc Lond B (2002) 269:335–43. doi:10.1098/rspb.2001.1898
29. Lloyd A. Realistic distributions of infectious periods in epidemic models: Changing patterns of persistence and dynamics. Theor Popul Biol (2001) 60:59–71. doi:10.1006/tpbi.2001.1525
30. Wallace M, James A, Silver R, Koh M, Tobolowsky F, Simonson S, et al. Rapid transmission of severe acute respiratory syndrome coronavirus 2 in detention facility, Louisiana, USA, May–June, 2020. Emerg Infect Dis (2021) 27:421–9. doi:10.3201/eid2702.204158
31. Kiss I, Röst G, Vizi Z. Generalization of pairwise models to non-Markovian epidemics on networks. Phys Rev Lett (2015) 115:078701. doi:10.1103/PhysRevLett.115.078701
32. Sherborne N, Miller J, Blyuss K, Kiss I. Mean-field models for non-Markovian epidemics on networks. J Math Biol (2018) 76:755–78. doi:10.1007/s00285-017-1155-0
33. Li J, Jin Z, Yuan Y, Sun G. A non-Markovian SIR network model with fixed infectious period and preventive rewiring. Comput Math Appl (2018) 75:3884–902. doi:10.1016/j.camwa.2018.02.035
34. Cator E, de Bovenkamp RV, Mieghem PV. Susceptible-infected-susceptible epidemics on networks with general infection and cure times. Phys Rev E (2013) 87:062816. doi:10.1103/PhysRevE.87.062816
35. Iribarren J, Moro E. Branching dynamics of viral information spreading. Phys Rev E (2011) 84:046116. doi:10.1103/PhysRevE.84.046116
36. Mieghem PV, van de Bovenkamp R. Non-Markovian infection spread dramatically alters the susceptible-infected-susceptible epidemic threshold in networks. Phys Rev Lett (2013) 110:108701. doi:10.1103/PhysRevLett.110.108701
37. Röst G, Vizi Z, Kiss I. Pairwise approximation for SIR-type network epidemics with non-Markovian recovery. Proc R Soc A (2018) 474:20170695. doi:10.1098/rspa.2017.0695
38. Zhang J, Li D, Jing W, Jin Z, Zhu H. Transmission dynamics of a two-strain pairwise model with infection age. Appl Math Model (2019) 71:656–72. doi:10.1016/j.apm.2019.03.001
39. Vizi Z, Kiss I, Miller J, Röst G. A monotonic relationship between the variability of the infectious period and final size in pairwise epidemic modelling. J Math Ind (2019) 9:1–15. doi:10.1186/s13362-019-0058-7
40. Röst G, Vizi Z, Kiss I. Impact of non-Markovian recovery on network epidemics. In: RP Mondaini, editor. Biomat 2015: International symposium on mathematical and computational biology. Singapore: World Scientific (2016). p. 40–53. doi:10.1142/9789813141919_0003
41. McKendrick A. Applications of mathematics to medical problems. Proc Edinb Math Soc (1926) 44:98–130. doi:10.1017/S0013091500034428
42. Rand D. Correlation equations and pair approximations for spatial ecologies. In: J McGlade, editor. Advanced ecological theory: Principles and applications. New York, United States: Wiley (1999). p. 100–42.
43. Diekmann O, Heesterbeek J, Metz J. On the definition and the computation of the basic reproduction ratio r0 in models for infectious diseases in heterogeneous populations. J Math Biol (1990) 28:365–82. doi:10.1007/BF00178324
Keywords: infectious diseases, contact tracing, non-Markovian, awareness, pairwise model
Citation: Sun W, Ren J, Xue L and Sun X (2022) Effects of contact tracing and non-Markovian awareness process on the spread of air-borne diseases. Front. Phys. 10:1089199. doi: 10.3389/fphy.2022.1089199
Received: 04 November 2022; Accepted: 05 December 2022;
Published: 20 December 2022.
Edited by:
Xiaoke Xu, Dalian Nationalities University, ChinaReviewed by:
Chengyi Xia, Tiangong University, ChinaGuanghu Zhu, Guilin University of Electronic Technology, China
Copyright © 2022 Sun, Ren, Xue and Sun. This is an open-access article distributed under the terms of the Creative Commons Attribution License (CC BY). The use, distribution or reproduction in other forums is permitted, provided the original author(s) and the copyright owner(s) are credited and that the original publication in this journal is cited, in accordance with accepted academic practice. No use, distribution or reproduction is permitted which does not comply with these terms.
*Correspondence: Ling Xue, bHh1ZUBocmJldS5lZHUuY24=
 Wei Sun
 Jing Ren1
 Ling Xue