- School of Electronic Science and Engineering, University of Electronic Science and Technology of China, Chengdu, China
In the design of high-speed interconnection systems, it is often necessary to evaluate signal integrity and electromagnetic interference performance by extracting terminal network parameters and differential and common mode network parameters. However, in a multi-conductor transmission line, the characteristic parameters related to different conductors, which named terminal in terminal theory, are couped together in traditional model network parameters and could not be extracted directly. Therefore, in this paper, a three-dimension terminal simulation tool based on transfinite element method is developed to solve this problem. The vector finite element method is combined with the transfinite element method, and the electric field of the truncation surface is approximated by the expansion of the truncation surface mode function. As far as we know, the combination of the transfinite element method and the terminal theory is proposed for the first time. The terminal simulation tool has a human-computer interaction interface, as well as functions such as modeling, mesh generation, solution setting, and post-processing result display, which can accurately obtain the terminal network parameters and differential and common mode network parameters. Numerical examples are given to demonstrate the accuracy and efficiency of the developed tool compared with the results from HFSS.
Introduction
With the development of electronic technology, the operating speed and frequency of electronic equipment, and the integration of components have been continuously increasing [1, 2]. In high-speed interconnection systems, signal integrity problems such as reflection, crosstalk, delay and interference will occur when high-speed signals pass through interconnection lines [3, 4]. Signal integrity has become one of the key issues in the successful design of high-speed digital systems [5–7]. Signals propagate through the high-speed interconnection lines in the form of electromagnetic waves [8]. In the low-frequency region, the quasi-TEM models based on the equivalent physical circuit models assume that the propagating waves are similar to the pure TEM modes and neglect the longitudinal field components [9], thus the quasi-TEM approximation can be effectively and accurately carried out. However, this method can yield accurate results only at the low-frequency region, and there is no clear upper limit of frequency to ensure its effectiveness [10]. As the frequency increases and the structure becomes more complex, the dispersion characteristics of the interconnection lines become more predominant. At higher frequencies, when the longitudinal field components are no longer negligible, the assumption of quasi-TEM models is not valid, and the full-wave electromagnetic analysis must be carried out [11].
The finite element method (FEM) [12] is one of the popular full-wave analysis methods in electromagnetic simulation. The FEM can match complex structure by flexible tetrahedral meshes, so it has the advantages of flexibility and versatility [13]. With the development of computing technology and computer aided design, there are many kinds of commercial software based on the FEM, such as the commonly used commercial software HFSS.
After the full-wave electromagnetic analysis of the high-speed interconnection system, the network parameters are usually extracted for frequency domain or time domain analysis [14, 15]. The traditional finite element method uses wave port excitation to obtain modal transmission characteristic parameters [16]. The transmission characteristics of each mode are coupled together and cannot be extracted individually. In addition, because most interconnection structures are of the open type, when the traditional FEM is used to deal with the truncation of the unbounded region, the artificial boundary is often approximated by the absorbing boundary condition [17], which is generally the approximation of the precise radiation boundary condition, so the accuracy and application range are limited.
The transfinite element method (TFEM) has the following advantages. Firstly, the processing of the truncation surface is based on the expansion of the mode function, which reduces the number of unknowns at the truncation surface and saves the storage space for the matrix. Secondly, the mode function expansion process for higher-order modes is simplified, so that the field distribution of the truncation port can be described more accurately. Finally, the modal characteristic parameters can be directly obtained from the final calculation results, so that the terminal characteristic parameters can be obtained by transformation. Therefore, the TFEM is adopted to obtain the terminal characteristic parameters accurately and conveniently.
In this paper, the combination of the TFEM and the terminal theory is proposed for the first time, and a three-dimension terminal simulation tool based on the transfinite element method for the analysis of electromagnetic effects in high-speed interconnection systems is developed. We first introduce the architecture of the terminal simulation tool. Then we introduce related theories and formulas, including the derivation of finite element formulas, transfinite element method and terminal theory. Finally, some numerical examples are presented to demonstrate the accuracy and efficiency of the terminal simulation tool.
Architecture of the terminal simulation tool
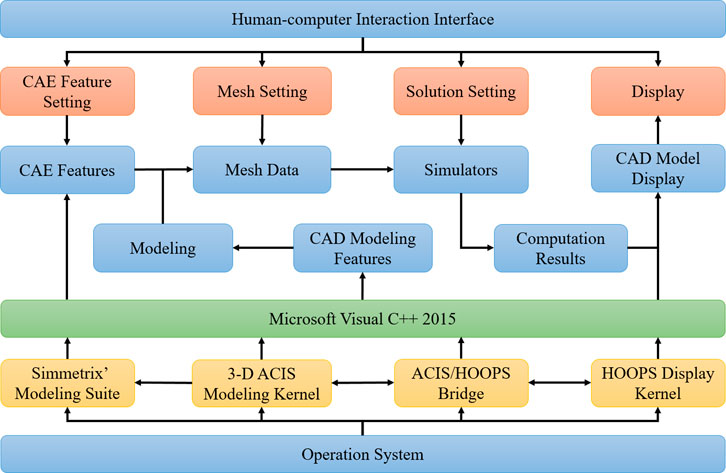
The architecture of the terminal simulation tool shown in Figure 1 refers to [13]. The model contains not only CAD geometry information, but also CAE feature information such as materials, boundary conditions, and excitation sources. Fully automatic unstructured meshing based on geometry can be achieved. The generated mesh information is passed to the terminal simulator, and then finite element analysis is performed according to the solution settings such as unit and solution frequency, and finally the obtained simulation result information is displayed.
Theory and formulation
Finite element formulation
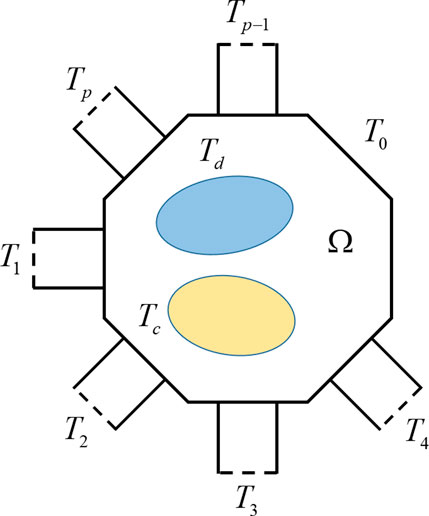
As shown in Figure 2, we consider a general circuit structure. Ω denotes the volume of the computational domain, and is bounded by two types of truncation surfaces, including the ports Ti (i = 1, 2, … , p) and the side wall T0. In the structure, Tc denotes the surface of a conductor and Td denotes the interface between different dielectric materials. In the computational domain, the electric field E in Ω must satisfy the vector wave equation
where k0 and Z0 are the wavenumber and the intrinsic impedance of free space; and Ji is an impressed current density as an excitation source.
The boundary conditions applied in the electromagnetic simulation include the perfect electric conductor (PEC) boundary, the impedance boundary condition (IBC), the absorbing boundary condition (ABC) and port boundary condition (PBC). Implementation of these boundaries in the FEM is described in [12].
We adopt the Galerkin method, its scalar multiplication of Eq. 1 by a weighting function w and integration over the computational domain Ω, and obtain the weak form as follows
where the surface integral of two complex-valued vector functions will be shorted conveniently as
and the volume integral of two complex-valued functions in a domain Ω is denoted by
Transfinite element method
After the finite element analysis of the high-speed interconnection system, the network parameters of the interconnection structure are usually extracted; and the electromagnetic field analysis is converted into a circuit analysis by applying the microwave network theory [18]. In general, the characteristics of a network can be analytically described by admittance parameters (Y-parameters), impedance parameters (Z-parameters), or scattering parameters (S-parameters) [19]. Among them, the S-parameter has been widely used in microwave network and microwave circuit analysis. Because its physical meaning is clear and it can be transformed into other network parameters, it is most suitable to describe the external characteristics of the network.
In order to obtain the modal scattering matrix of the port accurately, we use the TFEM. For the convenience of discussion and without loss of generality, we adopt a two-port structure and the first-order vector basis functions. The main idea of TFEM is to combine the weak form of the Helmholtz equation with the expansion of the mode function in the regular truncated region. When the modal impedance and mode function have been obtained, we analyze the mode function set, (Eij, Hij) (i = 1 or 2; j = 1, 2, … , Nm) of the electric field and magnetic field of the port. It is assumed that Nm is sufficient to provide an accurate approximation of the electric field on the port boundaries T1 and T2, and their electric field mode functions are expressed as follows [20].
According to the modal orthogonality relationship [21], the transverse electric and magnetic fields are normalized to obtain a set of normalized mode functions (eij, hij) (i = 1 or 2; j = 1, 2, … , Nm). If the computational domain uses tetrahedral meshes for the region discretization, there are triangular elements on the boundaries. Then the total electric and magnetic field of the entire computational domain can be divided into the following form:
where Ne is the number of edges in the mesh excluding those on the PEC surfaces, Npe is the number of edges on the ports, and α1i and α2i are the coefficients of the i-th mode. e1k denotes the excitation on T1 for the problem, which is the k-th mode with amplitude 1. The negative sign in front of h1k is due to the propagation of the excitation wave into the computational domain, and our definition of the propagation directions of the normalized modal electric and magnetic fields is based on the outgoing unit normal along the waveguide axis on the port boundary.
A simplified alternative form of Eq. 6 is obtained by absorbing the incident electric field mode into the modal sum, and the two modified expansions become
Without considering an impressed current density, substitution of Eq. 7 into Eq. 2, then imposing the first-order ABC on T0 and applying the Galerkin process yields the following finite element equation for j = 1, 2, … , Ne − Npe:
The surface integral on T1 and T2 is zero, because edge elements on T1 and T2 have been excluded from the expansion of the electric field vector, and thus
where
and the vector xE contains the expansion coefficients for the Ne−Npe edge elements; x1α and x2α are the vector containing the expansion coefficients of the modal field representation of the tangential electric field on the port boundaries T1 and T2. The elements of the matrix P1 and P2 are given by
In a similar manner, multiplying the mode functions elj (l = 1 or 2; j = 1, 2, … , Nm) on ports as the weighting function and integrating over the computational domain yields.
Considering the surface integral over T1 and making use of the orthogonality of modes, only the term associated with h1j is nonzero. In matrix form, Eq. 12 become
where I is an identity matrix, and the elements of R1 and R2 are given by
Regarding the excitation vector f, all elements are zero except the element in the row associated with the excitation mode k, which has the value fk = 2jωμ0.
Finally, the finite element matrix statement of the problem is obtained by combining Eqs 9, 13,
Next extending the tangential part of the modal electric fields according to the Npe1 and Npe2 edge elements on the port boundaries T1 and T2, we have
where
where the vector b1i and b2i contain the expansion coefficients in the edge-element expansion of the i-th mode.
Thus the space W of all edge elements used in the finite element approximation is decomposed into three subsets as follows:
where WI denotes the subset of the edge elements excluding those on PEC surfaces and ports, and WP1 and WP2 denote the subset of the edge elements on T1 and T2. We define the notation Wq, q∈{I, P1, P2}, as the row vector containing the elements of subset, and
Thus the expressions for the matrices P1, P2, R1 and R2 are given by
For the case of truncating the wave ports using the TFEM, we obtain the following form of the finite element matrix
The solution of the above matrix equation can directly obtain the electric field solution inside the electromagnetic device according to xE and the modal S-parameters of the modal field. The i-th elements of vector x1α and x2α are equal to the reflection and transmission coefficient of the i-th mode. According to Eq. 7, the reflection coefficient of the excited mode is obtained by subtracting 1 from the k-th element of x1α.
Terminal theory
A multiconductor port is composed of coupled signal conductors, and a terminal is assigned on a conductor in contact with the port. The number of modes for a port is determined by the number of terminals that touch the port. If N + 1 different conductors touch the port, there are N terminals and one reference conductor commonly called ground.
When the multiconductor port is used for an excitation, a modal scattering matrix can be directly obtained by exciting each port with a number of modes equal to the number of terminals. Then the modal scattering matrix can be converted to a terminal impedance (admittance) matrix and a terminal scattering matrix referenced to either the actual line characteristic impedance matrix or a normalized impedance (for example, 50 Ω).
The modal port representations of the tangential electric and magnetic fields [22] are
where a and b are the complex modal coefficient vectors of the ingoing and outgoing modal fields, respectively, and a is related to b by the modal scattering matrix as
where Sm denotes the modal scattering matrix.
According to the definition of voltage and Ampere’s law, the terminal voltages and currents in matrix notation are given by
where Mv and Mi are the modal voltage and current matrices. Combining Eqs 23, 24 yields the following relationship
where the terminal admittance matrix Yt is given by
and I is identity matrix.
In order to obtain the terminal scattering matrix St, we assume that α and β are ingoing and outgoing nodal waves, respectively. α is related to β by the terminal scattering matrix as
Using the following definitions
and substituting Eq. 25 into Eq. 28, we obtain
where Zt = Yt−1 is an impedance matrix and Zr is the reference impedance matrix.
The terminal scattering matrix St is given by
Thus the modal S-parameters are converted into the terminal S-parameters, and other characteristic parameters, such as the terminal Y-parameters and the terminal Z-parameters, can also be obtained.
In theory, the combination of two single-ended conducting traces is a differential pair. The differential pair is an effective way to remove noise from a signal. As shown in Figure 3, a differential signal is transmitted through the differential pair, and the voltages v1 and v2 on the two traces are equal and opposite. The differential and common voltages vd and vc are defined by
According to the law of conservation of energy, the differential and common currents id and ic are defined by
Eqs 31, 32 can be represented as follows:
where v = [v1 v2]T, e = [vd vc]T, i = [i1 i2]T, u = [id ic]T, and
Substituting Eq. 33 into Eq. 25 yields
and the differential admittance matrix
In a similar way, we can obtain the differential impedance matrix
and the differential scattering matrix
where Zdr is the differential reference impedance matrix.
Numerical examples
In order to demonstrate the accuracy and efficiency of the terminal simulation tool, it uses the second-order vector basis functions and the direct method to analyze the following examples, and its results are compared with those of the commercial software HFSS 2020. All examples are performed on a Windows 10 64-bit system workstation equipped with two 10-core Intel Xeon Gold 5,115 2.4-GHz CPUs and 128-GB RAM.
Coaxial cable
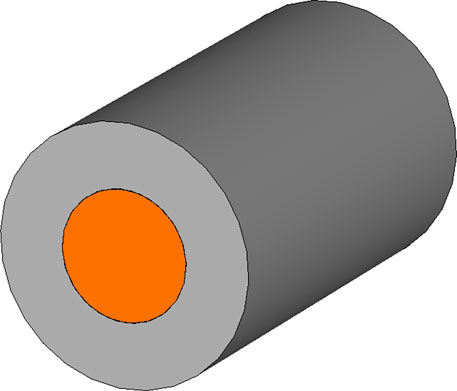
The first example is a coaxial cable as shown in Figure 4 to demonstrate that the developed tool has basic terminal network parameter analysis capabilities. The copper conductor is surrounded by a homogeneous dielectric, whose relative permittivity is 4.4. The radii of the copper conductor and the dielectric are 1.5 mm and 3 mm. The length of the coaxial cable is 10 mm. The operation frequency is 7 GHz. The frequency scan starts at 6 GHz and ends at 8 GHz.
The calculation results of the proposed method (TFEM) and FEM are compared with HFSS. The result comparisons of terminal network parameters diagram of the coaxial cable are shown in Figure 5. From it we can see that the results calculated by the TFEM and FEM are consistent with HFSS, thereby verifying the accuracy of the developed tool.

FIGURE 5. Comparisons of terminal (A) S-parameters, (B) Y-parameters and (C) Z-parameters of the coaxial cable among HFSS, FEM and the developed tool (TFEM).
In addition, the computational performance of the TFEM and FEM are investigated. As shown in Table 1, it can be seen that the calculation time and peak memory of the TFEM are less than those of the FEM, which proves the advantages of the proposed method.
Differential microstrip line
The second example is a differential microstrip line as shown in Figure 6A, which is used to demonstrate that the developed tool has the basic terminal network parameter analysis capability of differential pairs. The differential microstrip line comprises of two copper traces and a dielectric substrate enclosed in an air-box. The relative permittivity of this substrate is 4.4. The thickness of the trace is 0.7 mil, and the width of the model is 2 mil. The remaining dimensions are indicated in Figure 6A in mils. The finite conductivity boundary is assigned on the bottom face of the model, and its parameters are the same as those of cooper. The radiation boundary is assigned on the top, left and right faces.
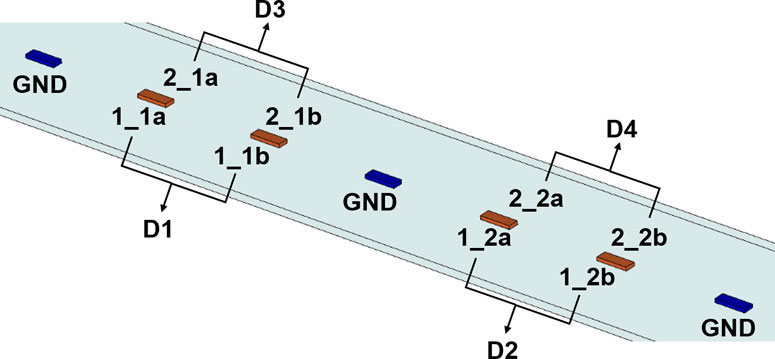
The two ports are assigned in the remaining faces and deembedded with 499 mil outwards from the structure. There are 4 terminals assigned as shown in Figure 6B, and their renormalizing impedance is 50 Ω. The terminals 1_a and 1_b form a differential pair named D1, the terminals 2_a and 2_b form another differential pair named D2. The differential mode impedance of the differential pairs is 100 Ω. The operation frequency is 3 GHz, and the frequency sweep is from 2 GHz to 4 GHz.
The computational results of the terminal network parameters of differential pairs are shown in Figure 7. It is seen that when the operating frequency is 3.4 GHz, the return loss of the differential signals is the lowest. It can be observed that the results calculated by the developed tool show good agreement with HFSS so that demonstrate the terminal network parameter analysis capabilities of differential pairs of the developed tool.

FIGURE 7. Comparisons of terminal (A) S-parameters, (B) Y-parameters and (C) Z-parameters of differential pairs between HFSS and the developed tool (TFEM).
Stripline
In order to demonstrate the multi-mode terminal network parameter analysis capability of the developed tool, the third example is a set of seven copper striplines as shown in Figure 8. The first, fourth and seventh stripline from the left are ground conductors. The relative permittivity of this substrate is 4.4. The thickness of the trace is 0.7 mil, and the width of the model is 2 mil. The remaining dimensions are indicated in Figure 8 in mils. The finite conductivity boundary, whose parameters are the same as those of cooper, is assigned on the bottom and top faces of the model.
We assign two ports on the front and back faces and deembed them with 499 mil outwards from the structure. There are eight terminals assigned as shown in Figure 9, and their renormalizing impedance is 50 Ω. The terminals form four differential pairs, and their differential mode impedance is 100 Ω. The operation frequency is 3 GHz, and the frequency sweep is from 2 GHz to 4 GHz.
As shown in Figure 10, when the operating frequency is 2.8 GHz, the return loss of the differential signals is the lowest. It is observed that the results of the terminal network parameters of differential pairs calculated by the developed tool are in good agreement with HFSS, which can demonstrate the correctness of the developed tool for multi-mode terminal network parameter analysis.

FIGURE 10. Comparisons of terminal (A) S-parameters, (B) Y-parameters and (C) Z-parameters of differential pairs between HFSS and the developed tool (TFEM).
Via model
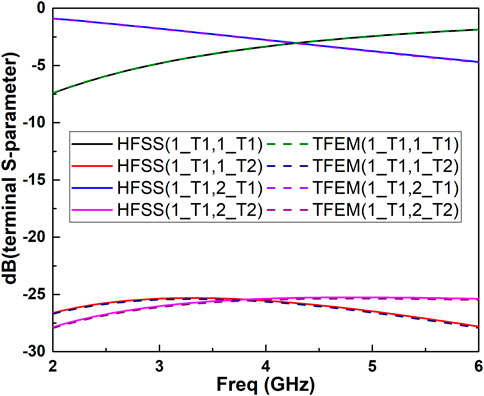
The above examples verify the accuracy of the developed tool, then a model with more complex structure is used to further verify the efficiency improvement of the developed tool. The final example is a via model as shown in Figure 11, which is widely used for signal connection between different layers in multilayer PCBs. It has a pair of microstrip lines that transition through the vias to a pair of striplines on a lower layer. The width of the structure is 128 mil. The conductors are copper and the relative permittivity of the dielectric is 4.4. The thicknesses of the conductors and dielectric are 1.2 mil and 5 mil, respectively. The remaining dimensions are indicated in Figure 11 in mils. The radiation boundary is applied to the air box.
The two ports are assigned as shown in Figure 11 and deembedded with 48 mil outwards from the structure. The two microstrip lines are each assigned a terminal in the coupled microstrip port. The same goes for the two striplines at the opposite end. Their renormalizing impedance is 200 Ω. The operation frequency is 4 GHz, and the frequency sweep is from 2 GHz to 6 GHz.
Figure 12 shows comparisons of the calculation results of the terminal parameters calculated by the developed tool and HFSS. It can be seen the results are consistent, which further demonstrates the accuracy of the developed tool.
We further analyze the computational efficiency of the via model. The comparisons of the developed tool and HFSS are given in Table 2. The developed tool has advantages in terms of CPU times and memory consumption with a similar number of tetrahedron grids in the via model simulation, thus proving the efficiency of the developed tool.
Conclusion
In this paper, the combination of the TFEM based on the finite element method and the terminal theory is proposed for the first time, and a three-dimension terminal simulation tool based on the transfinite element method is developed. Firstly, we introduce the architecture of the terminal simulation tool. Then we introduce related theories and formulas, including the derivation of finite element formulas, transfinite element method and terminal theory. In the final section, some numerical examples are presented to demonstrate the accuracy and efficiency of the terminal simulation tools by comparing the calculation results of this developed tool with those of HFSS. Therefore, the terminal simulation tool is suitable for the analysis of electromagnetic effects in high-speed interconnection systems. In the future research, in order to improve the computational efficiency of the developed tool, the parallel implementation is a significant direction under the condition of ensuring the accuracy of the calculation results.
Data availability statement
The original contributions presented in the study are included in the article/Supplementary Material, further inquiries can be directed to the corresponding author.
Author contributions
SY: Theoretical derivation, preprocess part and TFEM coding, data curation and formal analysis, original draft writing and revising. HW: Theoretical derivation, terminal part coding, article review and editing, project administration. LX: Theoretical guidance, supervision and funding acquisition. MC: Theoretical guidance and terminal part coding. BingL: Theoretical guidance and article review. HL: Theoretical guidance and article review. BinL: Article review and editing. All authors discussed the results and contributed to manuscript revision. And all authors have read and agreed to the published version of the manuscript.
Acknowledgments
The authors would like to acknowledge the financial support provided by the National Natural Science Foundation of China under Grant 62071102, 12102087, and 61921002.
Conflict of interest
The authors declare that the research was conducted in the absence of any commercial or financial relationships that could be construed as a potential conflict of interest.
Publisher’s note
All claims expressed in this article are solely those of the authors and do not necessarily represent those of their affiliated organizations, or those of the publisher, the editors and the reviewers. Any product that may be evaluated in this article, or claim that may be made by its manufacturer, is not guaranteed or endorsed by the publisher.
References
1. Xu T, Dai HQ. Signal integrity design and optimization of a high speed single ended multi load circuit. In: 2022 Asia-Pacific International Symposium on Electromagnetic Compatibility, Beijing, China, September 01–04, (2022). p. 512–4.
2. Fan J, Ye XN, Kim J, Archambeault B, Orlandi A. Signal integrity design for high-speed digital circuits: Progress and directions. IEEE Trans Electromagn Compat (2010) 52:392–400. doi:10.1109/temc.2010.2045381
3. Shang ETM, Chyan LS, Sebastian P. Signal integrity analysis for high speed digital circuit. In: 2010 International Conference on Intelligent and Advanced Systems, Kuala Lumpur, Malaysia, June 15–17, (2010). p. 1–6.
4. Rao CSS, Tunga S. Analysis of high speed design on a multilayer PCB substrate. In: 2021 International Conference on Recent Trends on Electronics, Bangalore, India, August 27–28, Information, Communication & Technology (2021). p. 713.
5. Zhang H, Krooswyk S, Ou J. High speed digital design: Design of high speed interconnects and signaling. San Francisco: Elsevier Science & Technology (2015).
7. Zahid MN, Jiang JL, Lu H, Ali R, Eric D, Khan S, Zhang HL. Signal integrity simulation design and analysis of electronic article surveillance PCB for RFID applications. IEEE 3rd International Conference of Safe Production and Informatization (2020). p. 600–4. doi:10.1109/IICSPI51290.2020.9332408
8. Jamal R, Singh IK, Kumar V, Chandel A, Singh RK. Introduction to multiphysics simulation for integrated PCB design and operation AI environment analysis on behalf of EMI/EMC. J Mechatronics Automation (2019) 6:31–6.
9. Zhang J, Zhang X, Shen D, Kishk AA. Packaged microstrip line: A new quasi-TEM line for microwave and millimeter-wave applications. IEEE Trans Microw Theor Tech (2017) 65:707–19. doi:10.1109/tmtt.2016.2633356
10. Vendelin GD, Pavio AM, Rohde UL, Rudolph M. Microwave circuit design using linear and nonlinear techniques. 3rd ed. New Jersey: John Wiley & Sons (2021).
11. Wang D, Wu K. Mode-selective transmission line—Part I: Theoretical foundation and physical mechanism. IEEE Trans Compon Packaging Manuf Technol (2020) 10:2072–86. doi:10.1109/tcpmt.2020.3037328
12. Jin JM. The finite element method in electromagnetics. 3rd ed. New York: Wiley-IEEE Press (2014).
13. Liu B, Xu L, Wang H, Yang S, Liu H, Huang S, et al. A high efficiency three-dimensional finite-element electromagnetic radiation simulation tool. Int J RF Microw Comput Aided Eng (2021) 31:e22789. doi:10.1002/mmce.22789
14. Teoh L, Chiang C, Scogna AC, Khrone K, Lee H. De-embedding method and segmentation approach using full wave solver for high speed channels in PCB/package co-design. In: 2014 IEEE Electrical Design of Advanced Packaging & Systems Symposium, Bangalore, India, December 14–16, (2014). p. 33.
15. Teng HL, Yew YH. Multi-port high bandwidth interconnect equivalent circuit model for 3.2 Gbps channel simulation. In: 2016 IEEE 18th Electronics Packaging Technology Conference, Singapore, November 30–December 03, (2016). p. 638.
16. Xu L, Wang H, Li JQ, Li B. Windows simulator: An advanced three-dimensional finite-element S-parameter-simulation tool for microwave tubes. IEEE Int Vacuum Electron Conf (2015) 1. doi:10.1109/IVEC.2015.7223952
17. Albertini G, Elbanna AE, Kammer DS. A three-dimensional hybrid finite element —Spectral boundary integral method for modeling earthquakes in complex unbounded domains. Int J Numer Methods Eng (2021) 122:6905–23. doi:10.1002/nme.6816
18. Badrieh F. Spectral, convolution and numerical techniques in circuit theory. Cham: Springer (2018).
19. Gustavsen B, De Silva HMJ. Inclusion of rational models in an electromagnetic transients program: Y-parameters, Z-parameters, S-parameters, transfer functions. IEEE Trans Power Deliv (2013) 28:1164–74. doi:10.1109/tpwrd.2013.2247067
Keywords: terminal simulation tool, full-wave electromagnetic analysis, transfinite element method, finite element method, terminal network parameter
Citation: Yang S, Wang H, Xu L, Chen M, Liu B, Liu H and Li B (2022) A three-dimension terminal simulation tool based on transfinite element method. Front. Phys. 10:1082688. doi: 10.3389/fphy.2022.1082688
Received: 28 October 2022; Accepted: 25 November 2022;
Published: 07 December 2022.
Edited by:
Amin Chabchoub, Kyoto University, JapanCopyright © 2022 Yang, Wang, Xu, Chen, Liu, Liu and Li. This is an open-access article distributed under the terms of the Creative Commons Attribution License (CC BY). The use, distribution or reproduction in other forums is permitted, provided the original author(s) and the copyright owner(s) are credited and that the original publication in this journal is cited, in accordance with accepted academic practice. No use, distribution or reproduction is permitted which does not comply with these terms.
*Correspondence: Hao Wang, aGFvd2FuZ0B1ZXN0Yy5lZHUuY24=
 Siyi Yang
 Hao Wang
 Li Xu
Li Xu