 Yun Yang
 Zhou Min
 Jinzhao Zuo1
95% of researchers rate our articles as excellent or good
Learn more about the work of our research integrity team to safeguard the quality of each article we publish.
Find out more
ORIGINAL RESEARCH article
Front. Phys. , 13 December 2022
Sec. Physical Acoustics and Ultrasonics
Volume 10 - 2022 | https://doi.org/10.3389/fphy.2022.1081805
This article is part of the Research Topic Nondestructive Testing, Multi-Field Information Fusion, and AI-Aided Signal Processing View all 7 articles
As a key safety component of automobiles, automobile steering knuckles must be subjected to strict quality control. Currently, the identification of cracks in finished products primarily relies on manual identification of fluorescent penetrant detection. Owing to the complex shape of the workpiece, the interference of the displayed image and the small sample size, the accuracy of the automatic discrimination result of the fluorescent penetrant detection image is directly reduced. Therefore, this study proposed a data augmentation method based on deep convolutional generative adversarial networks (DCGAN) for crack identification in automotive steering knuckle fluorescent penetration inspection images. An image acquisition platform was built for fluorescence penetration detection of automobile steering knuckles, and fluorescence display images of various parts of the workpiece were collected. Based on the feature analysis of the displayed image, the image was preprocessed to suppress relevant interference and extract crack candidate regions. Further, using the original crack image to train DCGAN, several crack image samples were generated, the ResNet network was trained with the expanded dataset, and the extracted candidate regions were identified. Finally, the experimental results show that the recall rate of the crack recognition method used in this paper is 95.1%, and the accuracy rate is 90.8%, which can better identify the crack defects in the fluorescent penetrant inspection image, compared with the non-generative data enhancement method.
The steering knuckle of an automobile is an auto part that transmits and bears the load on the front of the automobile, supports and drives the front wheel to rotate around the king pin, and turns the automobile. As the stability of the structure is related to the life safety of the driver, when the finished product is manufactured, non-destructive testing is essential. Fluorescent penetrant testing, as form of penetrant testing, is frequently used for defect detection of automotive safety parts owing to its high sensitivity, simple operation, and low cost [1]. The defects encountered in automobile steering knuckles are primarily cracks of varied sizes and shapes. Currently, crack identification is almost always performed manually, which is inefficient.
Certain foreign experts and scholars have attempted to use the traditional machine vision method to realize the automation of fluorescent penetrant detection. Wang et al. used wavelet denoising and edge detection to extract the defect location [2]. Tang Jianchao et al. took aero-engine turbine blades as the research object and adopted the method of machine vision to realize defect identification [3]. Shipway et al. used the random forest algorithm to classify the defect-related fluorescent penetration and false displays caused by insufficient flushing and roughness changes on titanium alloy specimens [4]. They successfully identified defects with varied sizes and shapes. Zheng et al. proposed an adaptive thresholding method with Canny edge detection and erosion-expansion-reduction operations to segment the fluorescence penetration images of aircraft parts, and extract features such as the center position, length and width, area, minimum enclosing rectangle, aspect ratio, etc. [5]. Consequently, they designed a classification function to achieve classification. Thus, the traditional machine vision method has achieved certain results in the defect recognition of fluorescent penetration images; however, the feature design process is complex, and the classification effect deteriorates with change in defect shape and size. Thus, there are several difficulties encountered in the actual detection application.
In recent years, deep learning has developed rapidly and is widely used in defect detection in a variety of applications [6–11]. It is gradually replacing defect detection methods based on feature engineering. However, the training of deep learning models requires a considerable data, which is scarce in application areas of fluorescence penetration, such as the inspection of aerospace components and automotive safety components. Traditional sample expansion methods based on linear transformation, including random cropping, flipping, etc., are limited to transformation on the basis of the original image, with high repetition and single data distribution; thus, its effect is limited [12]. Goodfellow et al. proposed generative adversarial network (GAN), which has been widely used in image generation , image super-resolution and data augmentation [13–18]. Pei et al. used a deep convolutional generative adversarial network (DCGAN) to augment the road crack image dataset, which exhibits greater detection accuracy than conventional augmentation methods [19]. Li et al. expanded the bubble samples to 4,000 by training a WGAN-GP network on 67 bubble data sets, which improved the generalization of the steel plate defect detection model [20]. Wang et al. proposes a true and false data fusion algorithm to expand the scarce defect data of solar cells by random fusion of DCGAN production pictures and real pictures [21]. Some scholars have also applied Gan to traffic sign recognition, and the results show that training with original images and composite images can improve the recognition performance of traffic signs [22]. In addition, Gan also has a large number of applications in the field of medical image generation and data enhancement [23–25]. Thus, extensive experiments have confirmed that the augmentation of samples based on GAN and its variants outperforms traditional non-generative augmentation methods [26–29]. As a variant of gan, DCGAN model has the advantages of high quality image generation and good training stability in terms of defect generation. It can generate a large number of similar samples under the condition of very small image samples to achieve the purpose of data enhancement.
With an aim to tackle the previously mentioned problems, this study proposed a method for identifying cracks in automobile steering knuckle fluorescence penetration detection based on DCGAN data enhancement. The characteristics of the fluorescence penetrant inspection image were analyzed, followed by image preprocessing. Then, the related interference was suppressed and the crack candidate area was segmented. DCGAN was used to expand the crack samples. Consequently, the crack recognition effect of the model trained with the data set expanded by the unexpanded and non-generative methods was compared, and the feasibility of the method to improve the recognition accuracy was verified.
Fluorescence penetrant testing is a non-destructive testing method based on capillary phenomenon to detect surface defects of workpieces [30]. The fluorescent penetrant inspection process for automobile steering knuckles is shown in Figure 1. First, the fluorescent penetrant was applied to the surface of the cleaned automobile steering knuckle and left for 10 min. Through capillary action, the penetrant penetrated into the small cracks on the surface of the workpiece. Then, the excess penetrant was removed by washing with water, and a developer was applied on the surface of the part after drying. Subsequently, the penetrant in the defect was re-adsorbed to the surface of the workpiece under capillary action, thereby forming an enlarged defect display. Finally, by illuminating the steering knuckle with a black light in a dark environment, the cracks on the surface of the steering knuckle could be clearly observed.
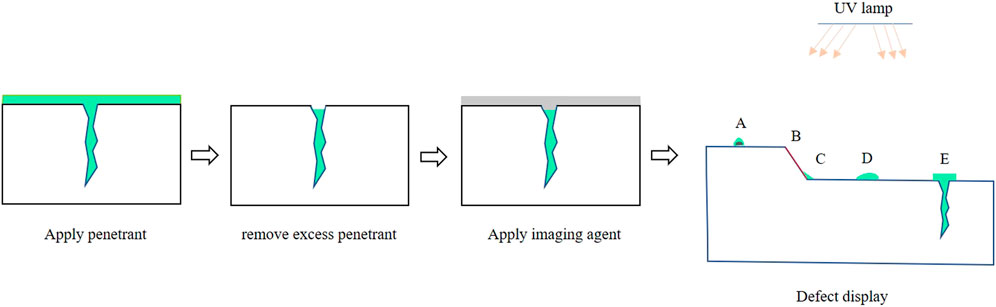
FIGURE 1. (A): Dust residue (B): UV light reflection (C): Edge disturbance (D): Permeate residue (E): crack.
The collected fluorescence penetrant inspection images also contained a part of the interference display in addition to the display of crack defect formation. As shown In Figures 1A,C, certain dust residues settled on the workpiece surface and edge, and the geometric mutation of the groove caused the accumulation of permeate to form an interference display. As the defect observation must be conducted under the irradiation of ultraviolet light and owing to the workpiece not being flat, in case of an oblique shooting angle, the collected image contains ultraviolet light reflection stripes, as shown in Figure 1B. In addition, the residual fluorescent penetrant on the surface of the workpiece also interferes with the judgment of crack defects, as shown in Figure 1D.
To analyze the characteristics of the interference display and crack image that can easily occur in the fluorescence penetrant inspection image, the gray distribution map corresponding to the interference display and the crack image in Figure 1 was made, as shown in Figure 2. The dust residues were observed as the workpiece was not cleaned, causing a large amount of permeate to accumulate at its edges. Most of the images were circular and the gray value distribution was between 200–250. The grayscale distribution of the ultraviolet light reflection area transitioned from 100 to 250, and the peak value was similar to the crack grayscale distribution. Further, the edge disturbances appeared as noise points distributed at intervals, and were similar in shape to the cracks. The residual area of the permeate was a fluorescent green display with unstable morphology; however, its gray value was lower than that at the crack. Table 1 presents the gray value and morphological features of the five regional images. Based on the above analysis, we suppressed and removed certain amount of interference through certain image preprocessing methods, and the remaining areas that cannot be removed were input to convolutional neural network (CNN) for identification.
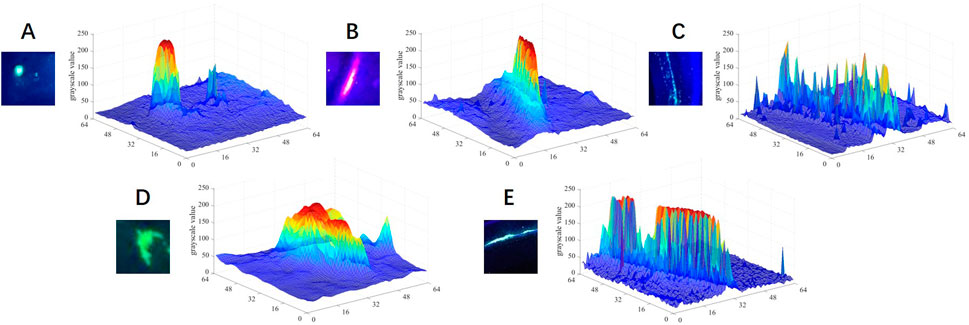
FIGURE 2. Grayscale distribution of crack and interference images (A) Grayscale distribution of dust residue (B) Grayscale distribution of ultraviolet light reflection (C) Grayscale distribution of edge disturbance (D) Grayscale distribution of permeate residue (E) Grayscale distribution of crack.
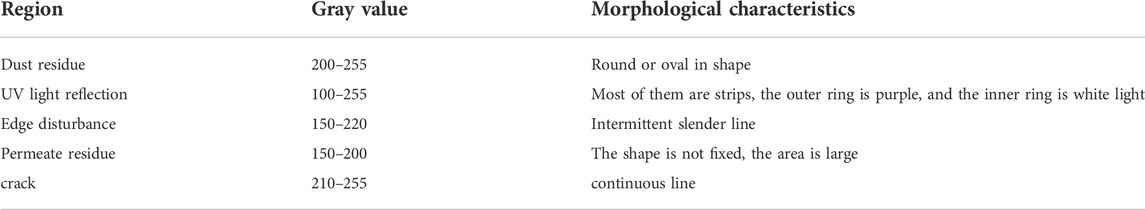
TABLE 1. Gray value and morphological characteristics of images in different regions.
This study developed a fluorescence penetration image acquisition platform comprising a camera obscura device, a purple light lamp, a Daheng industrial camera MER-1220-9GC, and a computer, as shown in Figure 3. According to the process flow of fluorescent penetrant detection, first, the steering knuckle was cleaned with water and dried. This was followed by the even application of a fluorescent penetrant on the surface of the workpiece, which was allowed to stand for a certain period of time. After the effect of the fluorescent penetrant was complete, the excess fluorescent penetrant on the surface of the workpiece was washed off with water applied at low water pressure, and finally the developer was sprayed and dried. After completing the pre-processing of the steering knuckle, it was into the darkroom and turn on the black light. Owing to the large size of the steering knuckle and uneven surfaces, a single camera cannot obtain all the information. Therefore, three industrial cameras are used to examine the steering knuckle from different angles. A total of 56 fluorescent penetrant detection images were captured and 286 images were obtained from related companies; thus, a total of 342 images were collected.
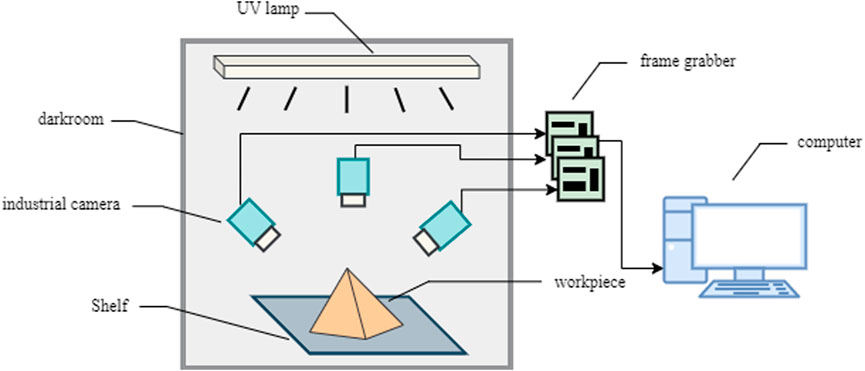
FIGURE 3. Fluorescence penetrant detection image acquisition platform.
The detection method is divided into two stages: crack candidate region acquisition and CNN recognition, including data set enhancement, as shown in Figure 4. In the first stage, the interference display in the image is suppressed, and the crack candidate region is extracted by threshold segmentation to realize the rough location of the crack. At the same time, the interference display and crack display in the image are intercepted as the training set and enhanced. In the second stage, the candidate regions are patched into 224 × 224 images, and the CNN model trained by the training set after data enhancement is input for identification, so as to further determine whether there are cracks and defects in the candidate regions.
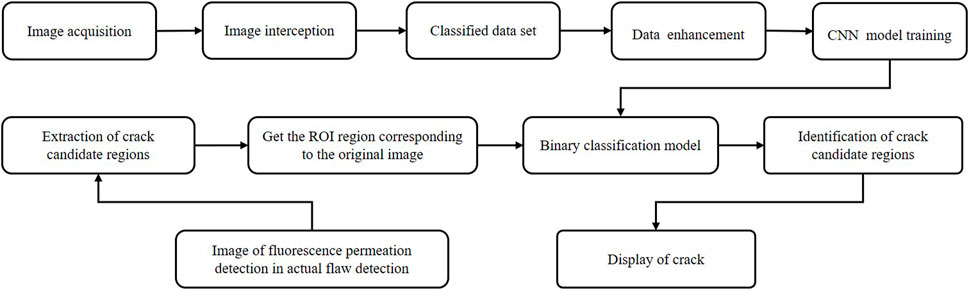
FIGURE 4. Our method flow chart diagram.
To extract the crack candidate regions and input them into CNN identification, the acquired images must be preprocessed. Based on the feature analysis of the image, the obtained original image was converted into a grayscale image and a median filter was used. The median filter can effectively suppress the intermittent interference points on the edge of the workpiece and certain small noise points in the fluorescence penetrant inspection image, as shown in Figure 5C. As the gray value at the crack was significantly higher than the image background, a global threshold segmentation was performed on the image. Only cracks, ultraviolet light reflections, and certain dust interference areas remained in the segmented image, and certain small noise points and areas with low gray values in the image were removed, as shown in Figure 5D. The finally extracted connected domain corresponded to the window input CNN recognition in the original image.
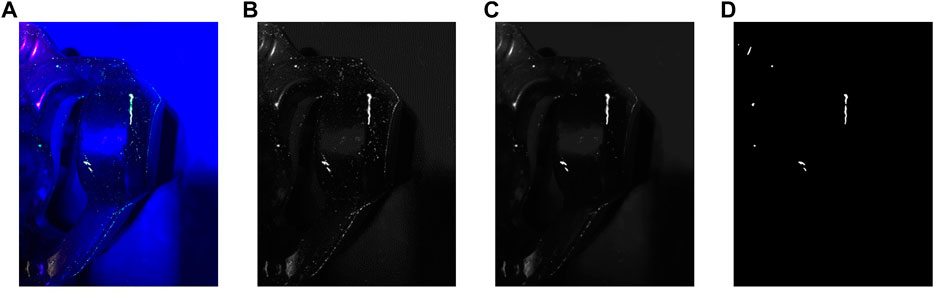
FIGURE 5. Fluorescence penetrant detection image preprocessing (A) The original image (B) The image after gray-scale (C) Median filtered image (D) The image after global threshold segmentation.
Data augmentation methods can be divided into two categories based on the method of generating new samples: non-generative data augmentation methods and generative data augmentation methods. Non-generative data enhancement methods mainly include geometric transformation, color gamut transformation, noise injection, random erasing [31], etc. These methods can simulate the position, illumination change, and noise interference in the real situation to a certain extent. The diversity of the dataset, but not total exploitation of the intrinsic characteristics of the original samples, leads to certain limitations of the trained model. In this study, non-generative methods such as random cropping and flipping were used to expand the samples to compare the effect of DCGAN data enhancement.
DCGAN is a combination of convolutional neural network (CNN) and GAN, which improves the quality of generated images and the speed of model convergence. Similar to GAN, DCGAN includes a generator G (Generator) and a discriminator D (Discriminator). Figure 6 shows the DCGAN network structure used in this study. The generator G initially receives a random noise, and then learns the data distribution of the real image to generate a fake image. Thereafter, the discriminator D determined whether the input image is a real image and then achieves the best state through continuous learning. Thus, it checks if the quality of the generated image is sufficiently high such that the discriminator G cannot distinguish whether it is a real or fake image.
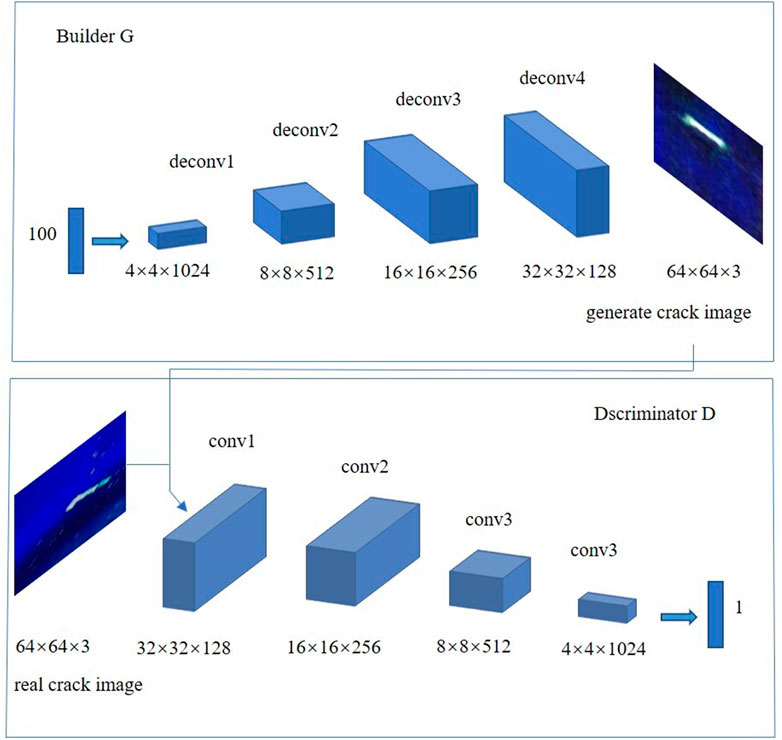
FIGURE 6. DCGAN crack generation network structure.
The network structure of generator G has a total of five layers, including four layers of deconvolution layers and one layer of fully connected layers. The input was a 100-dimensional random noise that was uniformly distributed. First, a fully connected layer realized the linear transformation of the noise, and then reshaped it into a 4 × 4 × 1,024 three-dimensional matrix. After four layers, the kernel size was 4 × 4, and the step size was 4 × 4. A deconvolution layer of two yields a 64 × 64×3 image. Compared with the GAN network, DCGAN replaces the pooling layer with deconvolution of the corresponding stride. Further, it uses batch normalization Batchnorm (BN layer) at each layer except the output layer to normalize the input of each unit to improve learning stability. Thereafter, the output and other layers uses Tanh and ReLu as the activation functions, respectively, to make the model learn faster to saturate and cover the color space of the training distribution.
The network structure of the discriminator D is similar to the convolutional neural network, and the input is the generated fake crack image. After the fully connected layer, a probability of judging the authenticity of the crack image is obtained. Similar to that in the generator, batch normalization operations are used in the discriminator. In addition, the last layer of the discriminator uses the sigmoid function, and the other layers use the LeakyReLU function to prevent the gradient from disappearing.
The loss function of the DCGAN network parameter update process is expressed as follows:
where
Among the 342 collected images, 200 of them were gridded and the crack areas were selected with a size of 64 × 64 pixels which formed 281 crack area samples. 190 of the 281 samples were used for image generation and CNN model training. The remaining 91 test sets were used for CNN model training. The remaining 142 of the 342 collected images served as the final test for the crack identification algorithm.
The training parameters were set as follows: Batch Size of 32, learning rate set to 0.0002, and the number of training iterations as 1,000; in addition, the Adam optimizer was used.
We selected four generated pictures under different epochs. It is evident that with the increase of the number of training epochs, the quality of the generated cracks continuously increased, as shown in Figure 7. In the first few epochs, the model generated similar noise of the sample. At 150 epochs, the gridding degree of the image disappeared. Further, at 300 epochs, the outline of the crack was observed, and at 500 epochs, the crack was formed with low image clarity. Finally, the crack image generated at 600 epochs was found to be very realistic.The original and the generated crack images were both similar and different. The crack outline, size, background, etc. experienced large or minimal changes. Moreover, the generated image exhibited an independent and identical distribution relationship with the original image, such that the generated crack image was considered suitable as a sample for training the classification network.
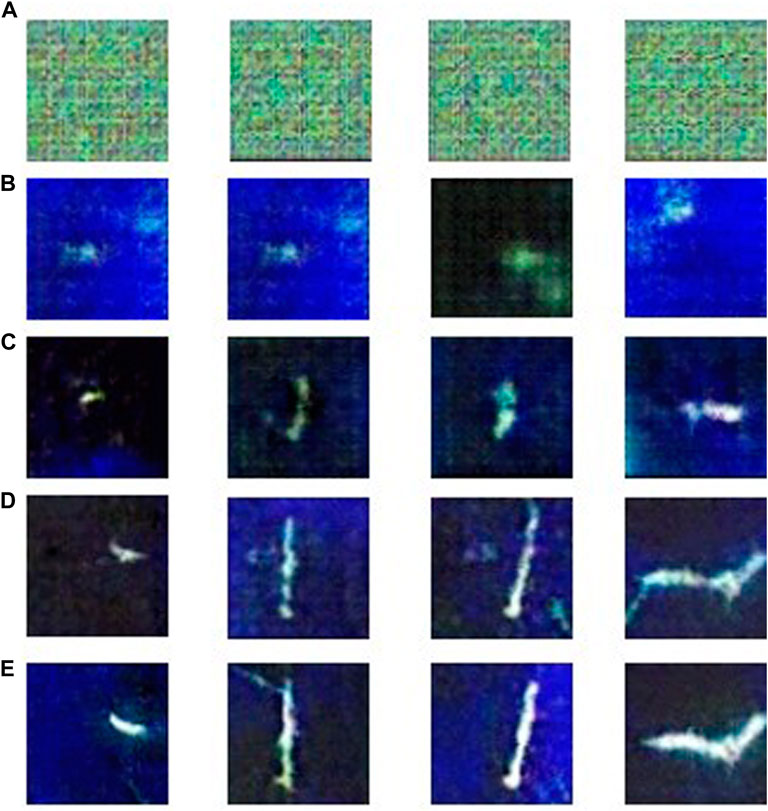
FIGURE 7. Crack images generated by DCGAN under different epochs (A) 0 epochs (B) 150 epochs (C) 300 epochs (D) 500 epochs (E) 600 epochs.
After many experiments, it was found that the model collapsed after 1,000 iterations, and the loss function oscillated greatly. This may be because of the data set being exceedingly small and the discriminator was too well trained; thus, the generator could not update the gradient. Therefore, we used crack images generated by the model in 600–1,000 epochs range to expand the dataset.
To quantify the effect of data augmentation of the DCGAN model on fluorescence infiltration images, the augmented samples were classified using CNN and compared with the unenhanced and augmented images using non-generative methods. The selected classification model was ResNet34, and the non-defect samples were the selected areas such as UV light reflection and dust residue that are difficult to remove in image preprocessing. A total of 900 images were used.
The data set distribution is shown in Table 2. The training set was used for model training, and the test set was used to verify the model training effect. To ensure the balance of positive and negative samples, the non-defective samples were randomly selected form the unenhanced data set of 190 pictures except the test set. Both non-generative enhancement and DCGAN enhancement use corresponding methods to expand the defective samples to the same number as the non-defective samples. Figure 8 shows examples of defective and non-defective samples of the DCGAN enhanced dataset, and all the non-defective samples were real pictures. The input size required by the ResNet34 network is 224 × 224 × 3. Thus, the images were uniformly resized to the corresponding size before training. The dropout during training was set to 0.25. The Adam optimizer was use with a learning rate of 0.0001 and the first-order decay index was 0.5.
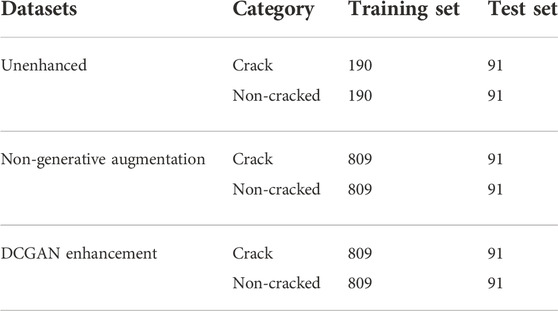
TABLE 2. Distribution of fluorescent penetrant detection datasets.
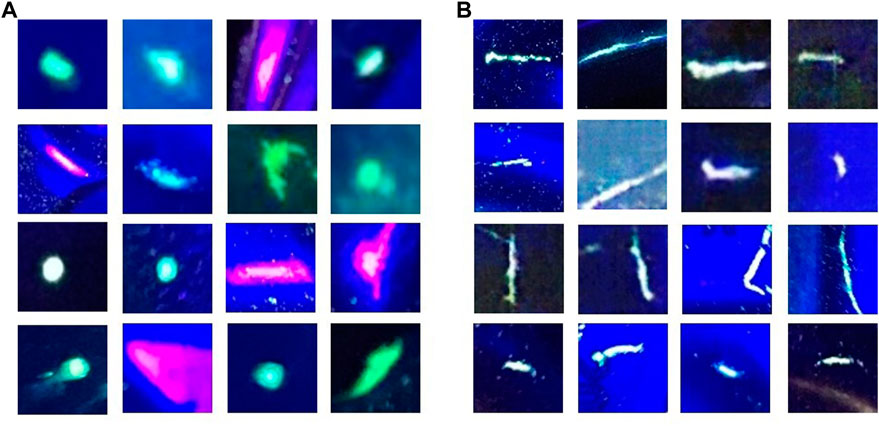
FIGURE 8. Examples of positive and negative samples of DCGAN enhanced dataset (A) Non-cracked samples (B) Crack samples.
As evident from Table 3, the training accuracy of the model using only a small number of original images was the lowest compared with the other two enhanced ones. Further, its accuracy in the test set was much lower than in the training accuracy at approximately 77%. Thus, the model exhibited a serious overfitting phenomenon, and as the defect of fluorescence penetration can be easily misjudged in practice. The training accuracy of the data set enhanced by the traditional method was the highest among the three data sets, reaching 97.3%, and its accuracy on the test set increased by approximately 24% compared with the original data set. Thus, the method alleviated the phenomenon of model overfitting caused by lack of data to a certain extent. Finally, the data set enhanced by DCGAN method proposed this study exhibited a slightly lower training accuracy than the traditional enhanced data set; however, the accuracy on the test set was 2.2% higher than that of the latter and not much different from the training accuracy. Further, it is evident that the model trained on the DCGAN-enhanced dataset exhibited better robustness and higher accuracy.
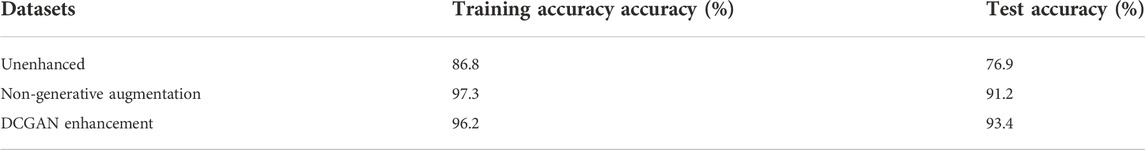
TABLE 3. Accuracy comparison of fluorescent penetration detection data sets.
Figure 9 shows the flow of the crack identification algorithm in this study. Grayscale transformation and median filtering were performed on the input image, and then the global threshold segmentation was conducted. The OpenCV library was used to obtain the external window of the candidate area obtained after image preprocessing. The image was scaled to 224 × 224 pixels, the unenhanced dataset was input, the dataset was enhanced by the non-generative method, and the Resnet was trained with the DCGAN enhanced dataset model for identification. The identification results are presented in Table 4. The recall rate and precision of the extracted crack candidate region of the Resnet model trained with DCGAN enhanced data are higher than those of other models, in which the recall rate is 95.1%, which is higher than 15.4% in the case of no enhancement and 1.5% in the case of non-generative enhancement. F1 score, the comprehensive evaluation index of recall ratio and precision ratio, also has the best performance.
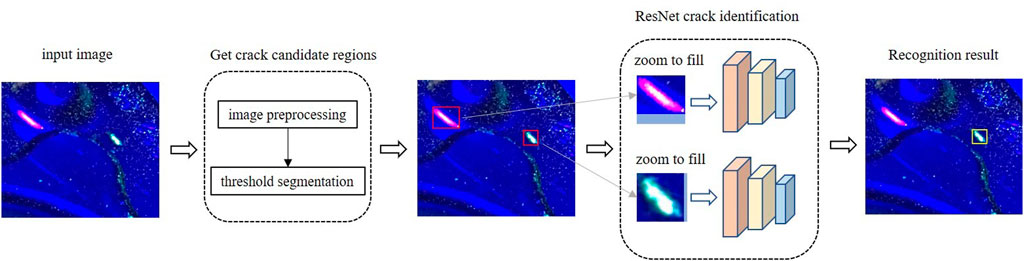
FIGURE 9. Fluorescence penetrant inspection crack identification process.
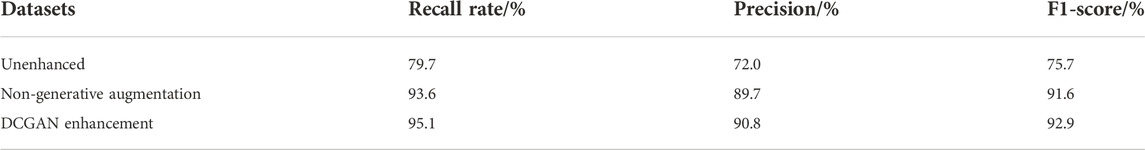
TABLE 4. Recognition effects of models trained on different datasets.
In addition, the methods proposed in this study was compared with the traditional machine vision method; that is, the recognition effect based on the shape feature of the connected domain and the support vector machine, based on the Hu invariant moment and BP neural network algorithm. The results are presented in Table 5. The recognition effect is shown in Figure 10.
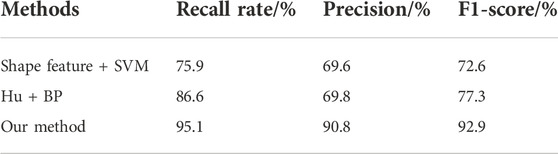
TABLE 5. Test results of different Methods.
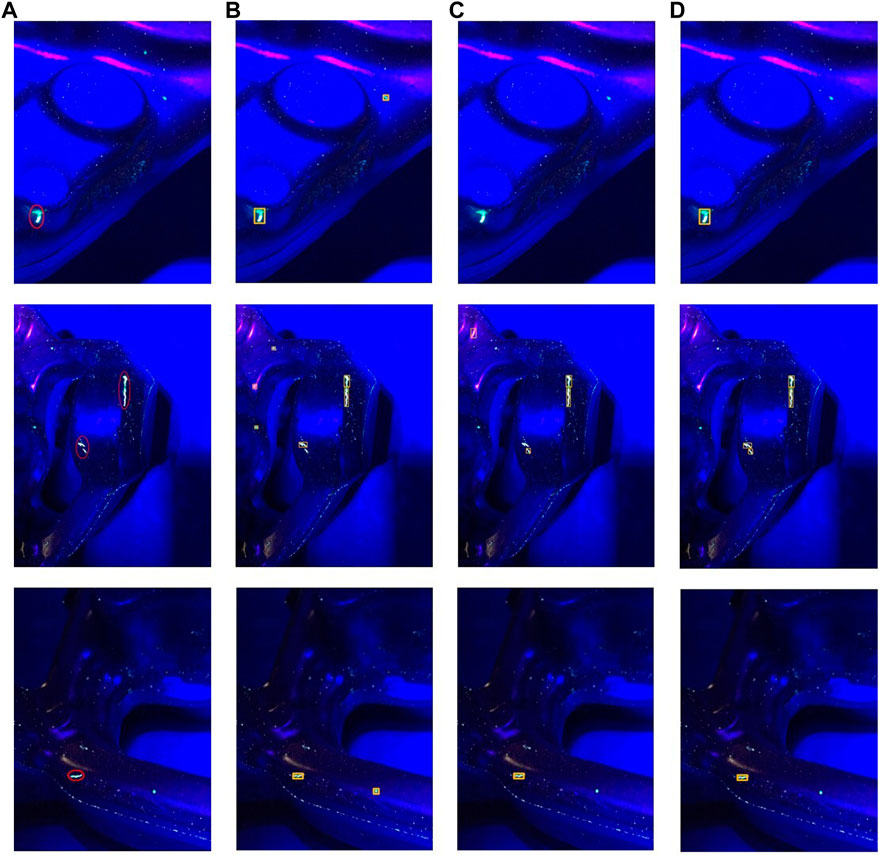
FIGURE 10. Detection results using three methods (A) Original image (B) The method based on Hu moment invariant feature and BP (C) The method based on shape features and SVM (D) Our method.
As evident from Table 5 and Figure 10, compared with the other two methods of crack identification, the proposed methods can more accurately locate the cracks in the steering knuckle fluorescent penetrant inspection picture and eliminate false display, UV lamp reflection, and other interference, while exhibiting higher performance. Furthermore, the recall and precision rates of fluorescence penetration testing provided a more meaningful reference for the automation of fluorescent penetrant detection.
This study proposed a crack recognition method combining image processing and DCGAN data enhancement to solve the problem of few crack image samples and unbalanced categories in the process of fluorescence penetration detection of automobile steering knuckles. The main methodology involved building an image acquisition platform, analyzing the characteristics of fluorescent penetrant inspection images, preprocessing the images to suppress relevant interference and segmenting candidate regions of cracks, and using a small number of original crack images to generate a several high-quality fake crack images for recognition tasks. Compared with unenhanced and traditional data enhancement methods, the DCGAN-based data enhancement method exhibited higher accuracy on the test set, which can effectively improve the effect of small sample learning. The recognition results of the extracted candidate regions show that the crack recognition algorithm proposed in this paper reached 92.9%, which is higher than other traditional machine vision methods for manually extracting image features. However, when our method is applied to the actual detection, the real-time performance and accuracy still need to be improved, which is also the focus of our future research work.
The raw data supporting the conclusion of this article will be made available by the authors, without undue reservation.
Investigation, LL; methodology, YY; software, ZM; validation, JZ and BH; writing—original draft, ZM; writing—review and editing, YY All authors have read and agreed to the published version of the manuscript.
This research was funded by the Fundamental Research Funds for the Central Universities (No. 2232022D-20) and the National Natural Science Foundation of China (NNSFC) (No. 51807022)
The authors declare that the research was conducted in the absence of any commercial or financial relationships that could be construed as a potential conflict of interest.
All claims expressed in this article are solely those of the authors and do not necessarily represent those of their affiliated organizations, or those of the publisher, the editors and the reviewers. Any product that may be evaluated in this article, or claim that may be made by its manufacturer, is not guaranteed or endorsed by the publisher.
1. Wang J. Research on the typical application of non-destructive testing technology in automobile manufacturing. Heilongjiang Sci (2017) 8(18):46. doi:10.3969/j.issn.1674-8646.2017.18.020
2. Wang R, Zhang G, Xue S. Automatic detection system for permeable fluorescence defects based on machine vision. J Meas Test Technol (2021) 48(09):35–8. doi:10.15988/j.carolcarrollnki
3. Tang J, Wang D, Tian J, Yuan M. Defect recognition for fluorescent penetrant inspection of turbine blade image based on machine learning China Computer & Communication (2022) 34: 90–93. doi:10.3969/j.issn.1003-9767.2022.10.026
4. Shipway NJ, Barden TJ, Huthwaite P, Lowe MJ. Automated defect detection for fluorescent penetrant inspection using random forest. NDT E Int (2019) 101:113–23. doi:10.1016/j.ndteint.2018.10.008
5. Zheng J, Xie WF, Viens M, Birglen L, Mantegh I. Design of an advanced automatic inspection system for aircraft parts based on fluorescent penetrant inspection analysis. Insight (2015) 57:18–34. doi:10.1784/INSI.2014.57.1.18
6. Zhang J, Jing J, Lu P, Song S. Improved MobileNetV2-SSDLite for automatic fabric defect detection system based on cloud-edge computing. Measurement (2022) 201:111665. doi:10.1016/j.measurement.2022.111665
7. Chen C, Chandra S, Han Y, Seo H. Deep learning-based thermal image analysis for pavement defect detection and classification considering complex pavement conditions. Remote Sensing (2021) 14:106. doi:10.3390/rs14010106
8. Zhang Y, Wa S, Sun P, Wang Y. Pear defect detection method based on ResNet and DCGAN. Information (2021) 12(10):397. doi:10.3390/info12100397
9. Chen SH, Kang CH, Perng DB. Detecting and measuring defects in wafer die using gan and yolov3. Appl Sci (2020) 10(23):8725. doi:10.3390/APP10238725
10. Yun JP, Shin WC, Koo G, Kim MS, Lee C, Lee SJ. Automated defect inspection system for metal surfaces based on deep learning and data augmentation. J Manufacturing Syst (2020) 55:317–24. doi:10.1016/j.jmsy.2020.03.009
11. Liu H, Wang Y, He H, Sun C. Classification of bearing raceway surface processing defects based on improved ResNet model. Bearing (2021) 7:52–8. doi:10.19533/j.issn1000-3762.2021.07.011
12. Wang H, Gao M, Hu S, Sun Z, Xu Z. Study on weather radar echo data generation based on DCGAN. IEEE Access (2019) 7:131978–85. doi:10.1109/ACCESS.2019.2940561
13. Goodfellow I, Pouget-Abadie J, Mirza M, Xu B, Warde-Farley D, Ozair S, et al. Generative adversarial networks. Commun ACM (2020) 63:139–44. doi:10.1145/3422622
14. Zhang G, Wang F, Duan W. Study on Star-Galaxy image generation method based on GAN. 西北工业大学学报 (2019) 37(02):315–22. doi:10.1051/jnwpu/20193720315
15. Wu Q, Chen Y, Meng J. DCGAN-based data augmentation for tomato leaf disease identification. IEEE Access (2020) 8:98716–28. doi:10.1109/access.2020.2997001
16. Dai Z, Li J, Zhang X, Xu X, Mei L, Zhang L. Super resolution reconstruction of MRL based on DCGAN. Comput Sci (2022) 49(07):113–9. doi:10.11896/jsjkx.210600105
17. Zhao M, Wei Y, Wong KK. A generative adversarial network technique for high-quality super-resolution reconstruction of cardiac magnetic resonance images. Magn Reson Imaging (2022) 85:153–60. doi:10.1016/J.MRI.2021.10.033
18. Jiang M, Zhi M, Wei L, Yang X, Zhang J, Li Y, et al. FA-GAN: Fused attentive generative adversarial networks for MRI image super-resolution. Comput Med Imaging Graphics (2021) 92:101969. doi:10.1016/j.compmedimag.2021.101969
19. Pei L, Sun C, Sun J, Li W, Zhang H. Generation method of pavement crack images based on deep convolutional generative adversarial networks. J Cent South University(Science Technol (2021) 52(11):3899–906. doi:10.11817/j.issn.1672-7207.2021.11.012
20. Li J, Yin Z, Le X. Surface defect detection for steel plate with small dataset. Aerospace Sci Technol (2021) 32(06):65–70. doi:10.19452/j.issn1007-5453.2021.06.009
21. Wang Y, Luo S, Wu H. Defect detection of solar cell based on data augmentation. J Phys : Conf Ser (2021) 1952:022010. doi:10.1088/1742-6596/1952/2/022010
22. Dewi C, Chen RC, Liu YT, Tai SK. Synthetic Data generation using DCGAN for improved traffic sign recognition. Neural Comput Appl (2021) 34:21465–80. doi:10.1007/s00521-021-05982-z
23. Hartanto CA, Kurniawan S, Arianto D, Arymurthy AM. Dcgan-generated synthetic images effect on white blood cell classification. IOP Conf Ser : Mater Sci Eng (2021) 1077(1):012033. doi:10.1088/1757-899X/1077/1/012033
24. Yu M, Cai L, Gao L, Gao J. Amplification method of lung nodule data based on DCGAN generation algorithm. In: International Conference of Pioneering Computer Scientists, Engineers and Educators (2020). p. 563–76. doi:10.26914/c.cnkihy.2020.030363
25. Li M, Tang H, Chan MD, Zhou X, Qian X. DC-AL gan: Pseudoprogression and true tumor progression of glioblastoma multiform image classification based on DCGAN and AlexNet. Med Phys (2020) 47(3):1139–50. doi:10.1002/mp.14003
26. Song J, Li P, Fang Q, Xia H, Guo R. Data augmentation by an additional self-supervised CycleGAN-based for shadowed pavement detection. Sustainability (2022) 14(21):14304. doi:10.3390/SU142114304
27. Tian Y, Chen Y, Diming W, Shao Y, Wan M, Chao W, et al. Augmentation Method for anti-vibration hammer on power transimission line based on CycleGAN. Int J Image Data Fusion (2022) 13:362–81. doi:10.1080/19479832.2022.2033855
28. Zhang L, Duan L, Hong X, LiuZhang XX. Imbalanced data enhancement method based on improved DCGAN and its application. J Intell Fuzzy Syst (2021) 41:3485–98. doi:10.3233/JIFS-210843
29. Mu J, Tan Y, Xie D, Zhang F, Jing X. CNN and DCGAN for spectrum sensors over Rayleigh fading channel. Wireless Communications and Mobile Computing (2021). doi:10.1155/2021/9970600
30. Wang W. Defect detection capabilities of penetrant testing and its influencing factors. Nondestructive Test (2020) 42(12):48–51. doi:10.11973/wsjc202012011
Keywords: automobile steering knuckle, fluorescence penetrant inspection, data enhancement, DCGAN, crack identification
Citation: Yang Y, Min Z, Zuo J, Han B and Li L (2022) Crack identification of automobile steering knuckle fluorescent penetrant inspection based on deep convolutional generative adversarial networks data enhancement. Front. Phys. 10:1081805. doi: 10.3389/fphy.2022.1081805
Received: 27 October 2022; Accepted: 25 November 2022;
Published: 13 December 2022.
Edited by:
Bo Feng, Huazhong University of Science and Technology, ChinaCopyright © 2022 Yang, Min, Zuo, Han and Li. This is an open-access article distributed under the terms of the Creative Commons Attribution License (CC BY). The use, distribution or reproduction in other forums is permitted, provided the original author(s) and the copyright owner(s) are credited and that the original publication in this journal is cited, in accordance with accepted academic practice. No use, distribution or reproduction is permitted which does not comply with these terms.
*Correspondence: Zhou Min, MjIxMTA1MEBtYWlsLmRodS5lZHUuY24=
Disclaimer: All claims expressed in this article are solely those of the authors and do not necessarily represent those of their affiliated organizations, or those of the publisher, the editors and the reviewers. Any product that may be evaluated in this article or claim that may be made by its manufacturer is not guaranteed or endorsed by the publisher.
Research integrity at Frontiers
Learn more about the work of our research integrity team to safeguard the quality of each article we publish.