- 1Postgraduate Department, China Academy of Railway Sciences, Beijing, China
- 2Institute of Computing Technology, China Academy of Railway Sciences Corporation Limited, Beijing, China
- 3School of Automation and Software Engineering, Shanxi University, Taiyuan, China
- 4School of Mathematical Sciences, Shanxi University, Taiyuan, China
The equipment in railway station is complicated and diverse, and the health status assessment and prediction of equipment is crucial to the safe and stable operation of stations. Graph Neural Networks (GNNs) effectively combine graph data with deep learning technology, which has stronger data and knowledge representation capability and can efficiently handle some non-Euclidean spatial data problems with irregular station equipment associated network structure. Based on this, this paper takes the automatic gate machine and X-ray security checker as an example and proposes a health status assessment and prediction scheme for railway passenger station equipment based on Graph Long Short-Term Memory (G-LSTM) neural network. This paper first analyzes the main factors affecting the health status of passenger station equipment, as well as the correlation between the equipment. Then, the initial graph network structure of the passenger station equipment is constructed, and the G-LSTM model is used to evaluate and predict the health status of the passenger station equipment. Finally, this paper takes the automatic gate machine and X-ray security checker of a high-speed railway station in Beijing as an example to verify the proposed method. The experimental results show that all evaluation metrics perform well, indicating that the G-LSTM model has high accuracy in assessing and predicting the health status of automatic gate machine and X-ray security checker. This paper realizes the health status assessment and prediction of railway passenger station equipment, which can provide some reference for the Prognostics and Health Management (PHM) of equipment in railway stations.
1 Introduction
In recent years, with the rapid improvement of China’s high-speed railway intelligence level, the dependence of railway passenger station transportation production and passenger transportation organization on equipment and facilities has been increasing, and railway passenger station equipment has gradually shown the characteristics of diversification, complexity, integration and intelligence, etc. The safe and stable operation of passenger station equipment has become an important guarantee for the safety of passenger station operation and the improvement of passenger service quality. Therefore, it is important to fuse and analyze the status information of railway passenger station equipment, access the health status, gain insight into and predict system failures, and then avoid risks.
For the problem of equipment health assessment and prediction, some experts and scholars have conducted in-depth studies using traditional machine learning methods, such as dynamic Bayesian networks [1, 2], support vector machine regression [3–5], hidden Markov models [6–9], pattern recognition [10], fuzzy sets and rough sets [11–13], and so on. In-depth understanding of the mechanism of equipment health status for different application environments can effectively build a relational model through the health indicators of equipment performance degradation to achieve the evaluation and prediction of equipment health status. In recent years, with the rapid development of the information age, the various types of monitoring and state operation information formed by diverse-complex-intelligent equipment in long-term service present typical big data characteristics with time-series characteristics. Based on this, many experts and scholars have carried out research related to equipment health management with the powerful modeling and data processing capabilities of deep learning, and it has been widely used in many fields. For Prognostics and Health Management (PHM) of equipment, a center task is to predict the Remaining Useful Life (RUL). Yang et al. [14] proposed a double-CNN framework for intelligent RUL prediction. The method takes the original vibration signals as input, which can solve the feature extraction problem while preserving the operational information. Peng et al. [15] proposed a Bayesian Deep-Learning-based (BDL-based) method for health prognostics with uncertainty quantification. The paper extended the existing deep learning models to Bayesian Neural Networks (BNNs) and proposed a BNNs learning and inference method based on variational inference. Chen et al. [16] proposed an attention-based deep learning framework for machine’s RUL prediction. In addition, a feature fusion framework was developed to combine handcrafted features with automatically learned features to improve the performance of the RUL prediction. Ma et al. [17] proposed a new extension of Long Short-Term Memory (LSTM) network with convolutional operation integrated, named CLSTM, and used it for ball bearing RUL prediction, which is crucial to PHM of various rotating machines. A pure data-driven method for bearing RUL prediction with little prior knowledge was proposed in [18]. In this method, a recurrent neural network based on encoder-decoder framework with attention mechanism was proposed to predict Health Indicate (HI) values that are closely related to RUL values. Ren et al. [19] transformed feature values into feature maps as the input of deep convolutional neural networks to effectively predict the RUL of bearings. Li et al. [20] constructed hierarchical gated recurrent networks by stacking multiple hidden layers to capture nonlinear features and evaluate the health condition to achieve health prediction of rolling bearings. Chen [21] addressed the core problem of fault prediction and health management of equipment systems under complex operating conditions, and combined LSTM networks to investigate in depth the data-driven health condition assessment modeling method and RUL prediction method. Zhang et al [22] used a Long Short-Term Memory-Recurrent Neural Network (LSTM-RNN) to synthesize a data-driven RUL predictor, and the constructed LSTM-RNN can be used for offline data training to predict the battery RUL. Costa et al. [23] proposed a deep learning method for domain adaptation in prognostics based on a Long Short-Term Memory Neural Network and a Domain Adversarial Neural Network (LSTM-DANN). The proposed method provides a promising approach to performing domain adaptation in practical PHM applications. For multiple sensors data environments, Shi et al. [24] proposed a Dual-LSTM framework for degradation analysis and RUL prediction using LSTM. A novel sensor data-driven RUL prediction method was introduced in [25] by using a Deep Long Short-Term Memory (DLSTM) network-based model. The method integrates multiple sensory signals by using the DLSTM to achieve more accurate and robust predictions. She et al. [26] proposed a Bidirectional Gated Recurrent Unit (BiGRU) RUL prediction method based on bootstrap method, and obtained the confidence interval of RUL by bootstrap method. Since traditional RUL prediction methods are not effective in complex systems with multiple components, multiple states and a large number of parameters, Chen et al. [27] first used Kernel Principal Component Analysis (KPCA) for nonlinear feature extraction; then, Gated Recurrent Unit (GRU) was used to predict RUL.
Traditional neural networks have obvious advantages in dealing with regular structured Euclidean spatial data, but are slightly inadequate in dealing with some non-Euclidean spatial data with irregular association network structure. Graph Neural Networks (GNNs) effectively combine graph data with deep learning technology, which has stronger data and knowledge representation capability and can efficiently solve the problem of assessing and predicting the health status of railway passenger station equipment, however, there are few related studies. Therefore, this paper proposes a Graph Long Short-Term Memory (G-LSTM) method for evaluating and predicting the health status of railway passenger station equipment, taking the automatic gate machine and X-ray security checker (hereinafter referred to as “gate” and “security checker”) as an example. Firstly, we analyze the factors influencing the health status of railway passenger station equipment and the association rules between equipment. Then, the initial graph structure of passenger station equipment is constructed based on the equipment association relationship, and the health status of passenger station equipment is evaluated and predicted by using graph neural network model. Finally, we realize the health monitoring management of passenger station equipment operation status.
2 Preliminary
2.1 Graph neural networks
A graph is a data structure that models a set of objects (nodes) and their relationships (edges). In recent years, research on analyzing graphs with machine learning has received increasing attention due to their powerful expressive power, and a large number of studies and applications have been carried out in several fields, such as social networks, recommender systems, protein-protein interaction networks, knowledge graphs, causal inference, etc. GNNs are deep learning-based methods that operate on the graph domain [28] and focus on tasks such as analyzing node (graph) classification, node (graph) regression, link prediction, node state prediction, node clustering, graph partitioning, and graph visualization. The standard design flow of GNN models is shown in Figure 1.
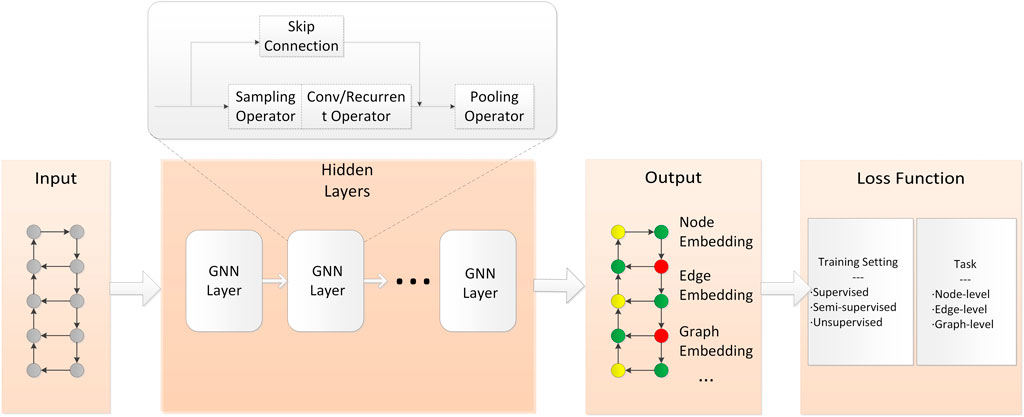
FIGURE 1. Standard design flow of GNN models [28].
GNNs are usually classified into Graph Convolution Neural Network (GCNN), Graph Recurrent Neural Network (GRNN), Graph Attention Network (GAT), Graph Auto Encoder (GAE), Graph Generative Network (GGN), Graph Spatial-Temporal Network (GSTN), etc. [29]. In addition, based on the above basic graph neural networks, numerous variants of graph neural networks have been derived, such as Adaptive Graph Convolutional Neural Network (AGCNN) [30], Graph Long Short-Term Memory Network (Graph LSTM) [31], Gated Graph Neural Network (GGNN) [32], etc.
For the problem studied in this paper, the main advantages of GNNs compared to traditional deep learning algorithms are as follows.
2.1.1 Broader application scenarios
Traditional deep learning toolbox is designed for regular Euclidean data like sequences and grids with translation invariance, while GNNs are mainly applied to graph data in non-Euclidean space with extremely irregular structure, and graph data no longer satisfy translation invariance. In the real world, graph data are prevalent. Railway passenger stations have diverse equipment and complex relationships with each other, which are more appropriately described using graph data. However, traditional deep learning algorithms perform much less well on graph data than GNNs.
2.1.2 Efficient utilization of structural features
Compared with traditional deep learning models, GNNs are more universal in information mining and data modeling because graph data contain richer information. Graph data consist of a series of nodes and edges. The nodes are connected by edges, which can effectively and fully express the information such as dependencies between nodes, thus maximizing the structural features of realistic graphs. In the railway passenger station environment, various types of equipment can be regarded as nodes. Through GNNs, we can better characterize the correlations between devices, explore the potential connections between them, and enhance the understanding of knowledge.
2.1.3 Reasoning and cognitive ability
GNNs can effectively handle various relationships and generate reasoning graphs from various unstructured data, which is expected to help improve the performance of various knowledge reasoning tasks and solve a series of problems such as relational reasoning that cannot be handled by traditional deep learning methods. The application of GNNs to railway passenger station environment is a positive attempt to promote “railway passenger station intellectualization.” To be sure, it needs more extensive and in-depth research by subsequent scholars to realize the real intelligent equipment that can reason and think.
GNNs also have many application scenarios in railway passenger station operation management, such as GCNN-based cross-video personnel tracking, GCNN-based face and voice emotion recognition, knowledge inference-based equipment fault assessment and prediction, GNN-based equipment knowledge graph representation, GNN-based passenger information advisory recommendation system, etc.
2.2 Long short-term memory neural network
LSTM neural network [33] is an improvement of the traditional Recurrent Neural Networks (RNNs), which is effective in processing time series data, it can preserve the information so that it can be used later, solve the gradient disappearance problem, realize the memory of historical states, and has better performance in time series prediction, thus LSTM neural networks are widely used in many fields.
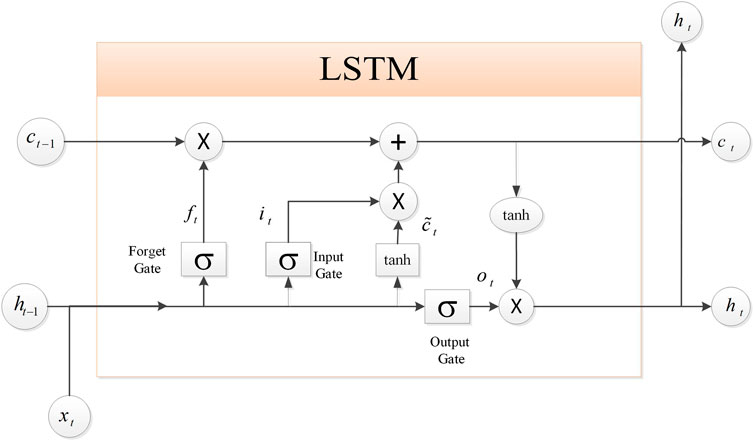
The LSTM is basically the same as the RNN, but the difference is that the LSTM has a relatively more refined processing unit inside the LSTM, which can effectively store important information, discard unnecessary information, and update the information at each time step. The schematic diagram of the LSTM unit structure is shown in Figure 2, in which there is a memory unit to store historical information, corresponding to the neurons in the hidden layer of the original RNN. Furthermore, it includes forget gate, input gate and output gate for updating the information.
As shown in Figure 2, the specific definitions of each part in the LSTM cell are given as follows.
where,
Then, the reverse transmission of the error term along time is given by
where,
According to the definitions of
According to the above equations, the equation for passing the error term forward to any
The weight gradient is calculated with the following equations.
The weights are updated with the following equation.
where,
2.3 Graph structure representation
In order to ensure the safe and stable operation of railway passenger station environment, this paper mainly evaluates and predicts the health status of railway passenger station equipment based on the graph structure method.
In the structural representation of the equipment graph, the equipment related to the passenger station is considered as nodes, and the connections or potential relationships between equipment and equipment are used as connected edges. The graph
The healthy operation data of railway passenger station equipment shows obvious time-series characteristics with the changes of each influencing factor. To address this problem, this paper proposes a G-LSTM neural network-based method for assessing and predicting the health status of railway passenger station equipment, focusing on two types of associated equipment (gates and security checkers) to carry out related research.
3 A G-LSTM based method for assessing the health status of railway station equipment
3.1 Factors influencing the health status of equipment
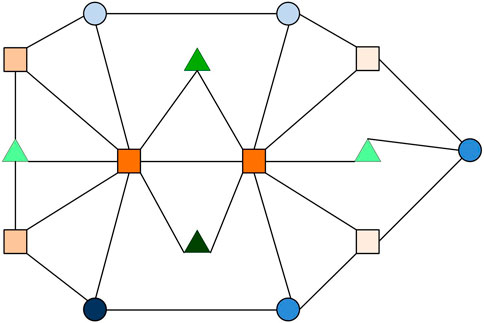
In the railway passenger station environment, there are many different equipment. In addition to the above-mentioned gates and security checkers, other common railway passenger station equipment includes: ticket vending machine, archway metal detector, train information display, monitoring system, voice broadcasting system, escalator or elevator, etc. With the global coronavirus (COVID-19) pandemic, many railway passenger stations have also placed infrared thermal imaging thermometers at their entrances. A variety of equipment forms a very complex association graph. On the one hand, all passengers have to check their tickets and undergo rigorous security checks when entering the station. As a vital part of the station automation system, gates and security checkers play a key role as “gatekeepers.” For this reason, compared to other equipment, gates and security checkers are subjected to greater passenger pressure and are more likely to be damaged, so the assessment and prediction of their health status is of great significance. On the other hand, there are clear correlations between gates and gates, between gates and security checkers, and between security checkers and security checkers (Figure 4). This scenario is well suited to be described using graph data. In conclusion, the subsequent parts of the paper will take gates and security checkers as an example to build the model, and then access and predict their health status. It is worth noting that the health status prediction method proposed in this paper is not only applicable to gates and security checkers, but can also be extended to other railway passenger station equipment.
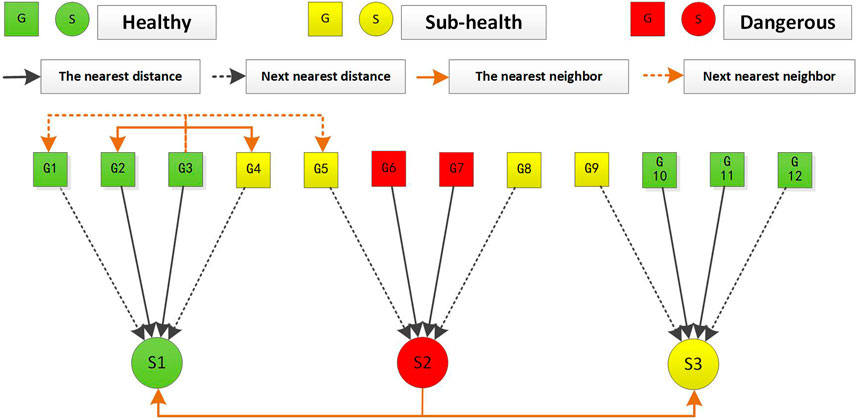
FIGURE 4. The association structure of gates and security checkers in railway passenger station. (G, Gates; S, Security Checkers).
There are many factors affecting the health status of gates and security checkers in railway passenger station, which are usually divided into human factors and inherent factors. Human factors refer to the wrong operation of equipment management personnel, operating irregularities and other operational misconduct; inherent factors mainly include rated life, production time, frequency of use/running time, maintenance, troubleshooting, etc. This paper will focus on the frequency of use/running time, maintenance, production time and other inherent factors on the health status of the equipment to analyze and study.
3.2 Equipment health status correlation modeling based on frequency of use/running time
The association structure of gates and security checkers in railway passenger stations is shown in Figure 4, where the square nodes represent the gate devices and the circular nodes represent the security checkers. When passengers pass through the gates and security checkers, they follow the nearest distance principle, that is, passengers choose the nearest neighboring equipment to pass; when the gates and security checkers have too much traffic or are closed, the nearest neighbor traffic distribution and the next nearest neighbor traffic distribution scheme is adopted to distribute the flow of people to other equipment of the same type.
In the normal operation of the equipment, as the frequency of use of the gate and the running time of the security checker have a greater relationship with the flow of passengers through the equipment, this paper analyzes the impact of frequency of use and running time on the health status of the equipment by the flow of passengers. Among them, the gate can directly express its frequency of use by the passenger flow data, and evaluate the status of the equipment; the health status of the security checker is mainly related to its running time, which can convert the passenger flow into its running time, and then realize the evaluation and prediction of the equipment status.
According to Figure 4, it can be seen that there is a spatio-temporal uniformity between the gates and the security checkers. Since the health status of the two types of equipment is closely related to the passenger flow, the passenger flow data of each security checker can be deduced from the passenger flow data passing through each gate. According to the passenger flow rules, it is known that: assuming that each security checker is associated with four gates, the passenger flow of the security checker can be obtained from the number of passengers passing through its neighboring gates, defined as:
where,
By using the daily passenger flow data of each security checker, the running time of each security checker per day can be predicted. Assuming that the daily passenger flow through a certain security checker is the highest, and setting the running time of that security checker to
where,
3.3 Equipment health status correlation modeling based on maintenance and production time
Equipment in railway passenger stations is usually maintained using regular schedules, and experience-based management methods such as regular maintenance and preventive maintenance have an impact on the safe operation and O&M (Operation and Maintenance) costs of the equipment. In addition, the difference in equipment brands and production time also has an impact on the health status of the equipment.
Maintenance refers to the inspection and upkeep of passenger station equipment in accordance with equipment inspection, overhaul plans and requirements. Maintenance can prevent or timely detect equipment failures, reduce the probability of equipment failures and extend the equipment life cycle. Eq. 20 is used here to express the evaluation rule of maintenance on the service life of equipment.
where,
The situation varies for equipment with different production time, when its rated service life is fixed, and will be updated by Eq. 21.
where,
3.4 Equipment health status correlation modeling based on troubleshooting
During operation, since the equipment is subject to its own quality problems, operational normality, human damage, sudden changes in the operating environment and other factors, it can result in sudden or episodic failure problems and affect the normal operation of the equipment. Therefore, the frequency of equipment troubleshooting within a certain cycle is also an important factor affecting the health status of the equipment.
The correlation function of the troubleshooting frequency on equipment health in a given cycle can be defined as follows.
where,
3.5 Comprehensive assessment model for the health status of passenger station equipment
Through the correlation modeling analysis of the above-mentioned factors on the equipment status, Eqs 18–21 are evaluated comprehensively, and the comprehensive evaluation model of the gates and the security checkers is obtained as follows.
where,
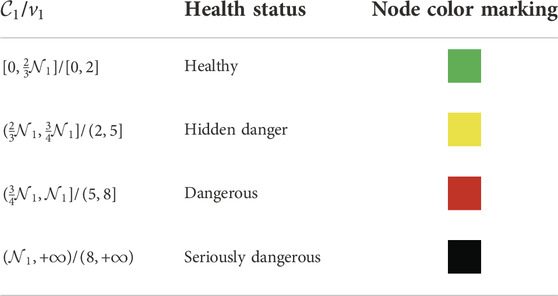
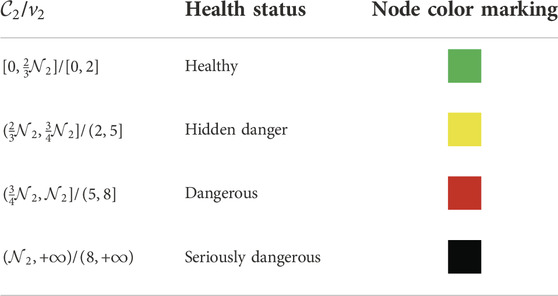
In addition, when establishing the assessment model for the health status of equipment, the influence of the troubleshooting in Eq. 22 on the equipment health status needs to be considered comprehensively. We use research and analysis to develop the health status assessment rules of the equipment, and combine the above comprehensive evaluation model to assess the health status of the gates and security checkers in two dimensions, as shown in Table 1 and Table 2. At a certain moment, when the evaluation rules of the two dimensions are inconsistent, the relatively poor evaluation result is chosen as the health status of the equipment in order to ensure the safe operation of the equipment to the greatest extent.
3.5.1 Rules for evaluating the health status of gates
The evaluation rules for the health status of the gate are shown in Table 1, where
3.5.2 Rules for evaluating the health status of security checkers
The evaluation rules for the health status of the security checker are shown in Table 2, where
Based on the comprehensive assessment model for the health status of equipment, after obtaining the time-series input of the factors influencing the operation status of equipment in passenger station, it is transformed into an information matrix, and then the LSTM neural network is used to evaluate and predict the operation status of equipment in passenger station. At the same time, the health status structure diagram of equipment in railway passenger station is updated by the above status assessment rules.
4 Experiments
4.1 Experimental data set and experimental environment
The experimental data in this paper are mainly selected from the basic biographical information of the equipment of the gates and security checkers at the entrance of a high-speed railway passenger station in Beijing, and the daily passenger flow through the gates during the period from October 2018 to December 2019. In order to reflect the diversity of experimental data, two passenger station area devices of group 1 (18 gates and 5 security checkers) and group 2 (16 gates and 4 security checkers) are selected as experimental objects, and the actual valid experimental data are about 15,300 items after processing certain missing items and abnormal items, which are divided into training set, validation set and test set according to the ratio of 6:2:2.
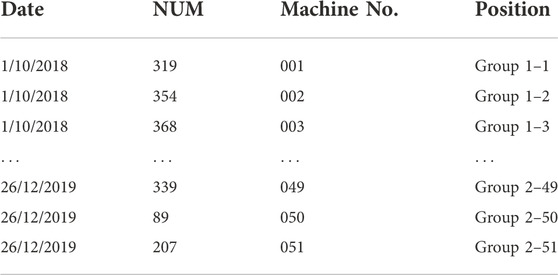
The passenger flow data set of the gates contains four columns of data: DATE, NUM, Machine No., and Position, where the NUM column is used as the input vector. In order to facilitate the neural network processing, all data are normalized before the experiment, i.e., the time series of each gate is subtracted from its mean value and divided by its standard deviation. The details are shown in Table 3.
The experimental environment in this paper is Ubuntu 20.04.4 LTS operating system, NVIDIA graphics card GTX 1650, and the software versions used are: CUDA 11.6, cuDNN 8.3, Python 3.6.13, Tensorflow 2.5.0, Keras 2.7.0.
4.2 Initial graph construction
The initial graph of the health status of equipment will be used as the initial input graph of the G-LSTM model, focusing on the evaluation and prediction of the health status of equipment at a certain moment in time. Using the previous graph structure representation method to construct the initial graph, gates and security checkers will be used as nodes, and the association relationship between the equipment will be represented by edges. Using the experimental data set, the health status of the equipment at a given moment can be obtained by correlation modeling based on influencing factors and the health status evaluation rules.
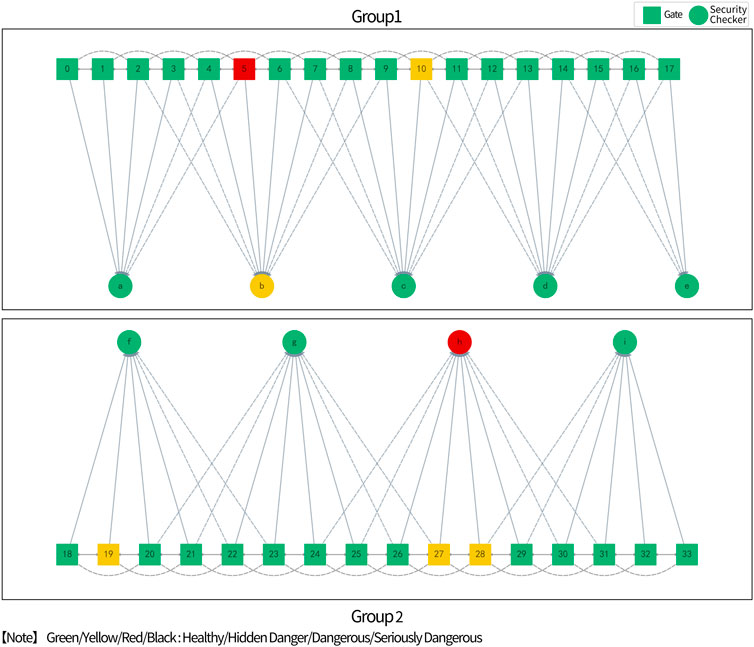
Specifically, firstly, according to the basic biographical information of equipment, a structure graph without equipment health information is constructed; Then, the experimental dataset of this paper is transformed into information on the frequency of use of gates and the running time of security checkers by the content of Section 2.2, and the above information is weighted and accumulated with the number of maintenance, brand and other influencing factors to obtain the initial comprehensive measurement data of the equipment; Next, the current health status of all equipment is obtained according to the rules for evaluating the health status of equipment; Finally, the initial graph of the health status of each equipment in the passenger station at a certain moment is plotted using Networkx, as shown in Figure 5, where the gates are labeled 0–33 and the security checkers are labeled a∼i.
4.3 Model training and testing
In this paper, we mainly use the Keras framework with TensorFlow as the back-end engine to implement the health status prediction of equipment, and the core algorithm used is LSTM. Two LSTM recurrent layers are stacked in the training network to improve the expressiveness of the network, while dropout is used in each LSTM layer to suppress the overfitting effect, which effectively improves the accuracy of the experimental results. The model is compiled with the root mean square prop (RMSProp) and adaptive momentum (Adam), using Mean Absolute Error (MAE) as the loss function and Mean Square Error (MSE) and Mean Absolute Percentage Error (MAPE) as the evaluation metrics. When the MAE is smaller, it means the loss is smaller, and when the MSE and MAPE are smaller, it means the prediction accuracy is higher. The specific formula is shown below.
where,
For all the gates and security checkers in the passenger station, their comprehensive measurement data are input into the network model in this paper for training separately, and during the training process, the hyperparameters (the number of units per layer or the learning rate of the optimizer) are continuously adjusted for each equipment to find the best configuration. Taking gate 1-1 (corresponding to “Group 1-1” in Table 3) as an example, after 200 epochs of training, the comparison image of training MAE and verification MAE, and the comparison image of training MSE and verification MSE are shown in Figure 6.
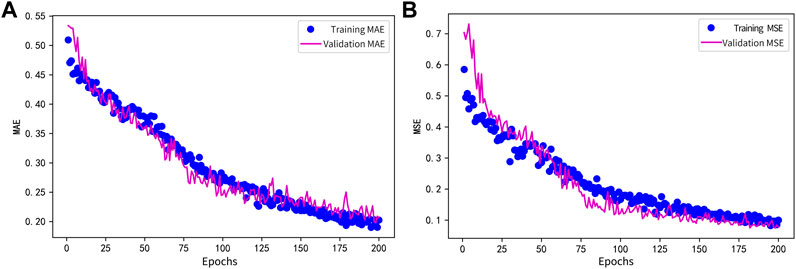
FIGURE 6. Comparison of training and validation. (A) Training MAE and Validation MAE; (B) Training MSE and Validation MSE.
As shown in Figure 6, the experimental effect of the method is similar in the training dataset and validation dataset samples, and the correlation error gradually decreases as the number of iterations increases. When the training iterations are about 200, the decreasing trend of the validation MAE and validation MSE of this gate is basically smooth, around 0.20 and 0.10, respectively, which achieves better experimental results.
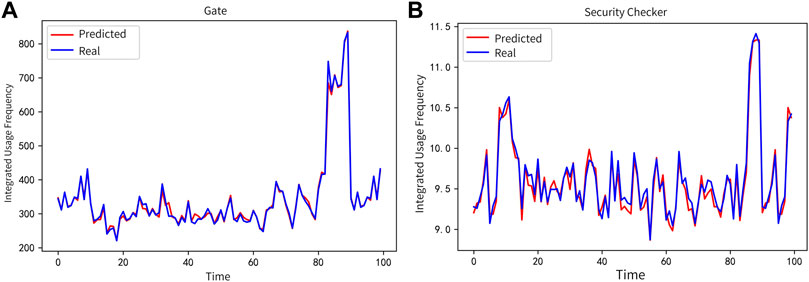
The optimal model obtained on the training set was used to conduct experiments on the test set. The change curves of the predicted and real values obtained from the test set through the network were monitored in the experiment, indicating that the model has a good predictive capability. Taking gate 1-1 and security checker a as an example, Figure 7 below shows the prediction performance of both on the test set.
Meanwhile, the MAE, MSE, and MAPE of the gates and security checkers are evaluated on all test set samples, respectively, and their average values are taken as shown in Table 4, and the experiments show that the G-LSTM has high prediction accuracy.
4.4 Experimental prediction
Since the equipment manufacturers and production time of passenger stations are different, and their service life and rated life also differ, the health status of the two types of equipment in the future period is predicted using the method in this paper.
First, based on the initial graph of equipment in Figure 5, the equipment health status is predicted for 100 days thereafter using the data predicted based on the test set samples. At the same time, it is compared with the real test set samples. The experimental results show that the same graph of the health status of equipment can be obtained using both types of experimental data, as shown in Figure 8.
In addition, the model in this paper can be applied to predict the experimental scenarios for the next 100, 300, 500, and 700 days, by the rolling prediction method, i.e., continuously using the data obtained from our prediction as the real data, and thus further predicting the next data. Figure 9 shows the forecast for gate 1-1 in the next 100 and 300 days.
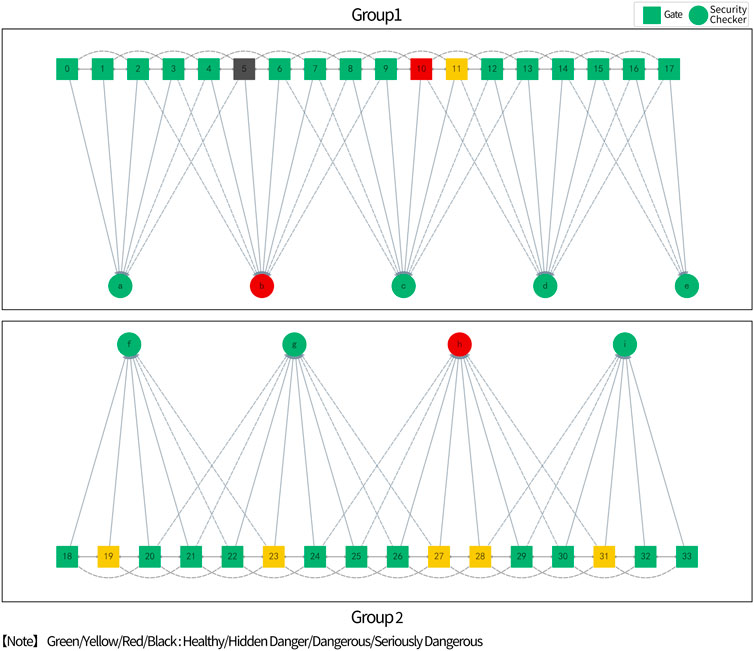
Based on the numerical results obtained from the prediction, the future health status of the equipment can be predicted. Figure 10 below shows the possible health status of the equipment after 100 days (Figure 10A), 300 days (Figure 10B), 500 days (Figure 10C) and 700 days (Figure 10D) in the future based on the initial graph of Figure 8, which provides a reference basis for the maintenance of the equipment.
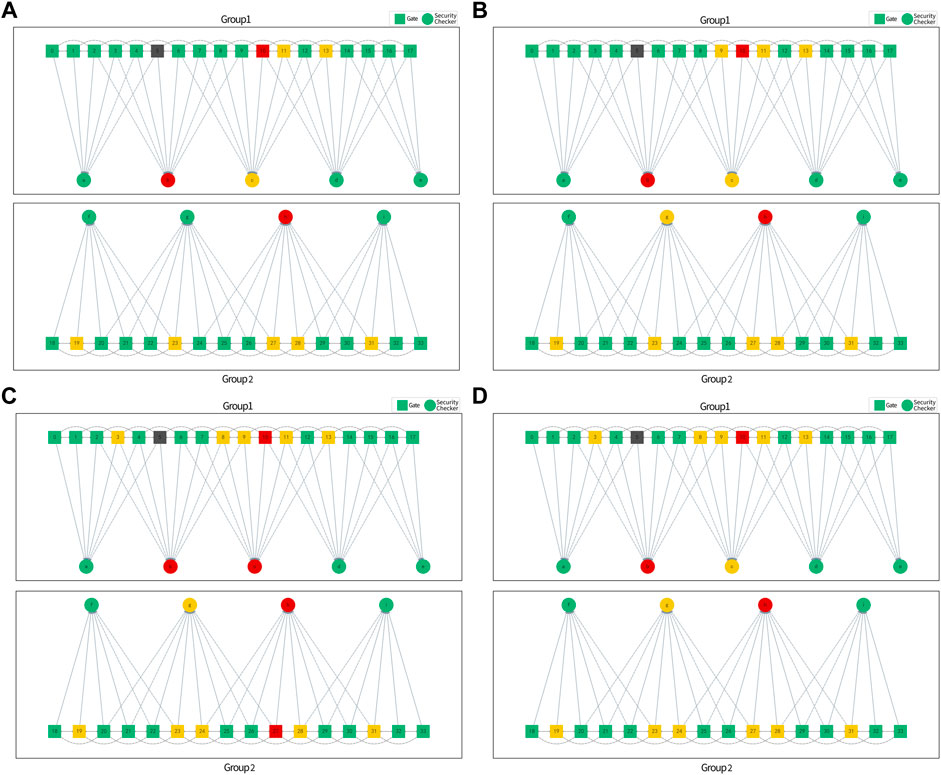
FIGURE 10. Equipment health status prediction. (A) Health status prediction after 100 days; (B) Health status prediction after 300 days; (C) Health status prediction after 500 days; (D) Health status prediction after 700 days.
4.5 Analysis of experimental results
In this paper, we conduct experimental verification for gates and security checkers in a high-speed railway passenger station. The experimental results show that the G-LSTM model proposed in this paper obtains the average MAE: 0.2318, 0.2504, average MSE: 0.1176, 0.2610 and average MAPE: 5.57%, 2.04% for the gates and security checkers on the test set samples, realizing the assessment and prediction of the health status of railway passenger station equipment. The method in this paper can be extended to other equipment in passenger stations to reflect the health status of railway passenger station equipment more comprehensively, which has good application value. In addition, on the one hand, we can provide a decision basis for passenger station managers based on the health status prediction results. Managers can combine the health status of equipment at different locations in passenger stations for dynamic guidance of passenger flow to avoid inconvenience to passengers due to potential equipment failure. On the other hand, according to the current health status and deterioration trend of equipment, it provides differential maintenance strategies for passenger station equipment managers to avoid equipment failure to the greatest extent and ensure the safety of passenger stations.
5 Summary
In this paper, we combine graph data and deep learning technology and propose a G-LSTM based method for assessing and predicting the health status of equipment in passenger stations. This paper mainly describes the health assessment and prediction of gates and security checkers. Firstly, we analyzed the correlation modeling of the factors influencing the health status of equipment in railway passenger station. Then, we constructed a comprehensive assessment model for the health status of equipment in passenger station. Finally, we selected gates and security checkers in a high-speed railway passenger station for experimental verification. The experimental results show that the G-LSTM model can be used to evaluate and predict the health status of equipment with high experimental accuracy. The method proposed in this paper realizes the health management such as abnormal status warning, remaining life prediction, etc.
In the future, we will continue to optimize and improve the method proposed in this paper, and extend its application to all kinds of equipment in passenger stations to realize the health management of all equipment. At the same time, we can explore the application of various GNNs in multiple scenarios in passenger stations, such as recommendation algorithms based on GNNs to provide personalized information push services for passengers, and equipment link prediction of passenger stations based on spatio-temporal graph convolutional neural networks for detecting key equipment information and early warning prediction of paralysis, etc. In addition, although GNNs have carried out applied research in many fields, challenges still exist due to the complexity of the graph structure, and there is plenty of room for continuous optimization in model structure.
Data availability statement
The original contributions presented in the study are included in the article/Supplementary Material, further inquiries can be directed to the corresponding author.
Author contributions
JY and GY mainly uses G-LSTM neural network to model and analyze the prediction of the railway station equipment health status. WB mainly proposes the assessment of the railway station equipment health status. ZM and KS are mainly responsible for building the experimental platform and numerical simulation for the assessment and prediction of railway station equipment health status.
Funding
This work was supported by the National Key Research and Development Program of China under Grant 2020YFF0304100, Research Project of China Academy of Railway Sciences Group Co., Ltd. under Grant 2021YJ183, Research Project of Beijing Jingwei Information Technologies Limited Company under Grant DZYF21-56 and DZYF22-11 and China Postdoctoral Science Foundation under Grant 2021M692400.
Conflict of interest
Authors WB and GY were employed by China Academy of Railway Sciences Corporation Limited.
The authors declare that this study received funding from the research project of China academy of railway sciences group Co., Ltd. and the research project of Beijing Jingwei information technologies limited company. JY, WB and GY are all members of the above three funded projects. JY and GY mainly uses G-LSTM neural network to model and analyze the prediction of the railway station equipment health status. WB mainly proposes the assessment of the railway station equipment health status.
Publisher’s note
All claims expressed in this article are solely those of the authors and do not necessarily represent those of their affiliated organizations, or those of the publisher, the editors and the reviewers. Any product that may be evaluated in this article, or claim that may be made by its manufacturer, is not guaranteed or endorsed by the publisher.
References
1. Li X, Zhang Y, Li Y, Zhan Y, Yang L. Health state prediction and performance evaluation of belt conveyor based on dynamic Bayesian network in underground mining. Shock and Vibration (2021) 2021:6699611. doi:10.1155/2021/6699611
2. Wang X, Guo H, Wang J, Wang L. Predicting the health status of an unmanned aerial vehicles data-link system based on a Bayesian network. Sensors (2018) 18(11):3916. doi:10.3390/s18113916
3. Yang B-S, Widodo A. Support vector machine for machine fault diagnosis and prognosis. J Syst Des Dyn (2008) 2(1):12–23. doi:10.1299/jsdd.2.12
4. Zhang L, Liu Z, Luo D, Li J, Huang H. Review of remaining useful life prediction using support vector machine for engineering assets. In: Proc. Int. Conf. Qual. Rel. Risk Maint. Safety Eng. (QR2MSE); 15-18 July 2013; Chengdu, China. IEEE (2013). p. 1793–9.
5. Xiong Y, Jiang Z, Fang H, Fan H. Research on health condition assessment method for spacecraft power control system based on SVM and cloud model. In: Proc. Progn. Syst. Health Manag. Conf. (PHM-Paris); 02-05 May 2019; Paris, France. IEEE (2019). p. 143–9.
6. Ghasemi A, Yacout S, Ouali M. -S. Evaluating the reliability function and the mean residual life for equipment with unobservable states. IEEE Trans Reliab (2010) 59(1):45–54. doi:10.1109/TR.2009.2034947
7. Martins A, Fonseca I, Farinha J, Reis J, Cardoso A. Maintenance prediction through sensing using hidden Markov models-a case study. Appl Sci (Basel) (2021) 11(16):7685. doi:10.3390/app11167685
8. Dong M, He D, Banerjee P, Keller J. Equipment health diagnosis and prognosis using hidden semi-Markov models. Int J Adv Manuf Technol (2006) 30(7–8):738–49. doi:10.1007/s00170-005-0111-0
9. Liu Q, Dong M, Lv W, Geng X, Li Y. A novel method using adaptive hidden semi-Markov model for multi-sensor monitoring equipment health prognosis. Mech Syst Signal Process (2015) 64–65:217–32. doi:10.1016/j.ymssp.2015.03.029
10. Orchard ME, Vachtsevanos GJ. A particle-filtering approach for on-line fault diagnosis and failure prognosis. Trans Inst Meas Control (2009) 31(3–4):221–46. doi:10.1177/0142331208092026
11. Zhao F, Chen J, Guo L, Li X. Neuro-fuzzy based condition prediction of bearing health. J Vib Control (2009) 15(7):1079–91. doi:10.1177/1077546309102665
12. Soualhi A, Makdessi M, German R, Echeverria FR, Razik H, Sari A, et al. (2018). Heath monitoring of capacitors and supercapacitors using the neo-fuzzy neural approach. IEEE Trans Industr Inform 14(1):24–34. doi:10.1109/TII.2017.2701823
13. Zhao Z, Jiang W, Gao W. Health evaluation and fault diagnosis of medical imaging equipment based on neural network algorithm. Comput Intell Neurosci (2021) 2021:1–9. doi:10.1155/2021/6092461
14. Yang B, Liu R, Zio E. Remaining useful life prediction based on a double-convolutional neural network architecture. IEEE Trans Ind Electron (2019) 66(12):9521–30. doi:10.1109/TIE.2019.2924605
15. Peng W, Ye Z-S, Chen N. Bayesian deep-learning-based health prognostics toward prognostics uncertainty. IEEE Trans Ind Electron (2020) 67(3):2283–93. doi:10.1109/TIE.2019.2907440
16. Chen Z, Wu M, Zhao R, Guretno F, Yan R, Li X. Machine remaining useful life prediction via an attention-based deep learning approach. IEEE Trans Ind Electron (2021) 68(3):2521–31. doi:10.1109/TIE.2020.2972443
17. Ma M, Mao Z. Deep-Convolution-based LSTM network for remaining useful life prediction. IEEE Trans Industr Inform (2021) 17(3):1658–67. doi:10.1109/TII.2020.2991796
18. Chen Y, Peng G, Zhu Z, Li S. A novel deep learning method based on attention mechanism for bearing remaining useful life prediction. Appl Soft Comput (2020) 86:105919. doi:10.1016/j.asoc.2019.105919
19. Ren L, Sun Y, Wang H, Zhang L. Prediction of bearing remaining useful life with deep convolution neural network. IEEE Access (2018) 6:13041–9. doi:10.1109/ACCESS.2018.2804930
20. Li X, Jiang H, Xiong X, Shao H. Rolling bearing health prognosis using a modified health index based hierarchical gated recurrent unit network. Mech Mach Theor (2019) 133:229–49. doi:10.1016/j.mechmachtheory.2018.11.005
21. Chen Z. Research on equipment health assessment and remaining useful life prediction method based on LSTM. M.S. thesis. China: University of Science and Technology of China (2019).
22. Zhang Y, Xiong R, He H, Pecht MG. Long short-term memory recurrent neural network for remaining useful life prediction of lithium-ion batteries. IEEE Trans Veh Technol (2018) 67(7):5695–705. doi:10.1109/TVT.2018.2805189
23. da Costa PRde O, Akçay A, Zhang Y, Kaymak U. Remaining useful lifetime prediction via deep domain adaptation. Reliability Eng Syst Saf (2020) 195:106682. doi:10.1016/j.ress.2019.106682
24. Shi Z, Chehade A. A dual-LSTM framework combining change point detection and remaining useful life prediction. Reliability Eng Syst Saf (2021) 205:107257. doi:10.1016/j.ress.2020.107257
25. Wu J, Hu K, Cheng Y, Zhu H, Shao X, Wang Y. Data-driven remaining useful life prediction via multiple sensor signals and deep long short-term memory neural network. ISA Trans (2020) 97:241–50. doi:10.1016/j.isatra.2019.07.004
26. She D, Jia M. A BiGRU method for remaining useful life prediction of machinery. Measurement (2021) 167:108277. doi:10.1016/j.measurement.2020.108277
27. Chen J, Jing H, Chang Y, Liu Q. Gated recurrent unit based recurrent neural network for remaining useful life prediction of nonlinear deterioration process. Reliability Eng Syst Saf (2019) 185:372–82. doi:10.1016/j.ress.2019.01.006
28. Zhou J, Cui G, Hu S, Zhang Z, Yang C, Liu Z, et al. (2020). Graph neural networks: A review of methods and applications. AI Open 1:57–81. doi:10.1016/j.aiopen.2021.01.001
29. Wu Z, Pan S, Chen F, Long G, Zhang C, Yu PS. A comprehensive survey on graph neural networks. IEEE Trans Neural Netw Learn Syst (2021) 32(1):4–24. doi:10.1109/TNNLS.2020.2978386
30. Li Y, Tarlow D, Brockschmidt M, Zemel RS. Gated graph sequence neural networks. In: Proc. Int. Conf. Learn. Represent.; 05 May 2016; Paris, France. IEEE (2016). p. 1–20.
31. Zayats V, Ostendorf M. Conversation modeling on reddit using a graph-structured LSTM. Trans Assoc Comput Linguist (2018) 6:121–32. doi:10.1162/tacl_a_00009
32. Li R, Wang S, Zhu F, Huang J. Adaptive graph convolutional neural networks. In: Proc. 32nd AAAI Conf. Artif. Intell.; 13 March 2018; New Orleans, LA, United states. AAAI (2018). p. 3546–52.
Keywords: deep learning, graph neural network, G-LSTM, status assessment, status prediction
Citation: Yao J, Bai W, Yang G, Meng Z and Su K (2022) Assessment and prediction of railway station equipment health status based on graph neural network. Front. Phys. 10:1080972. doi: 10.3389/fphy.2022.1080972
Received: 26 October 2022; Accepted: 21 November 2022;
Published: 16 December 2022.
Edited by:
Dun Han, Jiangsu University, ChinaReviewed by:
Dawei Zhang, Shandong University, ChinaFengping An, Beijing Institute of Technology, China
Haitao Xu, University of Science and Technology Beijing, China
Yunyun Yang, Taiyuan University of Technology, China
Copyright © 2022 Yao, Bai, Yang, Meng and Su. This is an open-access article distributed under the terms of the Creative Commons Attribution License (CC BY). The use, distribution or reproduction in other forums is permitted, provided the original author(s) and the copyright owner(s) are credited and that the original publication in this journal is cited, in accordance with accepted academic practice. No use, distribution or reproduction is permitted which does not comply with these terms.
*Correspondence: Wei Bai, YmFpd2Vpc3h1QDEyNi5jb20=
 Jian Yao1
 Wei Bai
 Zhikang Meng