 Yun Yang
95% of researchers rate our articles as excellent or good
Learn more about the work of our research integrity team to safeguard the quality of each article we publish.
Find out more
ORIGINAL RESEARCH article
Front. Phys. , 10 January 2023
Sec. Physical Acoustics and Ultrasonics
Volume 10 - 2022 | https://doi.org/10.3389/fphy.2022.1075549
This article is part of the Research Topic Nondestructive Testing, Multi-Field Information Fusion, and AI-Aided Signal Processing View all 7 articles
Tapered roller bearings are widely used in heavy machinery, railway transportation, aviation, and other fields. Their quality and reliability are related to the operational safety of mechanical equipment. In the axial crack magnetic flux leakage (MFL) detection of the bearing ring, the MFL signals obtained by the sensor from different curvature radius of the surface are inconsistent, affecting the detection accuracy of cracks and subsequent quantitative analysis. In order to address the above problems, the finite element simulation is performed to analyze the influence of the surface curvature radius of the bearing ring on the magnetic field distribution inside the workpiece and the MFL signal in the circumferential magnetization. Through the parallel magnetic circuit, the difference in curvature radius is identified as the basic reason for non-uniform magnetization. On this basis, the compensation method based on the normalization of surface magnetization is proposed. Furthermore, the effectiveness of the compensation method is verified by experiments. The relative change in the amplitude of the crack MFL signal is reduced from 30% to 5%.
Tapered roller bearing has the advantages of good rigidity, large bearing capacity, high-speed operation, and multi-directional load. It has been widely applied in heavy machinery, railway transportation, aviation, and other fields. The quality and reliability of tapered roller bearings are directly related to the operation security of mechanical equipment [1]. According to statistics, about 90% of the failures of bearing rings come from cracks. Therefore, it is of great engineering significance to improve the crack detection capability of bearing rings and promote their quality [2]. At present, the defect detection methods for bearing rings include magnetic particle testing [3, 4], eddy current testing [5, 6], magnetic flux leakage (MFL) testing, ultrasonic testing [7, 8], and machine vision testing [9–11]. MFL testing is widely used to evaluate various ferromagnetic materials. It can effectively detect surface, near-surface, and internal defects with high sensitivity, which is convenient for realizing automation [12, 13].
With the further development of MFL testing technology, the detection of defects alone cannot satisfy the needs of practical applications. More researchers have focused on using MFL signals to reverse the profile of defects [14–16]. Therefore, it is essential to Optimize the MFL signal [17, 18] and ensure that the MFL signals generated by defects of the same size are consistent. Feng [19] proposed to increase the axial length of the magnetizing coil to achieve a consistent detection signal at high and low speeds. A magnetization method for longitudinal MFL detection was also proposed. This method expanded the uniform magnetic field area on the surface of the steel pipe, improving the consistency of the detection signal in the same detection area [20]. Yang [21] proposed a multi-stage magnetizer to suppress the magnetization hysteresis effect and realize the signal consistency in high-speed magnetization detection. Usaeek [22] proposed a compensation method for high-speed MFL detection signals. The least square method was used to fit the normal component of MFL at different detection speeds to achieve signal consistency.
From the perspective of magnetization and signal processing, the above research realizes signal consistency under high-speed MFL detection. However, there is no in-depth study on the signal consistency of tapered roller bearing rings. In the axial crack detection of bearing rings, the magnitude of MFL signals obtained by scanning sensors with different radius of curvature varies significantly. This variation directly affects the consistency of MFL detection of bearing rings and influences the detection accuracy of cracks and subsequent quantitative research.
To solve the above problems, the influence of the surface curvature radius of the bearing ring on the magnetic field distribution inside the workpiece and the axial crack MFL signal in circumferential magnetization is investigated. A signal compensation method is proposed to improve the consistency of the crack MFL signal.
The tapered roller bearing ring is divided into an inner ring and an outer ring. As shown in Figure 1, surface one of the outer and inner rings is a cylindrical surface with a constant radius of curvature, and surface two is a conical surface with a variable radius of curvature. In the practical application of bearing rings, surface two is in direct contact with the high-speed rotating roller, which is subjected to both axial and radial loads. Therefore, higher requirements are placed on the crack detection of bearing ring surface 2.
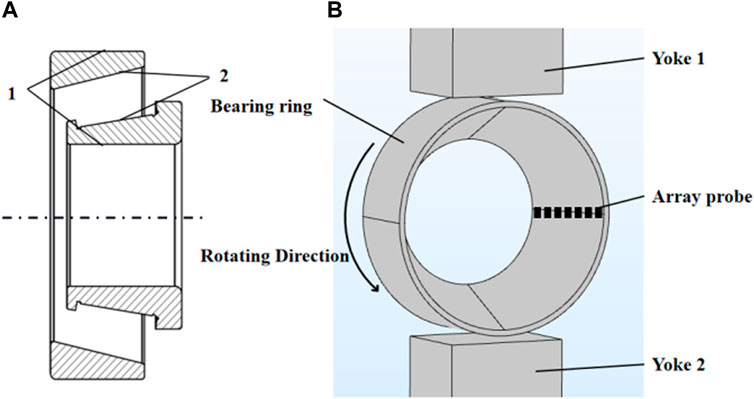
FIGURE 1. (A) Schematic diagram of the bearing sleeve ring structure;(B) Schematic diagram of peripheral magnetization of the bearing ring.
According to the theory of MFL detection, there is almost no MFL when the excitation magnetic field is parallel to the crack. The maximum MFL occurs when the excitation magnetic field is perpendicular to the crack. Therefore, for axial crack detection of the bearing ring, it is necessary to magnetize the rings in the circumferential direction, with the magnetization field generated by the coil wound on the yoke. In previous studies, it was found that the tangential component of the magnetic field formed on the central region away from the two poles is larger than the magnetic field formed on the pipe wall opposite to the magnetic pole. On this basis, the detection probe should be arranged in this area. As shown in Figure 1, the probe and magnetizer are fixed. The bearing ring rotates in place, and the array probe extends along the axial direction, close to the detection surface.
In order to further observe the magnetization characteristics of the surface, simulation models of the inner and outer bearing rings are established by COMSOL Multiphysics 5.4 finite element simulation software. As shown in Figure 2, the yoke is set to 60 mm × 100 mm × 100 mm, and the distance from the bottom of the yoke to the bearing ring is 5 mm. The surface diameter of the outer bearing ring is 200 mm, and the axial width is 65 mm. The wall thickness of the small end is 5 mm, and the cone angle of the conical surface is 25. The diameter of the inner surface of the bearing inner ring is 50 mm, ignoring the shoulders of the fixed rollers. The thickness of the small end is 5 mm, and the conical angle is 25. In order to ensure a distance of 5 mm between the bottom of the yoke and the outer surface of the bearing ring, the bottom of the yoke is set as a conical surface. The coil is set built-in material copper, magnetic yoke and bearing ring material is set soft iron (without losses), the rest is set air. When the coil current is set 10 A and the number of coil turns is 500 turns, the inner and outer rings of the bearing can be saturated and magnetized. For convenient observation, the conical surfaces of the outer and inner rings are expanded into a plane, and the cloud diagram of magnetic field distribution is shown in Figure 3.
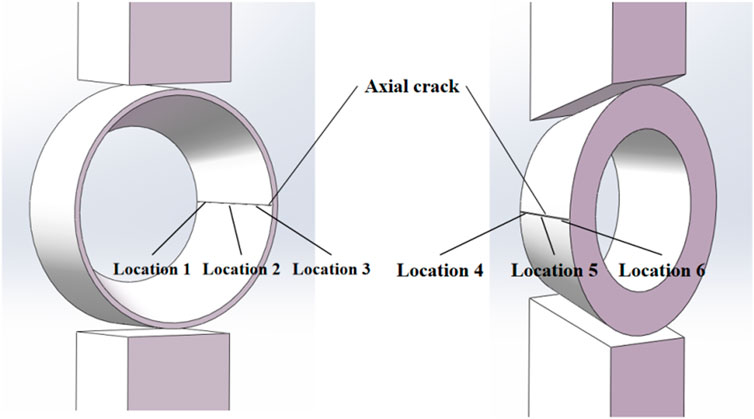
FIGURE 2. Magnetization model of bearing ring.
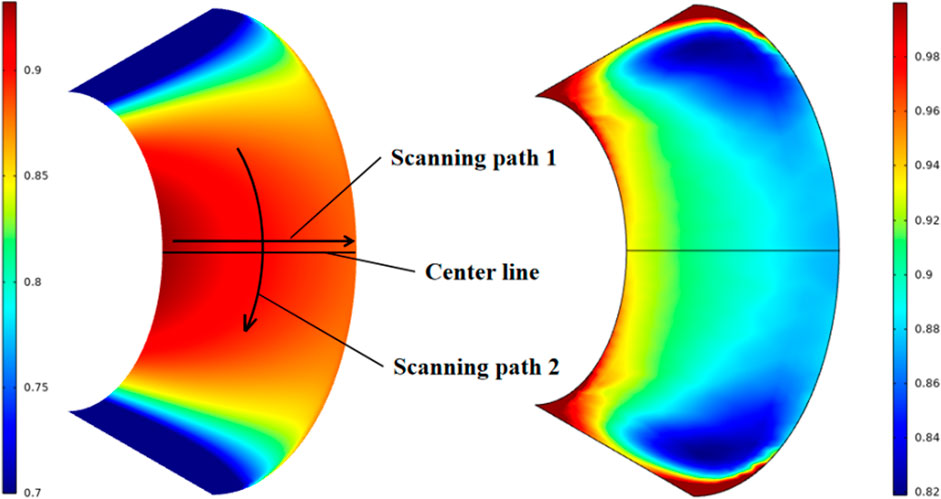
FIGURE 3. Cloud diagram of magnetic field distribution of outer/inner bearing ring.
It can be seen that the magnetization distribution of the inner and outer bearing rings is non-uniform. The magnetic flux density in the middle part is greater than that at the upper and lower ends, and the magnetic flux density along the centerline on the left side is smaller than that on the right side.
In order to make the study more rigorous and representative, it is necessary to investigate the tapered roller bearing rings with different sizes, establish the outer ring simulation models of four types in Table 1 and the inner ring simulation models of four types in Table 2, keeping the yoke, conical angle and magnetizing current unchanged.
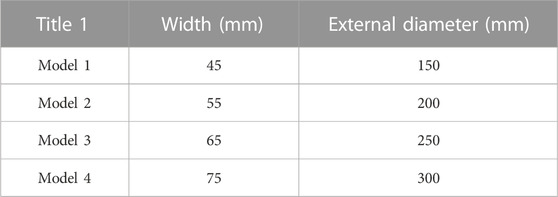
TABLE 1. The size of the outer ring.
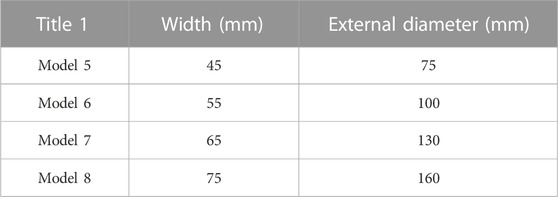
TABLE 2. The size of the inner ring.
In order to further observe the magnetization characteristics of the near-surface of the bearing ring, the near-surface magnetic induction at the centerline is extracted along scanning path one in Figure 3. The internal magnetic flux density tangent component Bx is obtained from .1 mm to the surface, as shown in Figure 4.
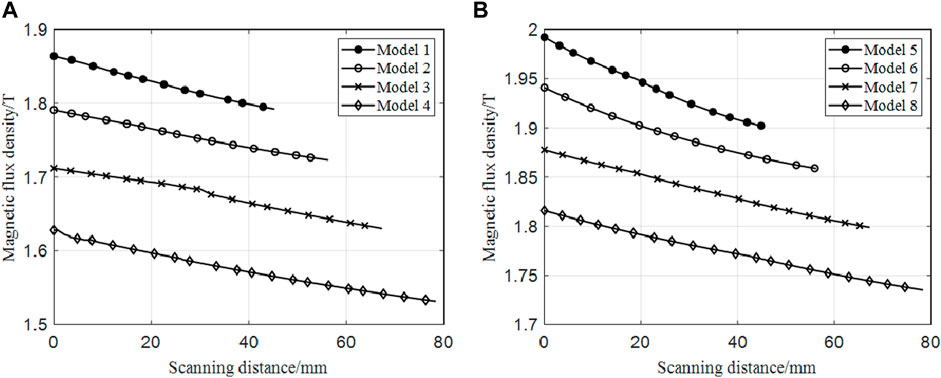
FIGURE 4. (A) Magnetic flux density near the surface of the outer bearing ring (B) Magnetic flux density near the surface of the inner bearing ring.
It can be seen that the inner and outer rings have the same magnetization law for the four model sizes. The surface curvature radius along scanning path one continuously increases, and the corresponding magnetic flux density decreases. Therefore, the circumferential magnetization of the tapered roller bearing ring has significant non-uniform magnetization at different curvature radius. A smaller curvature radius indicates a greater magnetic induction intensity.
In order to further explore the influence of the surface curvature radius on the axial crack signal, the subsequent analysis is conducted on the inner and outer rings of tapered roller bearings with an axial width of 65 mm. Based on the simulation model in Figure 2, axial cracks with a width and a depth of .2 mm are set on the centerline of the inner and outer bearing rings, respectively. The MFL signal of the outer bearing ring is extracted along scanning path two at Locations 1, 2, and 3. Moreover, the tangent component Bx of MFL signal of the inner bearing ring is extracted along scanning path two at Locations 4, 5, and 6. The lift-off is .1 mm, and the results are shown in Figure 5.
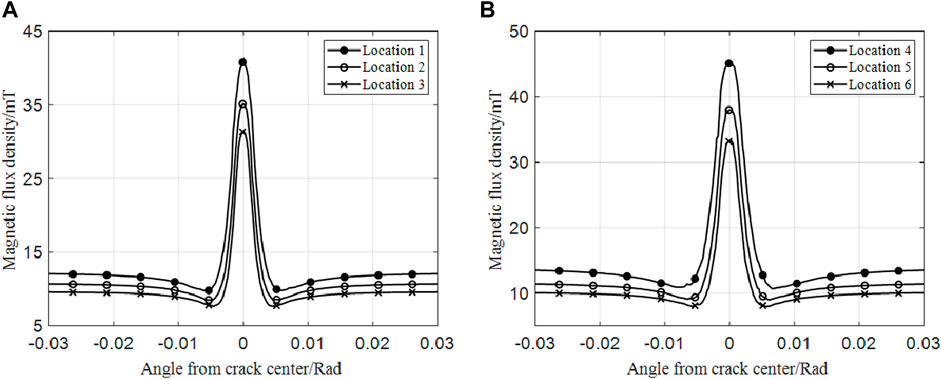
FIGURE 5. (A) MFL signal from cracks in the outer bearing ring at different positions (B) MFL signal from cracks in the bearing inner ring at different positions.
It can be seen that for cracks of the same size, there are significant differences in the peak and baseline MFL signals at different positions. The outer bearing ring has the smallest radius of curvature at position 1, and the peak of the MFL signal of the crack is the largest. The inner bearing ring has the smallest radius of curvature at position 5, and the peak value of the MFL signal of the crack is the largest.
Afterward, the crack width is kept at 2 mm, and axial cracks with a crack depth of 3 mm, 4 mm, and 5 mm are added. The peak-valley values of MFL signals at three positions of four sizes of cracks are extracted, as shown in Figure 6.
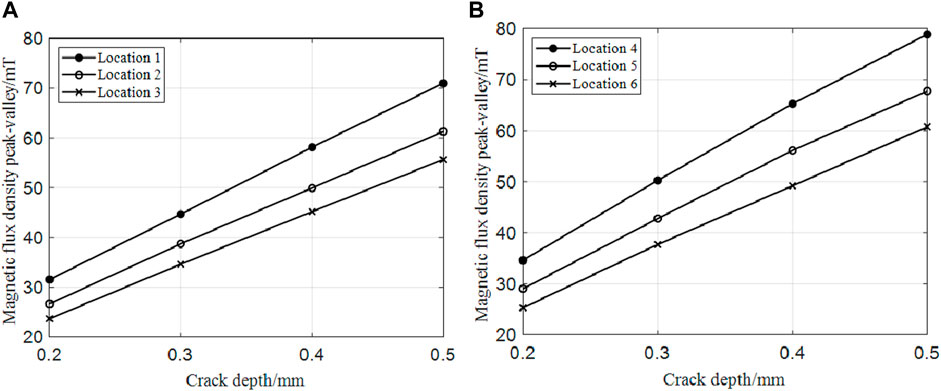
FIGURE 6. (A) Peak-valley values of MFL signals at different axial locations of the same crack in the outer bearing ring (B) Peak-valley values of MFL signals at different axial locations of the same crack in the inner bearing ring.
It can be seen that the MFL signals are inconsistent for the four depths of cracks at different positions. A smaller radius of curvature indicates greater peak and valley values in MFL signals of cracks obtained by scanning.
Based on the above research, the crack MFL signals obtained by the array sensor scan from different curvature radius are different in the axial crack detection of bearing rings. A smaller curvature radius indicates a larger crack MFL signal. The actual contour size of the defect cannot be accurately inverted through the detection signal, affecting the accuracy of crack detection and subsequent quantitative research.
In this study, the relative change of signal amplitude is used as the index to evaluate the signal consistency:
where Bmax is the maximum value of signal amplitude; Bmin is the minimum value of signal amplitude.
A larger amplitude value suggests a worse signal consistency. Based on Eq. 1, the relative change of the signal amplitude of the outer bearing ring with the crack MFL signal of .2 mm is ∆B = 30.43%, and the relative change of signal amplitude of the inner ring is ∆B = 35.03%.
According to the above analysis, the key to ensuring the consistency of the detection signal is to establish a uniform magnetic field near the surface of the bearing ring. In Figure 2, the magnetization part of the circumferential DC coil of the bearing ring consists of a DC excitation coil and yoke. Considering the symmetry of the magnetic circuit and structure, half of the magnetizer structure is taken for analysis. Its corresponding equivalent magnetic circuit model can be obtained, as shown in Figure 7.
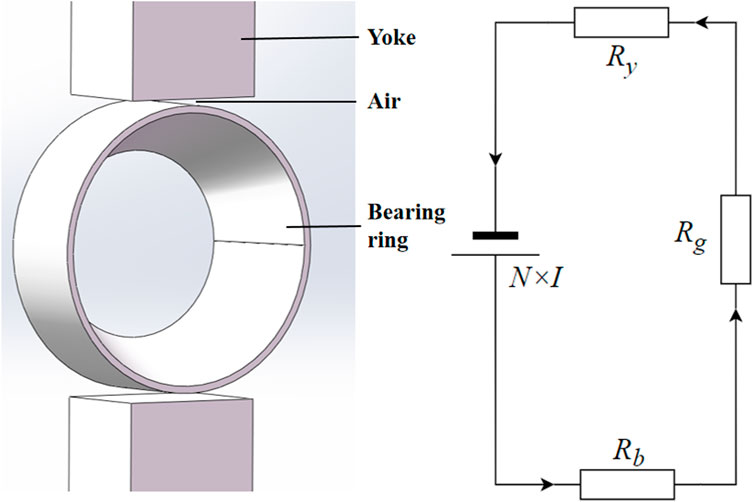
FIGURE 7. Equivalent magnetic circuit model of circumferential magnetization of bearing rings.
Taking a closed magnetic line in the magnetic circuit composed of the yoke and bearing ring, the following equation can be obtained:
where N is coil turns; I is coil current; εM is magnet-motive force; Ry, Rg, Rb represents the magnetic resistance of the yoke, air, and bearing ring, respectively. Afterward, the following equation is obtained:
During the magnetization of the bearing ring, the magnetic line of force follows the direction of the annular tube wall. In order to analyze the distribution characteristics of the magnetic field inside the bearing ring, the cross-section of the outer bearing ring is subdivided into n equal parts with an area of ∆S, and the corresponding magnetic line loop radius is r, as shown in Figure 8. Therefore, the total magnetoresistance of the bearing ring can be divided into n parallel magnetoresistance.
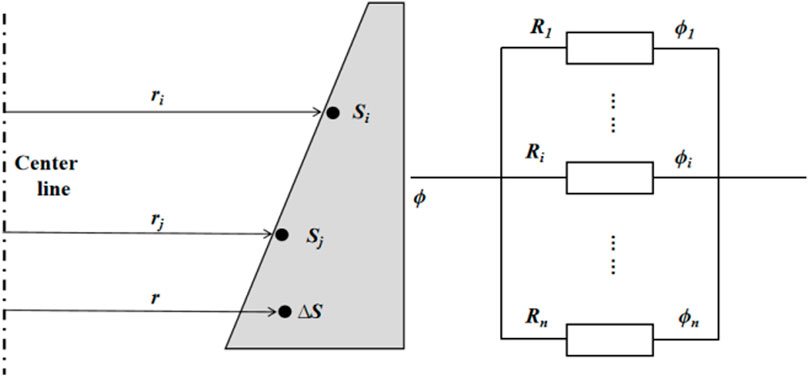
FIGURE 8. Sectional subdivision of bearing ring and corresponding magnetoresistance.
The corresponding magnetoresistance of each branch can be calculated as:
where l is the equivalent length of the magnetic circuit; μ is the relative permeability of bearing ring; r is the radius of curvature per unit area.
It can be seen from Eq. 4 that the branch magnetoresistance R is proportional to the corresponding radius of curvature r. A larger radius indicates a smaller magnetoresistance. Taking the unit area Si and Sj at different positions on the inner surface of the outer ring of the bearing, the corresponding radius of curvature is ri and rj, then:
According to Eq. 4, the following relation can be obtained:
Since the total magnetic flux through the bearing ring is constant, it can be obtained by combining the parallel Ohm’s law of the magnetic circuit:
It can be further concluded from B = ϕ/S:
There are differences in the size of the magnetic field on the inner surface of the outer bearing ring. A larger radius of curvature suggests a smaller magnetic induction intensity, consistent with the simulation results in the previous section.
Based on the same analysis method, there are also curvature differences on the conical surface of the outer wall of the bearing inner ring, and its radius ri and rj also meet Eq. 5. Therefore, there is a difference in the size of the magnetic field on the inner surface of the bearing ring. A larger radius of curvature indicates a smaller magnetic induction intensity, consistent with the simulation results in the previous section.
Based on the above analysis, it can be found that the uneven magnetization of the conical surface of the bearing ring is caused by the different radius of curvature. Therefore, a compensation method based on the normalization of surface magnetization is proposed to achieve a consistent MFL signal for the same crack.
Because the smaller curvature radius of the bearing ring indicates the greater magnetic induction intensity, the minimum curvature radius of the conical surface of the inner and outer rings of the bearing is selected as the reference point for signal compensation. In this way, a greater magnetic induction intensity can be obtained.
As shown in Figure 9, the difference in curvature radius from each position of the conical surface of the inner and outer bearing rings to the reference point can be expressed as:
where x is the distance between the compensation position and reference point; r is the radius of curvature of the datum end face; θ is the conical angle.
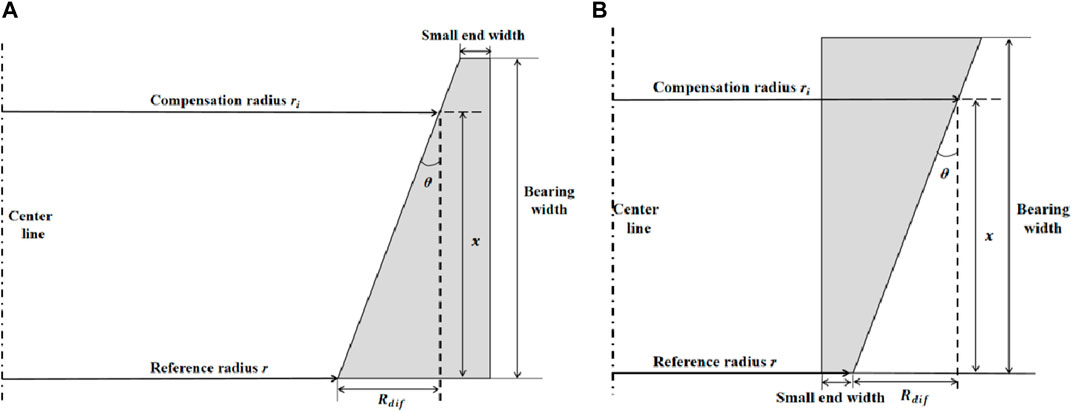
FIGURE 9. (A) Section diagram of the outer bearing ring (B) Section diagram of the inner bearing ring.
The compensation coefficient based on the radius of curvature is set as K. Since the magnetization at the crack is linearly corresponding to the amplitude of the MFL signal, the consistency of the magnetization at all parts of the bearing ring through the compensation coefficient is equivalent to the consistency of the MFL signal of the crack, so there are:
where Bi is compensated magnetic flux density; B is magnetic flux density at the reference.
By performing bisection on the cross-section in front, the following equation can be obtained:
By applying Eq. 4 and 9 to the above equation, the following equation can be obtained:
Since the difference in curvature radius can be expressed by Eq 9 and 12 can be used as the compensation coefficient of the inner and outer bearing rings. The cone angle θ and the radius of curvature R of the reference end face are determined by the model of the bearing ring. Therefore, for the single bearing ring, only the distance x from the sensor to the reference end face needs to be identified for calculating the compensation signal.
In order to verify the effectiveness of the compensation method, the signal amplitude after compensation is calculated by using the amplitude of the crack MFL signal of the outer bearing ring. Furthermore, the compensation coefficients at position 1, position 2, and position three are calculated as 1.146, 1.235, and 1.326, respectively. The compensated crack MFL signal is plotted by the .2 mm crack MFL signal, as shown in Figure 10A. The peak and valley values of the four crack MFL signals after compensation are shown in Figure 10B.
FIGURE 10. (A) Compensated crack MFL signal (B) Peak-valley value of crack MFL signal after compensation.
It can be seen that the MFL signals of the same crack at different positions are basically the same after signal compensation, and the baseline drift is also improved. According to Figure 6A and Figure 10B, the MFL signals of defects in different sizes at different positions are separated after signal compensation, and the contour size of defects can be inverted through the MFL signals.
Taking the .2 mm crack as an example, the relative change of the signal amplitude of the inner wall crack of the outer ring of the bearing is ∆B = .65%. As a result, the consistency of the MFL signal of the bearing ring crack is improved, and the validity of the signal compensation method based on the curvature radius is validated.
To observe the effect of the curvature radius on the axial crack magnetic leakage signal and to verify the effect of the compensation method, four models of tapered roller bearing rings were prepared. The axial artificial crack was carved on the bearing ring. The number of cracks for each size is 1, and the width is .2 mm. Table 3 shows the crack depth and length. The cracks on the workpiece one are of three depths to verify the influence of curvature radius of outer bearing rings on different cracks. Then the crack depth of .4 mm was used as the main study subject. Compared with workpieces 2, 3, and 4, workpiece one validates the influence of the radius of curvature on the crack leakage signal. In addition, the MFL signal law for different types of bearing ring cracks at different curvature radius is verified. Experimental workpieces and artificial axial cracks are shown in Figure 11.
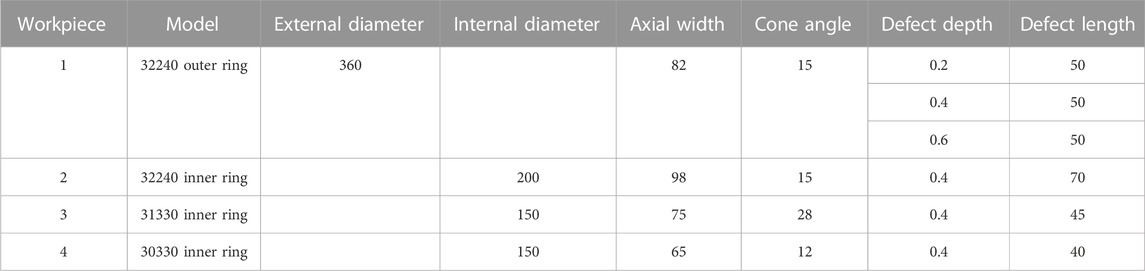
TABLE 3. Experimental workpiece and crack sizes.
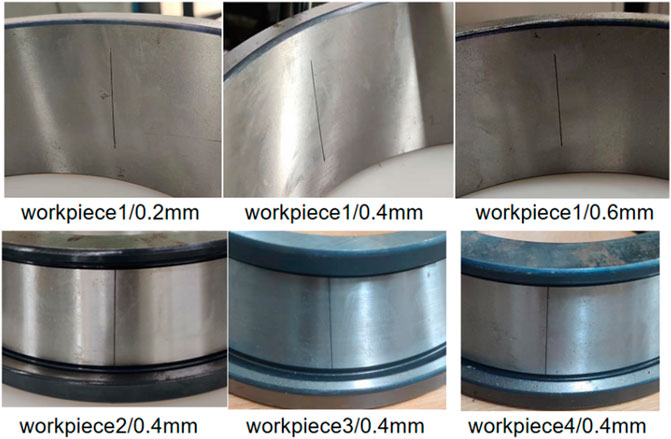
FIGURE 11. Experimental workpieces and artificial axial cracks.
The experimental platform for axial detection of the bearing cracks was established, as shown in Figure 12. The main components of the experimental device are: coil, magnetizer, workpieces, sensor, DC motivates power supply, signal amplifier, oscilloscope, and a computer displaying detecting signals.
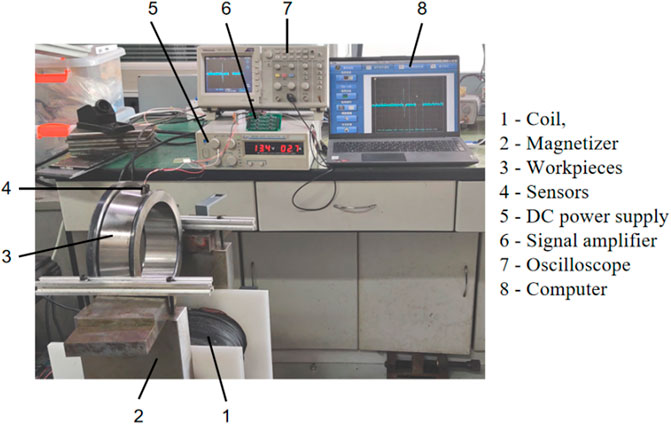
FIGURE 12. Experimental platform for axial detection of the bearing cracks.
In the above experimental platform, the excitation current of the magnetized coil is 4 A, the lifting distance is .05 mm, and the sensor model is TMR2009. Based on the outer circle scanning position in Figure 2 and scanning path in Figure 3, the crack and leakage magnetic signals at different positions of the same crack are obtained by workpiece 1, and the peak and valley value of the signal is calculated. In order to compare the differences of the three signals, the three signals are summarized together. The experimental signal is shown in Figure 13.
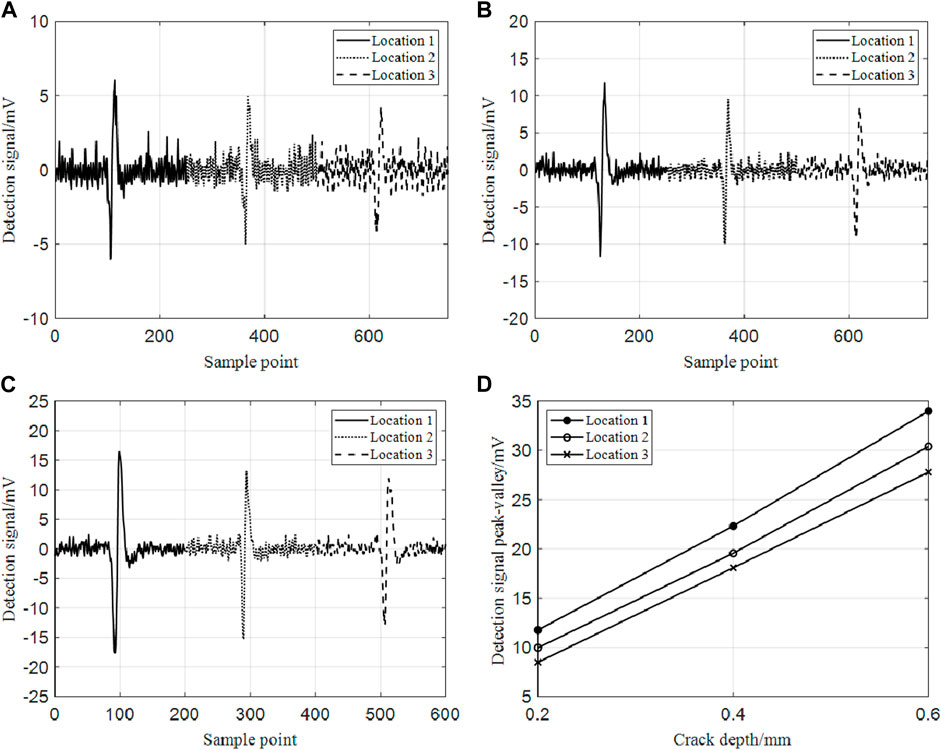
FIGURE 13. (A) Experimental signals on different radius of curvature with a crack depth of 2 mm; (B) Experimental signals on different radius of curvature with a crack depth of .4 mm (C) Experimental signals on different radius of curvature with a crack depth of .6 mm (D) Peak and valley values of the experimental signal of different models bearing rings at different curvature.
Since the sensor obtains the rate of MFL, the signal characteristics of one peak and two valleys in the simulation become symmetrical one peak and one valley. The results in Figure 13 indicate that the detection signal of cracks increases with increasing crack depth. For axial cracks of the same size in the outer bearing ring, the experimental signals scanned by the sensor from three positions are different. From position one to position 3, the surface radius of curvature continuously decreases, but the corresponding experimental signal amplitude continuously decreases. All three sizes of cracks satisfy this law.
Referring to the scanning position in Figure 2 and the scanning path of the inner ring in Figure 3, the crack magnetic flux leakage signal at different positions of the same crack is obtained by workpieces 2, 3, and 4. Afterward, the peak and valley value of the signal is calculated. In order to compare the differences of the three signals, the three signals are summarized together. The experimental signal is shown in Figure 14.
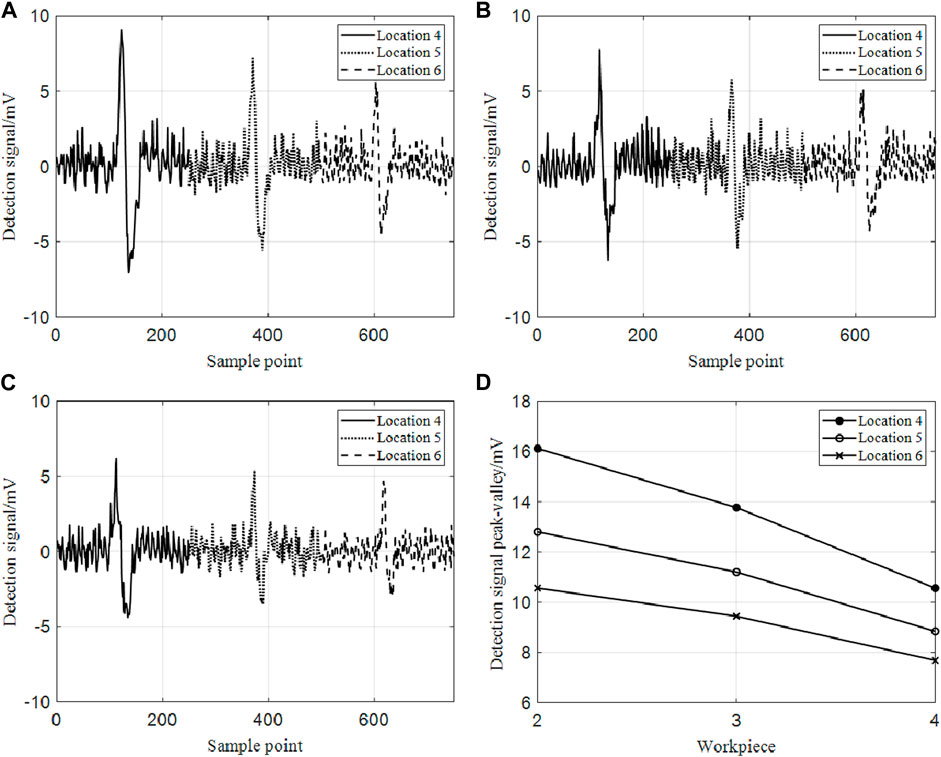
FIGURE 14. (A) The detection signal of workpiece two at different radius of curvature; (B) The detection signal of workpiece three at different radius of curvature; (C) The detection signal of workpiece 4 at different radius of curvature; (D) Peak and valley values of the experimental signal of different models bearing rings at different curvature.
It can be seen that the experimental signals scanned by the sensors from different locations are different for axial cracks of the same size in the inner bearing ring. From position 4 to position 6, the surface radius of curvature continuously increases, but the experimental signal amplitude decreases. Moreover, different types of bearing rings are consistent with this law. The comparison of the signal differences among the three inner rings reveals that more differences are detected at larger conical angles and crack lengths, which is consistent with the result in Section 2.
The above experimental results are consistent with the simulation results in Section 2, validating that the magnetic signal amplitude of crack leakage is inversely proportional to the curvature radius. This law is applicable to different models of bearing rings and different sizes of cracks.
To further verify the effect of the compensation method, the compensation coefficients are calculated at different positions in each bearing ring. The experimental signal after the compensation is depicted in Figure 15. In addition, Table 4 shows the relative change of signal amplitude before and after compensation calculated by Eq. (1).
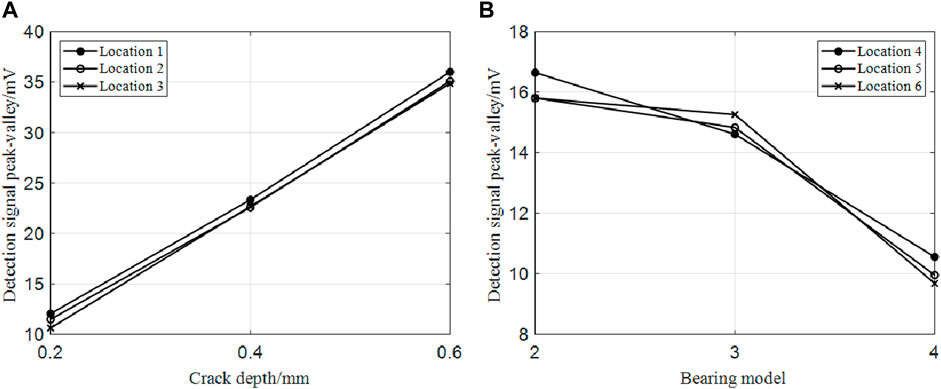
FIGURE 15. (A) Crack signal amplitude after compensation of workpiece 1 (B) Crack detection signal compensated by workpieces 2, 3, and 4.
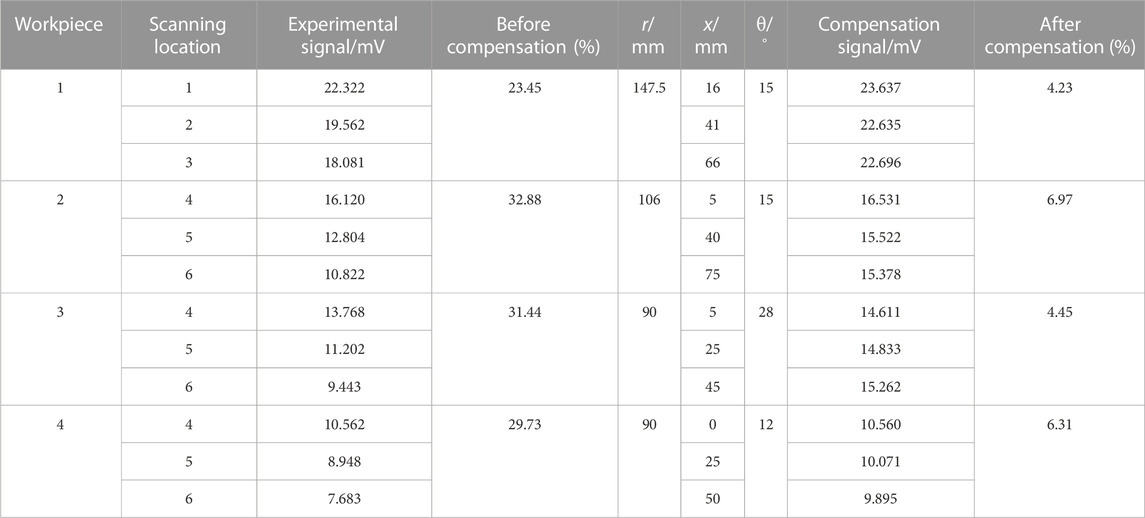
TABLE 4. Relative changes in the experimental signal amplitude before and after compensation.
From Figure 15 and Table 4, the experimental signals of different specification bearing rings at different locations of the same crack are consistent after signal compensation. The relative change of signal amplitude decreases from about 30% to about 5%, verifying the effectiveness of the signal compensation method based on the normalization of surface magnetization.
This study aims to address the problem of axial crack leakage signal, and the conclusions are as follows.
1) Through the finite element simulation, it was found that the surface curvature radius of the bearing ring influenced the surface magnetic field distribution. And the MFL signal decreases with increasing surface curvature radius.
2) Based on the analysis of the parallel magnetic circuit, the difference in magnetization signal at different curvature radius is discussed theoretically, and the compensation method based on surface magnetization normalization is proposed.
3) By constructing an MFL detection platform for the axial crack of the bearing ring, experiments were conducted on different types of bearing rings. The results show that the crack leakage magnetic signal amplitude of bearing rings is inversely proportional to the surface curvature radius, verifying the effectiveness of the compensation method. The relative change of crack leakage signal amplitude ranges from about 30% to about 5%.
The raw data supporting the conclusion of this article will be made available by the authors, without undue reservation.
Conceptualization SQ investigation CC methodology YY Visualization ZL validation GP writing—original draft, GP writing—review and editing YY. All authors have read and agreed to the published version of the manuscript.
This research was funded by the Fundamental Research Funds for the Central Universities (No. 2232022D-20) and the National Natural Science Foundation of China (NNSFC) (No. 51807022).
Author CC is employed by the Luoyang LYC Bearing Co., Ltd.
The remaining authors declare that the research was conducted in the absence of any commercial or financial relationships that could be construed as a potential conflict of interest.
All claims expressed in this article are solely those of the authors and do not necessarily represent those of their affiliated organizations, or those of the publisher, the editors and the reviewers. Any product that may be evaluated in this article, or claim that may be made by its manufacturer, is not guaranteed or endorsed by the publisher.
1. Guo H, Lei J, Wang Y. Common defects and preventive measures for bearing rings. Bearing (2019) 01:66–71. doi:10.19533/j.issn1000-3762.2019.01.015
2. Qu B. Research on large bearing defect detection based on image processing. Liaoning, China: Liaoning Technical University (2012).
3. Yang Y, Yao Y, Li L, Chen C, Min Z. Automatic defect identification method for magnetic particle inspection of bearing rings based on visual characteristics and high-level features. APPLIED SCIENCES-BASEL (2022) 12(3):1293. doi:10.3390/APP12031293
4. Li E, Kang Y, Tang J, Wu J. A new micro magnetic bridge probe in magnetic flux leakage for detecting micro-cracks. J Nondestructive Eval (2018) 37:46. doi:10.1007/s10921-018-0499-8
5. Jóźwik W, Samborski T. Influence of geometrical features of material defects on the identification level by the eddy current method. Solid State Phenomena (2015) 237:136–41. doi:10.4028/www.scientific.net/ssp.237.136
6. Sha J, Fan M, Cao B, Liu B. Noncontact and nondestructive evaluation of heat-treated bearing rings using pulsed eddy current testing. J Magnetism Magn Mater (2021) 521:167516. doi:10.1016/j.jmmm.2020.167516
7. Sun G. Research on ultrasonic testing of aeroengine bearing ring in water immersion. Harbin, China: Harbin Engineering Uni-versity (2019).
8. Soldatov AI, Fiks II, Tsekhanovskii SA. Ultrasonic quality control of thermal treatment of railway bearing rollers. Russ J Nondestructive Test (2010) 46:162–9. doi:10.1134/S1061830910030022
9. Wu Q, Zhu M. Application of image processing sensor and pattern recognition in detection of bearing surface defects. J Sensors (2022) 2022:1–7. doi:10.1155/2022/7924982
10. Zhang L. Design of machine vision algorithm for magnetic powder detection and system development. Beijing, China: Beijing Jiaotong University. (2018).
11. Tout K, Meguenani A, Urban JP, Cudel C. Automated vision system for magnetic particle inspection of crankshafts using convolutional neural networks. Int J Adv Manufacturing Tech (2021) 112(11):3307–26. doi:10.1007/s00170-020-06467-4
12. Feng B, Wu J, Qiu G. Development of high-speed magnetic flux leakage testing method. Nondestructive Test (2021) 43(02):57–63. doi:10.11973/wsjc202102012
13. Wu JB, Tu J, Yang Y, Kang YH. Signal acquisition analysis in hi-speed and hi-precision MFL testing for steel pipe. Adv Mater Res (2013) 718-720:875–80. doi:10.4028/www.scientific.net/amr.718-720.875
14. Long Y, Huang S, Peng L, Wang S, Zhao W. A characteristic approximation approach to defect opening profile recognition in magnetic flux leakage detection. IEEE Trans Instrumentation Meas (2021) 70:1–12. doi:10.1109/TIM.2021.3050185
15. John AF, Bai L, Cheng Y, Yu H. A heuristic algorithm for the reconstruction and extraction of defect shape features in magnetic flux leakage testing. IEEE Trans Instrumentation Meas (2020) 69:9062–71. doi:10.1109/TIM.2020.2998561
16. Qiu Z, Zhang R, Zhang W, Li L. Quantitative identification of microcracks through magnetic flux leakage testing based on improved back-propagation neural network. Insight - Non-Destructive Test Condition Monit (2019) 61:90–4. doi:10.1784/insi.2019.61.2.90
17. Jia Y, Liang K, Wang P, Ji K, Xu P. Enhancement method of magnetic flux leakage signals for rail track surface defect detection. IET Sci Meas Tech (2020) 14:711–7. doi:10.1049/iet-smt.2018.5651
18. Yang Y, Li L, Deng Z, Kang Y. Theoretical analysis and simulation of a new SNR improvement method for the rough surface crack in MFL detection. Int J Appl Electromagnetics Mech (2016) 52:1401–8. doi:10.3233/JAE-162115
19. Feng B. A dissertation submitted in partial fulfillment of the requirements for the degree of doctor of philosophy in engineering. Wuhan, China: Huazhong University of Science and Technology (2016).
20. Feng B, Wu J, Yang Y. Research on magnetization methood for high precision magnetic flux leakage testing of longitudinal decfects in steel pipes. China Mech Eng (2014) 25(6):736–40. doi:10.3969/j.issn.1004-132X.2014.06.006
21. Yang L, Geng H, Gao W. Study on high-speed magnetic flux leakage testing technology based on multi-stage magnetization. Chin J Scientific Instrument (2018) 39(6):148–56. doi:10.19650/j.cnki.cjsi.J1803182
Keywords: magnetic flux leakage, bearing ring, axial crack, radius of curvature, signal consistency
Citation: Yang Y, Peng G, Qiu S, Chen C and Liang Z (2023) Influence of curvature radius on the axial crack signal of the magnetic flux leakage detection for tapered roller bearing rings. Front. Phys. 10:1075549. doi: 10.3389/fphy.2022.1075549
Received: 20 October 2022; Accepted: 28 December 2022;
Published: 10 January 2023.
Edited by:
Maciej Roskosz, AGH University of Science and Technology, PolandReviewed by:
Carlos Frajuca, Federal University of Rio Grande, BrazilCopyright © 2023 Yang, Peng, Qiu, Chen and Liang. This is an open-access article distributed under the terms of the Creative Commons Attribution License (CC BY). The use, distribution or reproduction in other forums is permitted, provided the original author(s) and the copyright owner(s) are credited and that the original publication in this journal is cited, in accordance with accepted academic practice. No use, distribution or reproduction is permitted which does not comply with these terms.
*Correspondence: Guang Peng, 2200945@mail.dhu.edu.cn
Disclaimer: All claims expressed in this article are solely those of the authors and do not necessarily represent those of their affiliated organizations, or those of the publisher, the editors and the reviewers. Any product that may be evaluated in this article or claim that may be made by its manufacturer is not guaranteed or endorsed by the publisher.
Research integrity at Frontiers
Learn more about the work of our research integrity team to safeguard the quality of each article we publish.