 Yue Peng
 Hongxuan Xu1
 Qi Zhu
95% of researchers rate our articles as excellent or good
Learn more about the work of our research integrity team to safeguard the quality of each article we publish.
Find out more
ORIGINAL RESEARCH article
Front. Phys. , 17 November 2022
Sec. Physical Acoustics and Ultrasonics
Volume 10 - 2022 | https://doi.org/10.3389/fphy.2022.1071063
This article is part of the Research Topic Nondestructive Testing, Multi-Field Information Fusion, and AI-Aided Signal Processing View all 7 articles
The structures of short fiber reinforced composites become designable from macroscopic to microscopic due to the advancement in additive manufacturing technologies. The diffuse ultrasonic wave inspection benefits from information from multiple scattering processes, which is suitable for the quality assurance of complex structures. This study established a two-dimensional wave propagation model assuming the decoupling of the fiber volume into the fiber distribution matrix in the plane and the local fiber fraction along the thickness axis. The k-space pseudospectral method was applied to calculate the diffuse wave fields. The defect inspection process was studied numerically based on the Locadiff technique for additive-manufactured short-fiber reinforced composites. The stretching method provided the same average distance but a smaller relative deviation to the defect than the doublet method. The localization resolution improved significantly for the initial increment of the number of transmitters; limited improvement can be achieved further. Localization results fluctuated when the transmitter combination groups were distant from the defect. This method worked well with the isotropic and quasi-isotropic plates, while an oversimplification was found for the unidirectional fiber structure.
Composite structures are widely used in the aviation, machinery, and other domains owing to their high specific strength, specific modulus, and other advantages. Efficient and rapid operation and maintenance (O&M) of composite based mechanical structures is crucial for ensuring high levels of performance and reliability of mechanical equipment. Current health monitoring methods for composite structures include vibration mode monitoring [1], structural strain monitoring [2,3,4], acoustic emission technology [5]; [6], and intelligent coating technology [7]. Among them, the ultrasonic structural health monitoring method, which often distributes piezoelectric sensors [8] inside a structure, is economical and easy to implement. However, the existing centralized and distributed general mechanical equipment structure health monitoring systems are wired-state monitoring systems. An online monitoring system based on a wireless sensor network (WSN) [9] can reduce wiring and lower deployment cost; furthermore, it offers increased flexibility, maintainability, and scalability. Therefore, the application of WSN technology to mechanical equipment online monitoring systems is highly desired. WSNs have been used in a few applications for structural health monitoring. However, many challenges, such as short lifetimes, unreliable communication, and poor real-time performance, should be resolved. Therefore, research on efficient and accurate real-time monitoring methods is crucial for structural health monitoring.
Various ultrasonic techniques can improve imaging quality and efficiency. Thick welded joints can be inspected using laser ultrasound B-scans based on the synthetic aperture focusing technique (SAFT) [10]. Phased array [11] inspection using multiple transmitter-receiver pairs can facilitate full matrix capture (FMC) and full-field imaging with the total focusing method (TFM) to increase inspection efficiency. Wavenumber algorithm [12] is considered to further accelerate the imaging speed in real-time based on the wave equation for the defect inside composites.
Additionally, classical beamforming methods, such as multiple signal classification (MUSIC), can be used to decompose the covariance matrix of an array output data into eigenvalue to obtain the signal subspace corresponding to the signal component and the noise subspace orthogonal to the signal component, which can be used to effectively denoise and extract the characteristic signal [13]. The main features of this signal can be extracted to locate the signal source. Yuan et al. proposed that the near-field two-dimensional (2D)-MUSIC method [14] can simultaneously locate the damage angle and distance in composite structures. Furthermore, Yang et al. proposed the Am MUSIC damage-imaging method [15]. The complete spatial spectrum of a test sample can be generated by quantizing the orthogonal attribute between the inherent signal and noise subspaces of a matrix, and the process is not limited by the number of damages. Bao et al. proposed an anisotropic compensation MUSIC algorithm [16] that can jointly compensate for different types of sensor phase errors to reduce the positioning error. This algorithm was verified through a reinforced composite plate structure to improve the accuracy and reliability of damage positioning. Xu et al. proposed a focused MUSIC algorithm [17] for baseline-free Lamb-wave-based damage location in isotropic materials. The virtual time-reversal technique was used to compensate for the dispersion effect, and the focused signal was truncated to avoid estimating the number of scattering sources and baseline subtraction. Fan et al. used phase-coherent MUSIC [18] for EDM line inspection, which could evaluate its length even when it was oblique to the linear array.
These methods facilitate the localization and imaging of regional damages. However, scattering occurs when applied to complex configurations, such as walls, ribs, corners, and beams in a structure and it interferes with acoustic wave transmission. In this study, we performed inversion imaging of internal defects in various composite structures using multi-channel scattering information to achieve wireless autonomous recognition in combination with WSNs.
A diffuse wave field can be established after multiple scattering in a complex medium like additive manufacted composites. The defect information can be amplified in the help of this field. Suppose the waveforms
where c denotes the wave velocity, x corresponds to the defect location, σ represents the scattering cross-section, and
where CC represents the correlation coefficient and DC denotes the decorrelation coefficient. DC = 0 when the two waveforms are identical and DC = 1 when the two waveforms are absolutely different. Moreover, the decorrelation coefficient is related to the sensitivity kernel function through Eqs 3, 4 as follows:
and
If the composite sample has an isotropic scattering property in an infinite d-dimensional, the average scattering intensity distribution approximates to the diffusion equation solution:
where D denotes the diffusivity and k is the dissipation parameter. A more accurate solution can be obtained from the radiative transfer equation. The first born approximation can be used[21] to study the kernel in weak scattering media if the scattering is not sufficiently strong for the diffusion approximation. More generally, the kernel does not have an analytical form and should be calculated numerically for heterogeneous scattering.
After obtaining DC(S, R, x, t) and K(S, R, r, t), the defect location can be predicted from different inversion algorithms, e.g., linear least square inversion method[22] and Monte Carlo Markov chain method[23]. A classical grid search method[17] was used by searching for the most likely defect position through the cost function:
The probability density of the defect appearance at x is defined in Eq. 7:
where ɛ corresponds to a fluctuation parameter for decorrelations and C denotes a normalization constant.
The internal structure of composites can be classified into microscopic, mesoscopic, and macroscopic scale [24]. The homogenization method is often applied to determine the effective properties of heterogeneous media [25] and to simplify the wave propagation in these structures [26] by keeping the same strain energy between the heterogeneous and homogeneous materials under arbitrary loads. It is an efficient way to balance the computational cost and the calculation accuracy, especially for lamb wave inspection concerning phase velocity or group velocity information in hundreds of kHz [27]. However, diffuse ultrasonic wave inspection simulation demands mesoscopic or even microscopic details to extract diffuse ultrasonic wave fields from the wave-structure interaction. The k-space pseudospectral method [28] was applied for acoustic wave propagation simulation in Matlab software. The material properties of polyamide 12 and short carbon fiber are listed in Table 1. A perfect matched layer was added to eliminate the edge effect.
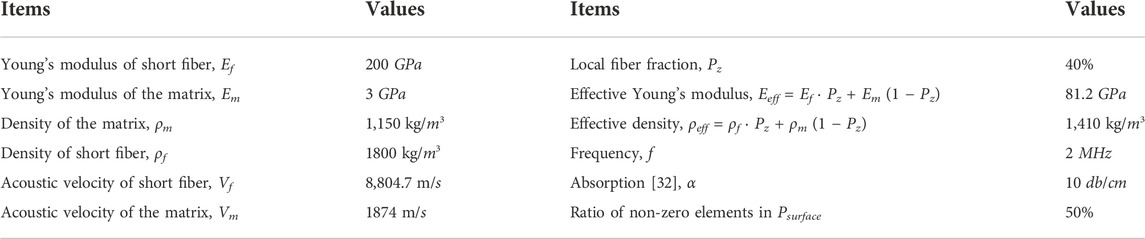
TABLE 1. Material parameters.
In order to simplify the numerical model, the fiber volume fraction
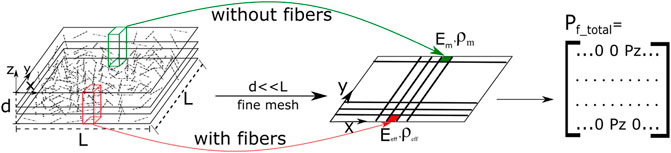
FIGURE 1. Simplified model of additive manufactured short fiber composites.
Since a higher fiber volume fraction will lead to an increasing degree of misalignment from additive manufacturing [29], the local fiber fraction is set to be isotropic. Meanwhile, the high specific strength plate is always thin (d ≪ L) that a constant local fiber fraction of Pz = 40% was applied with 150 × 150 mesh size in the x-y plane. The ratio of non-zero elements in Psurface is assumed to be 50%. The whole defect localization scheme can be shown in Figure 2 below.
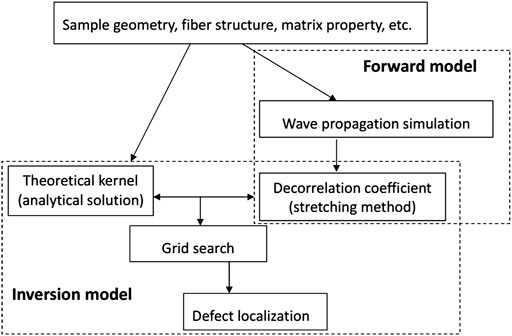
FIGURE 2. Defect localization scheme.
In order to balance between the high attenuation in polymers by keeping relative high sensitivity, the inspection frequency was chosen to be 2 MHz here. A Gussian-shaped toneburst is chosen as the excitation source during simulation. Both its time and frequency domain wavefroms are shown in Figure 3. The plate dimension was 0.45 × 0.45 m2 with the center of a 0.015 × 0.015 m2 rectangular defect positioned at [0.3 m, 0.15 m]. The material properties of the defect such as missing extrudates[30], were assumed to be 80% of those in the initial state. The pitch-catch configuration and the typical waveforms for a random short fiber reinforced composite plate from the pair 3–11 are presented in Figure 4. The diffusivity and the dissipation parameter can be decided from the waveform envelope through the Hilbert transform combing Equation 5, i.e., D = 34 m/s and k = 4.5 × 10³/s. The transport mean free path L* = 2D/c ≈ 2D/((Vf + Vm)/2) = 0.012 m was significantly less than the smallest transmitter-receiver pair distance between the pair 1-1 L1−1 = 0.3 m, ensuring multiple-scattered acoustic wave.

FIGURE 3. The excitation source in (A) time domain (B)frequency domain.
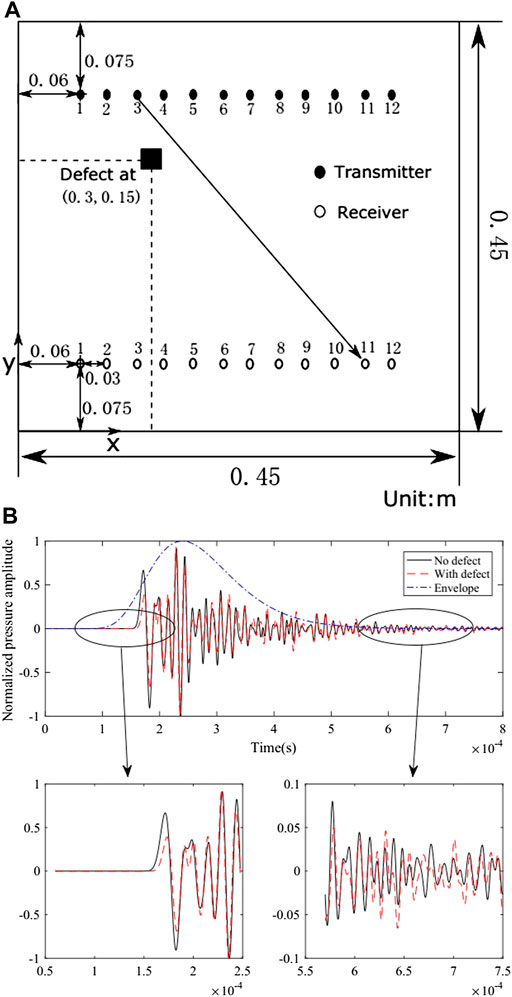
FIGURE 4. (A)Plate dimension and measurement scheme (B)Representative waveforms for the pair 3–11.
According to Eq. 2, the correlation or decorrelation coefficient can be determined from the waveforms with and without the defect. The doublet method (or cross-spectral moving-window method) and the stretching methods are often used for coefficient calculation. Both methods are influenced by the correlation window width (W). By applying the doublet method, the correlation coefficient of the pair 3–11 (Figure 5) at t = 0.6 m varied between 0.56 and 0.69 when W changes (W = 30 µs, 60 μs and 90 µs).
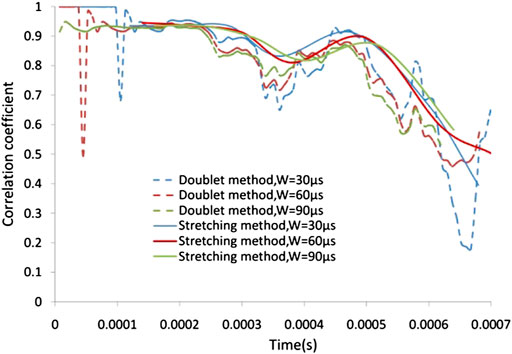
FIGURE 5. Comparison between doublet method and stretching method for the waveforms from the pair 3 − 11
The localization precision would be further influenced by such variation if only the transmitter positions 1–3 were adopted with receiver positions 1–12 fixed. The average distance (AD) to the defect and relative deviation (RD)were 0.029 m and 8.4, respectively. Such ambiguity can be prevented by adding more transmitters (Figure 6), i.e., AD = 0.016 and RD = 3.5% with all the transmitter positions. On the contrary, the stretching method gives a stable and smooth correlation coefficient between 0.64 and 0.68 at t = 0.6 m. As shown in Figure 6, the corresponding AD values were nearly identical to those obtained from the doublet method. However, RD from the stretching method decreased to 2.8% with transmitter positions 1–3 and approached zero with more transmitter positions. The stretching method with the superior coefficient calculation stability was further applied in this study.
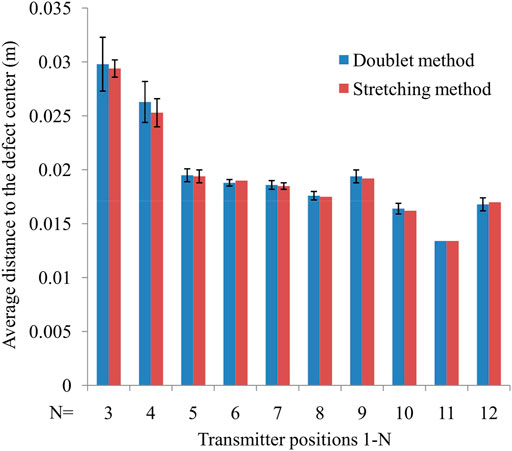
FIGURE 6. The average distances using different transmitters. Error bars represent the standard deviation ranges.
Diffuse ultrasonic waves can magnify the defects that are influenced by multiple scattering. The defect can be influenced by the diffuse field after a long time at a random position, enabling defect localization. The transmitter-receiver number and distribution optimization always remain problematic for reasonable inspection efficiency. Only the influence of transmitters was studied, keeping the receivers fixed due to the repeatability and reciprocity of the diffuse ultrasonic wave inspection [31]. The different combinations can be adopted for a defined number of transmitters. Increasing the number of transmitters provided a better defect localization resolution with a decreasing standard deviation, as shown in Figure 7. The average distance converged to 0.016 m, and six random transmitters were sufficient for this plate. Limited localization precision can be improved with more transmitters added.
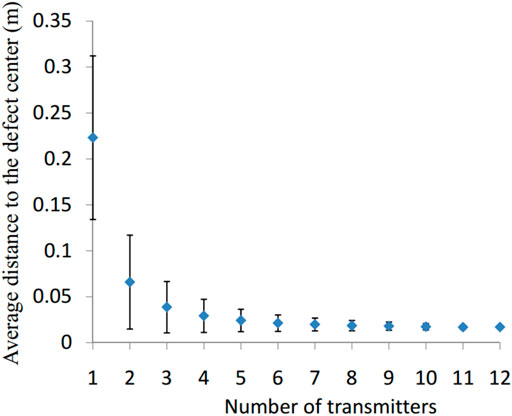
FIGURE 7. The average distance error to the defect center from different number of transmitters. Error bars represent the standard deviation ranges.
The localization deviation not only depends on the number of transmitters, but also on the transmitter distribution. When 3 transmitters are chosen among the total 12 ones, 220 combinations can be expected with different root-mean-square-distances (RMSD) to the defect. As shown in Figure 8A, the distance prediction error increases when the RMSDof the transmitter group increases. A consistent value can be found for the transmitter group near the defect (RMSD < 0.2 m). There is an increasing error when the transmitter group becomes far from the defect (RMSD > 0.2 m). When 8 transmitters are adopted with 495 combinations, a much more consistent value can be observed in Figure 8B. However, the distance value still becomes scatter when the transmitters are far from the defect location. For a real panel, the defect locations are always unknown. Such fluctuation information can also help to verify the proper number and distribution through combination changes in experiments.

FIGURE 8. Distance to the defect center with different transmitter distribution (A) Number of transmitters = 3 (B) Number of transmitters = 8.
Additive manufacturing enables structure design with short fibers in composites. The mesoscopic structure can vary significantly regarding to the physical property requirement during the design stage under the same ratio of non-zero elements in the P surface. Different multiple scattering behavior during diffuse ultrasonic wave inspection should be considered.
Three typical additive manufactured composite plates were investigated; they are shown in Figures 9A–C with a random pattern, plain weave pattern, and unidirectional pattern, respectively. They have isotropic, quasi-isotropic, and anisotropic macro mechanical properties, respectively. Their corresponding scattering behaviors can be found in Figures 9D–F. The defect localization results can be found in Figures 9G–I under the full transmitter-receiver implementation with the material properties listed in Table 1. The result shows that the localized defect coordinate is at [0.294 m, 0.134 m] for the random pattern with a small error of
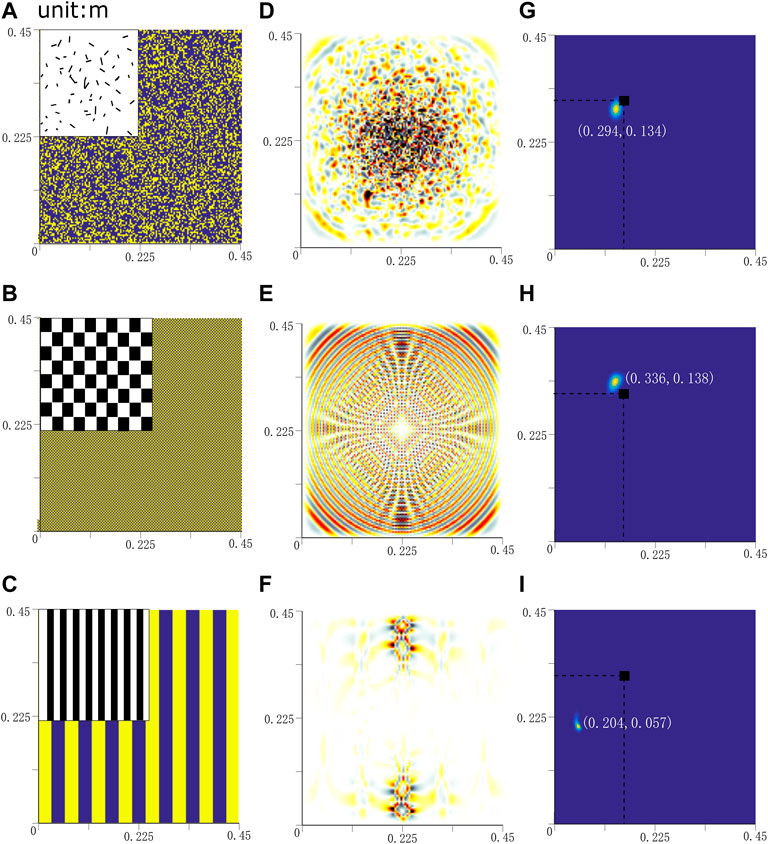
FIGURE 9. Diffuse ultrasonic wave pattern (D)–(F) and localization result (G)–(I) in different additive manufactured short fiber reinforced composites (A)–(C).
Additive manufactured fiber-reinforced polymer composites can possess complex structures from macroscopic to microscopic scales, making their quality assurance difficult. The diffuse ultrasonic wave inspection relies on the multiple scattering domain that contains rich structure information. The Locadiff technique is processed based on a simplified 2D mechanical model by homogenization along the thickness direction. The stretching method was more stable than the doublet method for correlation/decorrelation coefficient calculation and enabled reliable defect localization. An increasing number of transmitters improved the localization precision. However, the localization results fluctuated from the transmitter combination groups that were distant from the defect. The numerical investigation indicated that this method works well with isotropic and quasi-isotropic composite plates with the errors of 3.8% and 8.4%respectively. Further exploration for the defect localization in additive manufactured parts concerning anisotropic scattering and signal processing is expected.
The original contributions presented in the study are included in the article/Supplementary Material, further inquiries can be directed to the corresponding author.
YP, JZ, and QZ contributed to conception and design of the study. YP organized the database and performed the formal analysis. QZ wrote the first draft of the manuscript. HX, JS, JZ, and YP wrote sections of the manuscript. All authors contributed to manuscript revision, read, and approved the submitted version.
This work was supported in grants from State key laboratory of precision measuring technology and instruments (Grant No: pilab2209) and Shanghai Polytechnic University (Grant No: EGD21QD23 and EGD22DS08).
The authors declare that the research was conducted in the absence of any commercial or financial relationships that could be construed as a potential conflict of interest.
All claims expressed in this article are solely those of the authors and do not necessarily represent those of their affiliated organizations, or those of the publisher, the editors and the reviewers. Any product that may be evaluated in this article, or claim that may be made by its manufacturer, is not guaranteed or endorsed by the publisher.
1. Zhang C, Mousavi AA, Masri SF, Gholipour G, Yan K, Li X. Vibration feature extraction using signal processing techniques for structural health monitoring: A review. Mech Syst Signal Process (2022) 177:109175. doi:10.1016/j.ymssp.2022.109175
2. Tserpes K, Karachalios V, Giannopoulos I, Prentzias V, Ruzek R. Strain and damage monitoring in cfrp fuselage panels using fiber Bragg grating sensors. part i: Design, manufacturing and impact testing. Compos Structures (2014) 107:726–36. doi:10.1016/j.compstruct.2013.09.053
3. Bergmayr T, Winklberger M, Kralovec C, Schagerl M (2020). Strain measurements along zero-strain trajectories as possible structural health monitoring method for debonding initiation and propagation in aircraft sandwich structures. Proced Struct Integrity 28, 1473–80. doi:10.1016/j.prostr.2020.10.1211st Virtual European Conference on Fracture - VECF1
4. Chandra Sahoo P, Nimje S, Roy S. Strain based structural health monitoring of stiffened composite plate. Mater Today Proc (2022). doi:10.1016/j.matpr.2022.09.432
5. Guo S, Ding H, Li Y, Feng H, Xiong X, Su Z, et al. A hierarchical deep convolutional regression framework with sensor network fail-safe adaptation for acoustic-emission-based structural health monitoring. Mech Syst Signal Process (2022) 181:109508. doi:10.1016/j.ymssp.2022.109508
6. Masmoudi S, El Mahi A, Turki S. Fatigue behaviour and structural health monitoring by acoustic emission of e-glass/epoxy laminates with piezoelectric implant. Appl Acoust Multiphysic Syst (2016) 108:50–8. doi:10.1016/j.apacoust.2015.10.024
7. Li Y, Feng W, Meng L, Tse KM, Li Z, Huang L, et al. Investigation on in-situ sprayed, annealed and corona poled pvdf-trfe coatings for guided wave-based structural health monitoring: From crystallization to piezoelectricity. Mater Des (2021) 199:109415. doi:10.1016/j.matdes.2020.109415
8. Su Z, Ye L, Lu Y. Guided lamb waves for identification of damage in composite structures: A review. J Sound Vibration (2006) 295:753–80. doi:10.1016/j.jsv.2006.01.020
9. Loubet G, Takacs A, Dragomirescu D. Implementation of a battery-free wireless sensor for cyber-physical systems dedicated to structural health monitoring applications. IEEE Access (2019) 7:24679–90. doi:10.1109/ACCESS.2019.2900161
10. Lévesque D, Asaumi Y, Lord M, Bescond C, Hatanaka H, Tagami M, et al. Inspection of thick welded joints using laser-ultrasonic saft. Ultrasonics (2016) 69:236–42. doi:10.1016/j.ultras.2016.04.001
11. Holmes C, Drinkwater BW, Wilcox PD. Post-processing of the full matrix of ultrasonic transmit–receive array data for non-destructive evaluation. NDT E Int (2005) 38:701–11. doi:10.1016/j.ndteint.2005.04.002
12. Zhang H, Ren Y, Song J, Zhu Q, Ma X. The wavenumber imaging of fiber waviness in hybrid glass–carbon fiber reinforced polymer composite plates. J Compos Mater (2021) 55:4633–43. doi:10.1177/00219983211047692
13. Schmidt RO. A signal subspace approach to multiple emitter location and spectral estimation. United States: Stanford University (1982).
14. Yuan S, Zhong Y, Qiu L, Wang Z. Two-dimensional near-field multiple signal classification algorithm–based impact localization. J Intell Mater Syst Structures (2015) 26:400–13. doi:10.1177/1045389X14529026
15. Yang X, Wang K, Zhou P, Xu L, Liu J, Sun P, et al. Ameliorated-multiple signal classification (am-music) for damage imaging using a sparse sensor network. Mech Syst Signal Process (2022) 163:108154. doi:10.1016/j.ymssp.2021.108154
16. Bao Q, Yuan S, Wang Y, Qiu L. Anisotropy compensated music algorithm based composite structure damage imaging method. Compos Structures (2019) 214:293–303. doi:10.1016/j.compstruct.2019.02.036
17. Xu C, Wang J, Yin S, Deng M. A focusing music algorithm for baseline-free lamb wave damage localization. Mech Syst Signal Process (2022) 164:108242. doi:10.1016/j.ymssp.2021.108242
18. Fan C, Yang L, Zhao Y. Ultrasonic multi-frequency time-reversal-based imaging of extended targets. NDT E Int (2020) 113:102276. doi:10.1016/j.ndteint.2020.102276
19. Rossetto V, Margerin L, Planès T, Larose R. Locating a weak change using diffuse waves: Theoretical approach and inversion procedure. J Appl Phys (2011) 109:034903. doi:10.1063/1.3544503
20. Planes T, Larose E, Rossetto V, Margerin L. Locadiff: Locating a weak change with diffuse ultrasound. AIP Conf Proc (2013) 1511:405–11. doi:10.1063/1.4789076
21. Pacheco C, Snieder R. Time-lapse traveltime change of singly scattered acoustic waves. Geophys J Int (2006) 165:485–500. doi:10.1111/j.1365-246X.2006.02856.x
22. Planès T, Larose E, Rossetto V, Margerin L. Imaging multiple local changes in heterogeneous media with diffuse waves. The J Acoust Soc America (2015) 137:660–7. doi:10.1121/1.4906824
23. Xie F, Moreau L, Zhang Y, Larose E. A bayesian approach for high resolution imaging of small changes in multiple scattering media. Ultrasonics (2016) 64:106–14. doi:10.1016/j.ultras.2015.08.005
24. Broucke BVD, Hamila N, Lomov SV, Boisse P, Verpoest I. Determination of the mechanical properties of textile-reinforced composites taking into account textile forming parameters. Int J Mater Form (2010) 3:1351–61. doi:10.1007/s12289-009-0680-9
25. Biwa S, Kamiya T, Ohno N. Multiple scattering simulation of ultrasonic shear wave in unidirectional carbon/epoxy composites. Mater Trans (2007) 48:1196–201. doi:10.2320/matertrans.I-MRA2007846
26. Hosseini SMH, Willberg C, Kharaghani A, Gabbert U. Characterization of the guided wave propagation in simplified foam, honeycomb and hollow sphere structures. Composites B: Eng (2014) 56:553–66. doi:10.1016/j.compositesb.2013.08.077
27. Weber R, Hosseini SMH, Gabbert U. Numerical simulation of the guided lamb wave propagation in particle reinforced composites. Compos Structures (2012) 94:3064–71. doi:10.1016/j.compstruct.2012.04.020
28. Treebya BE, Jaros J, Rendell AP, Cox BT. Modeling nonlinear ultrasound propagation in heterogeneous media with power law absorption using a k-space pseudospectral method. J Acoust Soc America (2012) 131:4324–36. doi:10.1121/1.4712021
29. Scholz M-S, Drinkwater B, Trask R. Ultrasonic assembly of anisotropic short fibre reinforced composites. Ultrasonics (2014) 54:1015–9. doi:10.1016/j.ultras.2013.12.001
30. Fayazbakhsh K, Movahedi M, Kalman J. The impact of defects on tensile properties of 3d printed parts manufactured by fused filament fabrication. Mater Today Commun (2019) 18:140–8. doi:10.1016/j.mtcomm.2018.12.003
31. Kino GS. The application of reciprocity theory to scattering of acoustic waves by flaws. J Appl Phys (1978) 49:3190–9. doi:10.1063/1.325312
Keywords: diffuse ultrasonic wave, defect localization, short fiber reinforced composite, additive manufacturing, structural health monitoring
Citation: Peng Y, Xu H, Sun J, Zuo J and Zhu Q (2022) Numerical study of defect localization in additive manufactured short fiber reinforced composites with diffuse ultrasonic wave inspection. Front. Phys. 10:1071063. doi: 10.3389/fphy.2022.1071063
Received: 15 October 2022; Accepted: 03 November 2022;
Published: 17 November 2022.
Edited by:
Jianbo Wu, Sichuan University, ChinaReviewed by:
Jiang Xu, Huazhong University of Science and Technology, ChinaCopyright © 2022 Peng, Xu, Sun, Zuo and Zhu. This is an open-access article distributed under the terms of the Creative Commons Attribution License (CC BY). The use, distribution or reproduction in other forums is permitted, provided the original author(s) and the copyright owner(s) are credited and that the original publication in this journal is cited, in accordance with accepted academic practice. No use, distribution or reproduction is permitted which does not comply with these terms.
*Correspondence: Qi Zhu, UV9aSFVAc2h1LmVkdS5jbg==
Disclaimer: All claims expressed in this article are solely those of the authors and do not necessarily represent those of their affiliated organizations, or those of the publisher, the editors and the reviewers. Any product that may be evaluated in this article or claim that may be made by its manufacturer is not guaranteed or endorsed by the publisher.
Research integrity at Frontiers
Learn more about the work of our research integrity team to safeguard the quality of each article we publish.