- 1School of Marine Science and Technology, Northwestern Polytechnical University, Xi’an, China
- 2Shaanxi Key Laboratory of Underwater Information Technology, Northwestern Polytechnical University, Xi’an, China
Single-receiver motion parameter estimation is an effective and economical technology for passive source localization and train-bearing fault diagnosis, in which time-consuming time-frequency analysis (TFA) methods are widely used to suppress noise when extracting the continuous Doppler shift of the overhead pass. Cross-spectrum processing is a potential way to improve the computational efficiency of TFA methods, but its application is overshadowed by the phenomena of unknown Doppler shift offset and power spectrum estimation error. In this paper, conventional cross-spectrum processing is proven to be an approximation trick for power spectrum estimation in a small frequency interval, and the two phenomena are fully explained by the frequency aliasing of bandpass sampling and the approximation error. On this basis, an revised framework for applying the cross-spectrum processing is provided. Processing results of the SWellEx-96 experiment data demonstrate that the computational efficiencies of spectrogram and a parameterized TFA method could be improved up to 85% and 88.2%, respectively, without a noticeable impact on the accuracy of parameter estimates.
1 Introduction
Received single-frequency noise, which frequency changes with time dramatically during the overhead pass, contains lots of information about the moving target. By fitting the observed time-varying instantaneous frequency (IF) curve of these tones with the model of Doppler shift under the nonlinear least squares criterion, the Doppler-related parameters, e.g., the radiated frequency, the moving speed, and the shortest distance between the receiver and the target, can be estimated easily and economically with only a single receiver. The conventional application of this single-receiver parameter estimation method are source recognition, classification and localization [1]. In addition, this method is also able to be jointed with the bearing fault identification methods [2, 3] and serves for train-bearing fault diagnosis [4, 5] through an non-contact way in wayside during the running of a train.
Many studies have addressed the estimation of Doppler-related parameters from the line spectrum with a single receiver, where the key point of these studies is how to extract the IF curve from the received tones. The earliest approach may be the phase interpolation method, Ferguson [6] used it to observe and compare the variation with time of the aircraft’s blade rate from the received tones of a microphone on land and a hydrophone beneath the sea. Then Ferguson and Quinn [1] introduced time-frequency analysis (TFA) methods to obtain an more accurate estimation for the aircraft’s blade rate. Because the parameter estimation precision is primarily determined by the accuracy of the extracted IF curve, many of the advanced TFA methods [7–11] have been investigated to suppress noise and concentrate energies for IF contents. Nevertheless, against the classical short-time Fourier transform (STFT, also called a spectrogram), these more effective TFA methods are highly inefficient in computation [10, 11].
Cross-spectrum processing is a potential way to improve the computational efficiency of TFA methods. Rakotonarivo and Kuperman [12] have shown that the radial velocity feature between a moving tone source and a fixed receiver can be quickly ascertained from the cross-spectrum of sound pressures. Yang et al. [13] derived the same results in a different way. Build on this knowledge cross-spectrum processing has been extended to scenarios of a single vector hydrophone [14] and a multi-tone source [15]. However, this method requires precise knowledge regarding the frequency of radiated tones to determine the time interval of the cross-spectrum processing, which should be strictly an integer multiple of the period of the tone signal. If a time interval of a non-integral multiple of the period of the tone signal is utilized, an unknown offset, which has been confirmed by Wang et al. [16], will be brought into the estimates of the radial velocity and will prevent the motion parameter estimation. In addition, it is found that false IF curves of Doppler shift exist occasionally and can not be predicted by the cross-spectrum theory. Apparently these two phenomena leads to the inability of this cross-spectrum method to general applications.
This paper analyzes reasons behind the two unwelcome phenomena and tries to perfect the way of applying cross-spectrum processing in parameter estimations. The main content is organized as follows. Section 2 discusses reasons behind the two unwelcome phenomena. Section 3 outlines the revised framework of applying the cross-spectrum processing for the fast parameter estimation and explains its details for implementation. Section 4 verifies the computational efficiency of the revised framework with the received tones in the event S5 of the SWellEx-96 experiment. Finally, Section 5 draws some conclusion.
2 A deep understanding about the cross-spectrum method
2.1 Conventional cross-spectrum method
Conventional cross-spectrum method [12] is proposed in the community of underwater acoustics. According to the normal mode theory [17], the expression of sound pressures in ocean waveguide under general conditions is:
where
Q is a constant, r is the horizontal distance between the receiver and the point source, z is the receiver depth, zs is the source depth, M is the number of propagating modes, and ψm and krm are the modal depth function and the horizontal wavenumber of the mth mode, respectively.
Assume that r is the distance between a moving source and a receiver at time t, and the corresponding radial velocity is vr, which satisfies Δr = vrΔt in a small time interval. Then, sound pressures at
The cross spectrum of these two sound pressures
where
Because the oscillations of
In cross-spectrum method, the sound pressures of a given frequency f0 at different times are extracted from the spectrogram of the received time series. Then, oscillation frequency
2.2 Phenomenon of Doppler shift offset and its interpretation
A problem in applications of the conventional cross-spectrum method is that the method requires precise knowledge regarding the frequency of the tone signal, i.e., f0, to determine the time difference Δ between two adjacent segments in the spectrogram, where Δ should be a strict integer multiple of the period of f0. However, in general applications, f0 is often not accurately known and the sampling frequency fs may be a non-integral multiple of f0. As a result, an appropriate Δ is hard to be determined and f0 will not appear in the frequency axis of the spectrogram, one can only extract sound pressures from the closest frequency point to f0. In such a case, as shown in Figure 1, slight changes of Δ produce an remarkable offset to the oscillation frequency
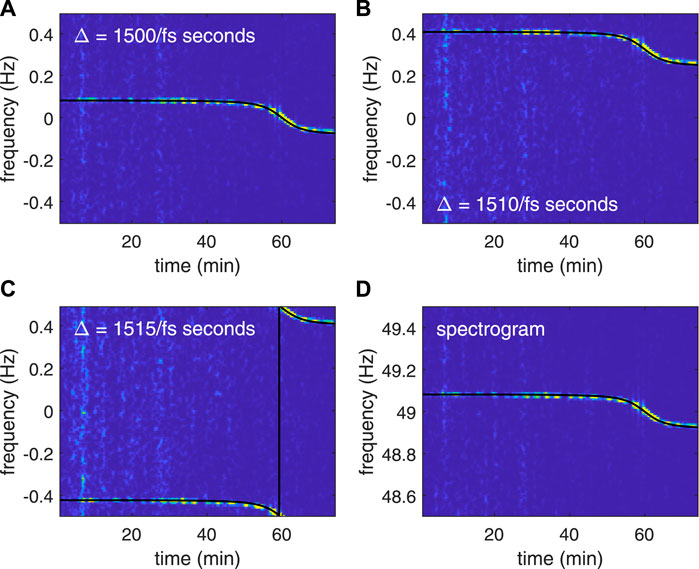
FIGURE 1. The SWellEx-96 signal used in Section 4 is employed to illustrate the phenomenon of Doppler shift offset. The sampling rate of the signal is fs = 1,500 Hz. (A–C) illustrate, respectively, the TFDs produced by the conventional cross-spectrum method (i.e., the step R2.3 of F-STFT without compensation) with different lengths of the spectral window Nw1 = [1,500, 1,510, 1,515] in sound pressures extraction. Black curves represent the IF curves of each TFD predicted by the bandpass sampling theorem. Frequency axes of these TFDs represent oscillation frequency
Loosely, the procedure of extracting sound pressures from the spectrogram can be regarded as a procedure of resampling to the received time series with sampling rate fs = 1/Δ. Bandpass sampling theorem [18] shows that, if a tone is sampled at a frequency that less than the Nyquist sampling rate, its real frequency f0 will be misrepresented by an aliased frequency
at any sampling time t = nΔ, where n is the positive integer and the function
The black curves in the Figures 1A–C represent the aliased IF trajectories predicted by the bandpass sampling theorem. One can see that these curves are consistent well with the IF trajectories of each TFD.
2.3 Phenomenon of power spectrum error and its interpretation
As shown in Figures 2A,D, the TFD of the cross-spectrum method and that of the spectrogram may be different sometimes. Although bandpass sampling theory provides a well interpretation for the offset phenomenon, the theory can not interpret such a difference because power spectrum of the real frequency and the aliased frequency should be equal according to Eq. 6. Therefore, technically the procedure of extracting sound pressures from the spectrogram is not a procedure of bandpass sampling.
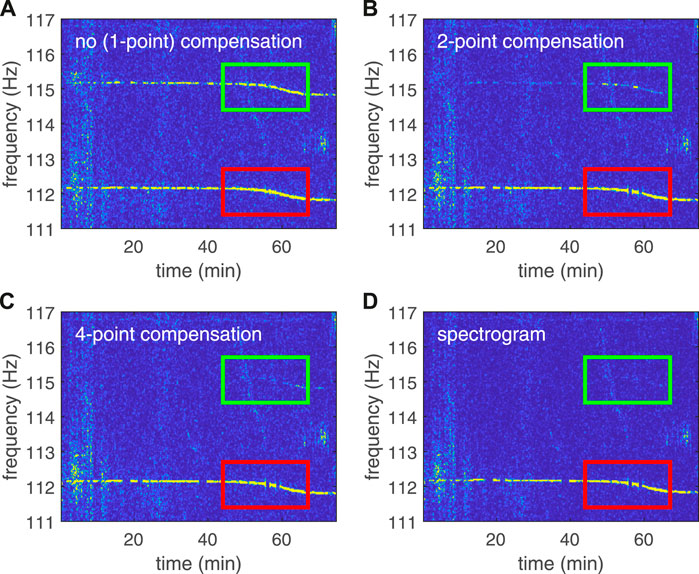
FIGURE 2. The SWellEx-96 signal used in Section 4 is employed to illustrate the phenomenon of power spectrum error. (A–C) illustrate, respectively, the TFDs produced by Eq. 9 (i.e., the step R2.4 of F-STFT) with different compensations, where the length of the spectral window Nw1 = 500. The aliased IF trajectories has been mapped into the real frequency band by a contrary procedure of aliasing. (D) Shows the TFD produced by STFT. The green rectangles show the changes of an aliased IF trajectory with the increase of compensation points, and the red rectangles show the changes of the target IF trajectory with the increase of compensation points. It can be seen that a few compensation points are able to give a good approximation for the spectrogram if the phenomenon of power spectrum error occurs.
In the cross-spectrum method, the radial velocity is estimated from the cross-spectrum of pressures (i.e., p(t + Δ)p*(t), p(t + 2Δ)p*(t), ⋯ ). According to the linearity property of Fourier transform, the Fourier spectrum of p(t + Δ)p*(t), p(t + 2Δ)p*(t), ⋯ equals the weighted (by p*(t)) Fourier spectrum of p(t + Δ), p(t + 2Δ), ⋯ . Because multiplying a constant p*(t) does not induce useful information of radial velocity, the information of radial velocity should be included in the Fourier spectrum of p(t + Δ), p(t + 2Δ), ⋯ . Therefore, the cross-spectrum processing (i.e., multiplying the p*(t)) is unnecessary and can be omitted to simplify processing steps. In addition, note that the pressures p(t + Δ), p(t + 2Δ), ⋯ are extracted from the spectrogram of the received time series in practice but are not directly time-sampled from the received signals as a conventional manner of sampling does, these two sampling manners are not of equivalence as analyzed below.
Suppose that
where k = 0, 1, …, NM − 1.
Defining
where k1 = 0, 1, …, N − 1. If
Further, the DFT of row k1 of Y1 at frequency
where the function
Eq. 10 shows that the Fourier spectrum of pressures p(t + Δ), p(t + 2Δ), ⋯ can be regarded as only an approximation for that of the received time series in a narrow frequency band, where the frequency band corresponds with that indicated by the bandpass sampling theory (i.e., Eq. 6). Therefore, one can safely map the aliased IF trajectories into the real frequency band by a contrary procedure of aliasing. Obviously, this approximation allows for the improvement of the computational efficiency by using shorter N-point DFT and M-point DFT to substitute a longer NM-point DFT.
As is shown in Figure 3A, because Y2 = Y holds true only when k2 = 0 and the effect of the term
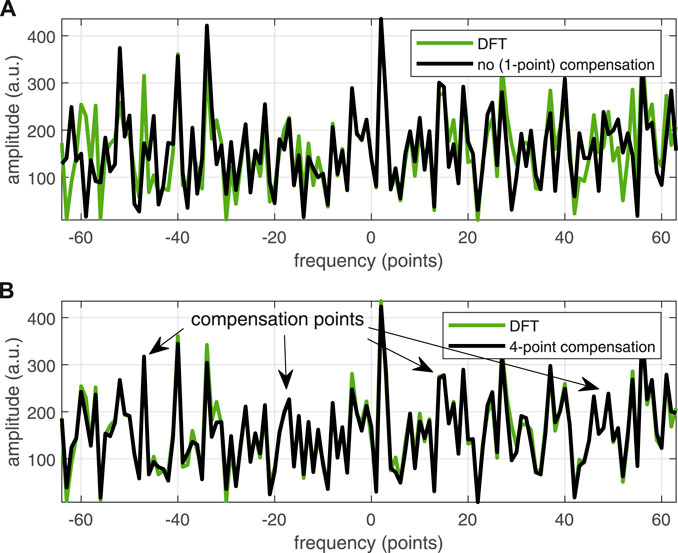
FIGURE 3. Power spectrum of an random sequence given by Eq. 7 (green curves) and Eq. 9 (black curves) with N = 64, M = 128. (A) No compensation, default k2 = 0. (B) Four-point compensation, k2 = −48, −16, 15, 47. Note that the horizontal axis, i.e., k2, is limited to
Figures 2B,C depict the TFDs computed by Eq. 9 with 2-point compensation and 4-point compensation, respectively. As the green rectangles and the red rectangles show, a few compensation points are able to significantly reduce the TFD difference between the approximate method and the spectrogram.
3 An revised parameter estimation framework of applying cross-spectrum processing
The processing framework for fast parameter estimations based on Eq. 9, together with the conventional framework of motion parameter estimations, are shown in Figure 4, where STFT and Doppler chirplet transform (DopplerCT) [10] are employed as the representatives of the conventional and the advanced TFA methods, respectively. For ease of description, these two TFA methods implemented based on Eq. 9 are denoted below as F-STFT and F-DopplerCT. Note that the first iteration of parameterized TFA methods (DopplerCT and F-DopplerCT) needs some configuration parameters, these parameters are initialized by the estimates of the conventional non-parameterized methods (STFT and F-STFT) in Figure 4. Therefore, STFT can be regarded as the 0th iteration of DopplerCT, and consequently, the processing with STFT is always faster than the processing with DopplerCT. Same goes for the relationship of F-STFT and F-DopplerCT.
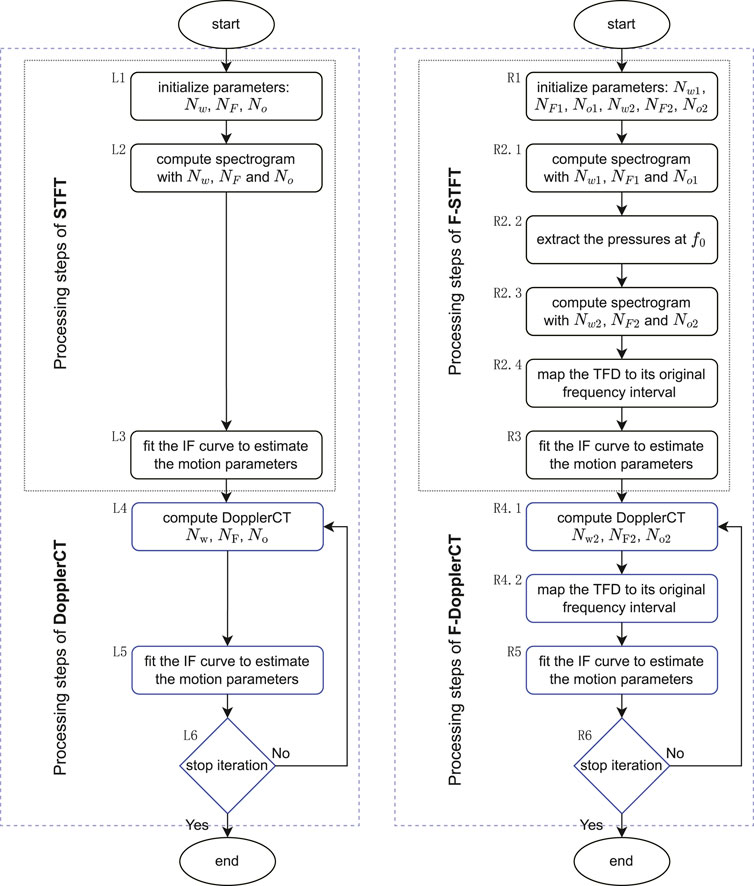
FIGURE 4. Flowcharts to illustrate the conventional framework (the left flowchart) and the suggested framework for fast parameter estimations (the right flowchart). The tags R1-R5 and L1-L5 indicate each step of the two flowcharts.
Figure 4 shows clearly that the main difference of the proposed framework to the conventional framework is the way of computing the TFD, where only the spectrum on a narrow band around f0 is computed (in an approximate manner) through the steps R2 and R4, instead of computing the Fourier spectrum in the whole frequency band of Nyquist (±fs/2) through the steps L2 and L4. The main parameters involved in the two frameworks are the length of the spectral window, the number of overlapped samples, and the number of DFT points to compute the TFD, they are denoted as {Nw, No, NF}, {Nw1, No1, NF1}, and {Nw2, No2, NF2} in different steps. Without a loss of generality, the number NF is assumed that can be resolved (strictly or just approximately) into two factors NF1 and NF2, i.e., NF = NF1NF2, so that the conventional and proposed frameworks perform with the same time-frequency resolution and are comparable. NF1 determines the bandwidth of a TFD (e.g., the bandwidth in Figure 5 is fs/NF1 = 1 Hz). To hold true for Eq. 9, Nw1 should be equal to NF1 and No1 to 0, i.e., no zero padding and overlapping in step R2.1. NF2 determines the frequency resolution of a TFD, which are

FIGURE 5. TFDs of the 112Hz tone that given by different methods : (A) STFT, (B) F-STFT, (C) DopplerCT, (D) F-DopplerCT. It is clearly shown that the two fast methods is able to generate almost the same TFDs as STFT and DopplerCT.
4 Experimental example
The SWellEx-96 experiment [19] was conducted in 1996 in the littoral waters outside the port of San Diego. The experimental data of event S5 are used to validate the effectiveness of the proposed framework. In S5, a source was towed at a constant speed of five knots (2.5 m/s) along a linear track. It transmitted numerous tonals of various source levels between 49 Hz and 400 Hz. The first five tones of the “High Tonal Set” (49 Hz, 64 Hz, 79 Hz, 94 Hz, and 112 Hz), which were projected at maximum level of approximately 158 dB and received by the shallowest element (at a depth of 94.125 m) of a vertical line array, are analyzed below. The sampling rate of the signal is fs = 1,500 Hz.
Figure 5 illustrates, respectively, the TFDs of the 112 Hz tone produced by STFT, F-STFT, DopplerCT, and F-DopplerCT. The parameters used for computing these TFDs are Nw1 = NF1 = 1,500, No1 = 0, Nw2 = NF2 = 200, No2 = 180, Nw = NF = Nw1Nw2, and No = Nw1No2. Note that only one iteration is performed to render a high energy concentration by DopplerCT and F-DopplerCT because in this example the signal-to-noise rate is very high. It is obvious that F-STFT and F-DopplerCT generate TFDs that are almost the same as STFT and DopplerCT. Following the frameworks shown in Figure 4, the source ranges estimated from the IF trajectories depicted in Figure 5, together with the GPS records, are shown in Figure 6. It can be seen that these estimated source ranges are in good agreement with the GPS records.
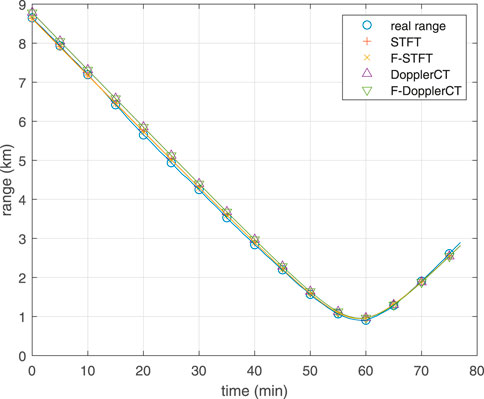
FIGURE 6. Comparison of the source range given by GPS records and that estimated from the IF curves depicted in Figure 5.
Figure 7 depicts the processing results for all five tones. In Figures 7A,B, normalized cross correlation (NCC) is used to quantify the similarity between two TFDs,
where
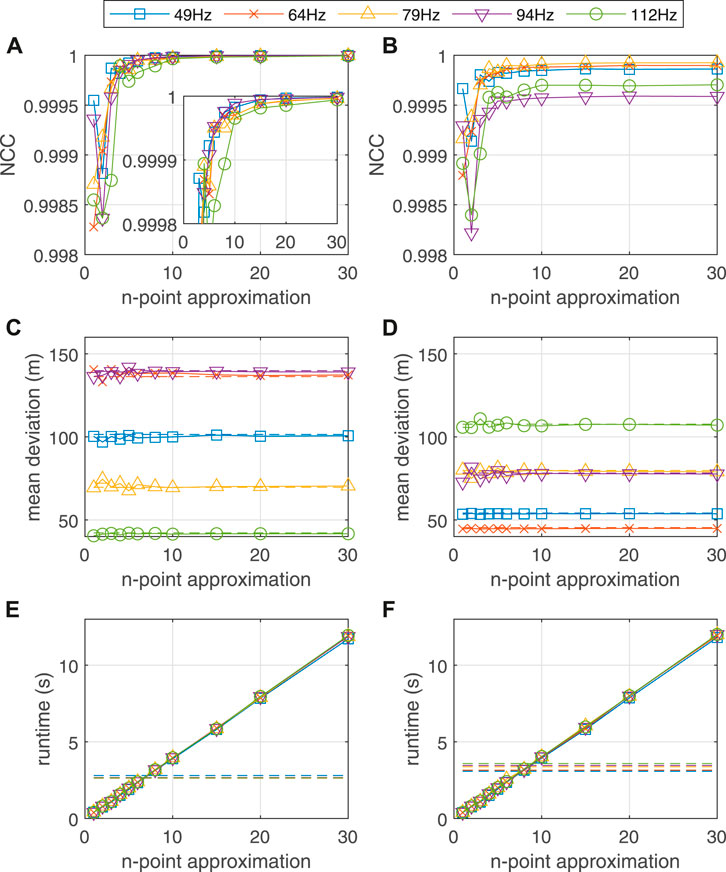
FIGURE 7. Changes of the NCC coefficient (A,B), the mean deviation between source range estimates and GPS records (C,D), and the runtime of computing a TFD (E,F) with the increase of the number of compensation points. Results of F-STFT are shown in the left three panels (A,C,E), while that of F-DopplerCT are shown in the right three panels (B,D,F). Dash lines in (C–F) represents the corresponding results of STFT and DopplerCT.

TABLE 1. Average run time of computing TFDs of the five tones. The percentage of run time of F-STFT and F-DopplerCT are computed referring to the average run time of conventional methods STFT and DopplerCT. As the two bold numbers indicate, the average run time of conventional methods STFT and DopplerCT is able to be dropped to 15% and 11.8% by applying the framework shown in Figure 4, respectively.
5 Conclusion
This paper perfects the application of cross-spectrum processing in accelerating Doppler-related parameter estimation for a tone source that travels past a single receiver in a straight line at constant speed, where time-consuming advanced TFA methods are widely used to suppress noise when extracting the continuous Doppler shift of a overhead pass. The conventional way of applying cross-spectrum processing is overshadowed by the phenomena of unknown Doppler shift offset and power spectrum estimation error. In this paper, the conventional cross-spectrum processing is proven to be an approximated estimation of the power spectrum in a small frequency interval, instead of exactly computing power spectrum over the total Nyquist frequency interval. This fact not only interprets why the method is highly computational efficiency but also reveals that reasons behind the two phenomena are the frequency aliasing and the approximation error, respectively. Based on these understandings, an revised framework of applying the cross-spectrum processing to accelerate the computation of TFDs is provided especially for TFDs of advanced TFA methods. Processing to the SWellEx-96 experiment data supports the above explanations for the two phenomena and demonstrates that the computational efficiencies of STFT and DopplerCT could be improved up to 85% and 88.2%, respectively, without a noticeable impact on the accuracy of parameter estimates. The feature of this proposed framework is apparent: a similar function of bandpass filtering is achieved with only FFT operations. This framework can be applied to accelerate the computations of most TFA methods. In addition, due to the feasibility of parallel computing in precision compensation, this framework is very meaningful in practical applications where the execution time is an important performance index. For future work, as this study focuses on only the narrowband case of applying cross-spectrum technique [12], relationships and applicability of the proposed framework to the broadband case is worth examining.
Data availability statement
Publicly available datasets were analyzed in this study. This data can be found here: Booth, Newell O; Hodgkiss, William S; Ensberg, David E (2015): SWellEx-96 Experiment Acoustic Data. UC San Diego Library Digital Collections. http://dx.doi.org/10.6075/J0MW2F21.
Author contributions
NL: Designed the study, performed the data analysis, and wrote the first draft of the manuscript. JZ and YY: Supervised the study, funding acquisition. All authors contributed to manuscript revision and approved the submitted version.
Funding
This research was supported by the National Natural Science Foundation of China (grant numbers 11974286, 11904290), China Association for Science and Technology Youth Talent Promotion Project (grant number 2020QNRC002), and Central University Operating Expenses Project (grant number W022005).
Conflict of interest
The authors declare that the research was conducted in the absence of any commercial or financial relationships that could be construed as a potential conflict of interest.
Publisher’s note
All claims expressed in this article are solely those of the authors and do not necessarily represent those of their affiliated organizations, or those of the publisher, the editors and the reviewers. Any product that may be evaluated in this article, or claim that may be made by its manufacturer, is not guaranteed or endorsed by the publisher.
6 Appendix Doppler frequency shift
Consider an ideal case where a pure-tone source travels along a straight line at a constant speed v and passes by a fixed receiver, as shown in Figure A1. The sound speed is given by a constant c (the average sound speed of a propagation medium in practice). The time when the source passes through CPA is denoted by τc, and at the very moment, the distance between the source and the receiver is represented by dc.
Due to the propagation delay, the acoustic signal emitted by the source at time τ (source time) arrives at the receiver node at a later time t (receiver time), given by:
where
Combining Eqs A1, A2, we obtain:
Especially, when τ = τc, we have:
where tc denotes the moment that sounds emitted at τc have propagated to the receiver.
Suppose that the phase of a tone signal with a frequency f0 emitted at time τ is:
where ϕ0 denotes a constant initial phase. Then, after the propagation over the slant range
where
Further, the IF of this tone signal received at time t is given by [20]:
Eq. A7 represents the regular of the Doppler frequency shift. By fitting the extracted IF curve of the received tone signal with Eq. A7, one can thus obtain the estimates of the Doppler-related parameters, i.e., f0, v, c, τc and dc. Note that if we denote the radial velocity of the source that is observed at the receiver as
then Eq. A7 can be reformulated as:
where the term of the Doppler frequency shift f0vr/c appears with an expression that is the same as the expression of the oscillation frequency in the cross-spectrum processing (Eq. 5).
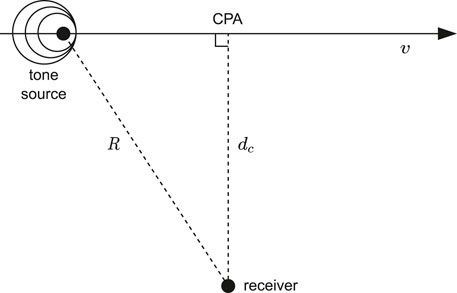
FIGURE A1. The trajectory of a tone source as it travels past the receiver node in a straight line at constant velocity v. R gives the slant range between the receiver and the source. The distance from the receiver to the CPA is denoted by dc.
References
1. Ferguson BG, Quinn BG. Application of the short-time Fourier transform and the Wigner–Ville distribution to the acoustic localization of aircraft. The J Acoust Soc America (1994) 96:821–7. doi:10.1121/1.410320
2. Vashishtha G, Chauhan S, Kumar A, Kumar R. An ameliorated African vulture optimization algorithm to diagnose the rolling bearing defects. Meas Sci Tech (2022) 33:075013. doi:10.1088/1361-6501/ac656a
3. Vashishtha G, Chauhan S, Yadav N, Kumar A, Kumar R. A two-level adaptive chirp mode decomposition and tangent entropy in estimation of single-valued neutrosophic cross-entropy for detecting impeller defects in centrifugal pump. Appl Acoust (2022) 197:108905. doi:10.1016/j.apacoust.2022.108905
4. Zhang D, Entezami M, Stewart E, Roberts C, Yu D. A novel Doppler effect reduction method for wayside acoustic train bearing fault detection systems. Appl Acoust (2019) 145:112–24. doi:10.1016/j.apacoust.2018.09.017
5. Zhang D, Entezami M, Stewart E, Roberts C, Yu D, Lei Y. Wayside acoustic detection of train bearings based on an enhanced spline-kernelled chirplet transform. J Sound Vibration (2020) 480:115401. doi:10.1016/j.jsv.2020.115401
6. Ferguson BG. Doppler effect for sound emitted by a moving airborne source and received by acoustic sensors located above and below the sea surface. J Acoust Soc America (1993) 94:3244–7. doi:10.1121/1.407230
7. Reid DC, Zoubir AM, Boashash B. Aircraft flight parameter estimation based on passive acoustic techniques using the polynomial wigner–ville distribution. J Acoust Soc America (1997) 102:207–23. doi:10.1121/1.419803
8. Xu L, Yang Y, Yu S. Analysis of moving source characteristics using polynomial chirplet transform. J Acoust Soc America (2015) 137:EL320–6. doi:10.1121/1.4916796
9. Xu L, Yang Y. Parameter estimation of underwater moving sources by using matched wigner transform. Appl Acoust (2016) 101:5–14. doi:10.1016/j.apacoust.2015.07.020
10. Liang N, Yang Y, Guo X. Doppler chirplet transform for the velocity estimation of a fast moving acoustic source of discrete tones. J Acoust Soc America (2019) 145:EL34–8. doi:10.1121/1.5087496
11. Zhang B, Yang Y, Guo X. Cross-term rejection in the wigner-ville distribution for velocity estimation of a narrowband sound source. ACTA Acustica (2021) 46:973–82. doi:10.15949/j.cnki.0371-0025.2021.06.018
12. Rakotonarivo ST, Kuperman WA. Model-independent range localization of a moving source in shallow water. J Acoust Soc America (2012) 132:2218–23. doi:10.1121/1.4748795
13. Yang K, Li H, Duan R, Yang Q. Analysis on the characteristic of cross-correlated field and its potential application on source localization in deep water. J Comp Acous (2017) 25:1750001. doi:10.1142/S0218396X17500011
14. Yu C, Zhou M, Shuqing M, Changchun B. Range passive localization of the moving source with a single vector hydrophone. In: 2016 IEEE/OES China Ocean Acoustics (COA) (2016). p. 1–5.
15. Zhao A, Song P, Hui J, Li J, Tang K. Passive estimation of target velocity based on cross-spectrum histogram. J Acoust Soc America (2022) 151:2967–74. doi:10.1121/10.0010367
16. Wang C, Wang J, Du P. Estimation of moving target speed using weak line spectrum of single-hydrophon. In: 2017 IEEE International Conference on Signal Processing, Communications and Computing (ICSPCC) (2017). p. 1–5.
17. Jensen FB, Kuperman WA, Porter MB, Schmidt H. Computational ocean acoustics. 2 edn. New York: Springer (2011).
18. Vaughan R, Scott N, White D. The theory of bandpass sampling. IEEE Trans Signal Process (1991) 39:1973. doi:10.1109/78.134430
19. Booth NO, Hodgkiss WS, Ensberg DE. Swellex-96 experiment acoustic data. San Diego, CA: UC San Diego Library Digital Collections (2015).
Keywords: Doppler shift, motion parameter estimation, time-frequency analysis, single receiver, cross-spectrum processing, computational efficiency
Citation: Liang N, Zhou J and Yang Y (2022) Revising the application of cross-spectrum processing in motion parameter estimation for harmonic sources. Front. Phys. 10:1070920. doi: 10.3389/fphy.2022.1070920
Received: 15 October 2022; Accepted: 31 October 2022;
Published: 11 November 2022.
Edited by:
Govind Vashishtha, Sant Longowal Institute of Engineering and Technology, IndiaReviewed by:
Vikrant Guleria, Sant Longowal Institute of Engineering and Technology, IndiaSumika Chauhan, National Institute of Technology Delhi, India
Copyright © 2022 Liang, Zhou and Yang. This is an open-access article distributed under the terms of the Creative Commons Attribution License (CC BY). The use, distribution or reproduction in other forums is permitted, provided the original author(s) and the copyright owner(s) are credited and that the original publication in this journal is cited, in accordance with accepted academic practice. No use, distribution or reproduction is permitted which does not comply with these terms.
*Correspondence: Jianbo Zhou, amJ6aG91QG53cHUuZWR1LmNu
 Ningning Liang1,2
 Jianbo Zhou