 Qingsheng Xue
 Hui Li
 Fengqin Lu
95% of researchers rate our articles as excellent or good
Learn more about the work of our research integrity team to safeguard the quality of each article we publish.
Find out more
ORIGINAL RESEARCH article
Front. Phys. , 08 November 2022
Sec. Optics and Photonics
Volume 10 - 2022 | https://doi.org/10.3389/fphy.2022.1058733
This article is part of the Research Topic State-of-the-Art Laser Spectroscopy and its Applications : Volume II View all 51 articles
As a technology that combines spectral technology and imaging technology, hyperspectral imaging technology can obtain the spectral and spatial information about the targets effectively. Hence, the underwater hyperspectral imaging technology has a fast development since it was first used underwater. Many kinds of hyperspectral imagers used for underwater detection at different depths were developed. However, the underwater hyperspectral imagers used at deep sea were rarely reported while the required detection depth increased. To satisfy the deep-sea exploration requirements, an underwater hyperspectral imaging system was designed. An optical system with a low F-number and a compact structure was first designed. The F-number of the system is 2.5. The focal length of the objective lens is 25 mm, and the field of view of the objective lens is 35.2°.The wavelength range of the system is from 400 to 1000 nm, and the spectral resolution of the spectrometer is better than 3 nm. The instrument cabin and other structures for waterproofing were designed. A minicomputer used for control communication, data acquisition, and processing was equipped in the actual system. The isolation performance and imaging quality were tested in the laboratory environment. According to the test result, the system has a good imaging quality and spectral detection capability. Also, the system can be used at 6000 m underwater, which may provide a new feasible technical scheme for deep-sea exploration.
With the development of society, environmental and resource problems are becoming increasingly prominent at the global level. With the increasing abundance of land and space detection means [1–4], people have a deeper understanding of the land and the atmosphere. On the contrary, due to the limitation to detection technology, people have relatively little understanding of the ocean. Many kinds of detection methods, such as remote sensing [5] and acoustic detection [6], were developed to know the ocean. However, the rich information on underwater cannot be fully accessed because the methods mentioned previously were limited by the resolution or detecting depth. Hence, the demand for deep-sea underwater detection with high resolution becomes urgent. As a combination of spectral technology and imaging technology, hyperspectral imaging technology can obtain the spectral and spatial information with high resolution and high efficiency, which can satisfy the demand mentioned previously [7]. So, the hyperspectral imaging technology was put into use for underwater detection by some researchers and developed fast.
The Norwegian University of Science and Technology (NTNU) has begun using underwater hyperspectral imaging technology since long time [8]. A prototype of the underwater hyperspectral imaging system was developed in April 2010 [8]; then, the prototype was mounted on different platforms to carry out the detection work. The system was mounted on a remote operated vehicle (ROV) to carry out the coral reef detection work in 2012. The detection depth reached was 80 m. Through the spectral imaging detection, different kinds of the coral reef can be classified by the spectrum obtained. In 2017, the system was mounted on an ROV and detected an underwater area at 4200 m depth [9]. By using the underwater spectral imaging detection method, manganese nodules in the area were detected successfully. At the same year, the system was mounted on a stationary platform and carried out detection work at 3500 m depth [10]. Different kinds of mineral materials were detected through this detection. In 2018, the system was mounted on an ROV and achieved the detection and recognition of different types of underwater cultural relics at 61 m depth [11]. The Max Planck Institute of Marine Microbiology in Germany has also started research on UHI detection technology since 2013. Two kinds of underwater hyperspectral imaging systems were designed and used in shallow water detection [12, 13]. The inversion of the chlorophyll concentration and classification of different kinds of materials were realized by processing the hyperspectral data obtained by the two systems. The Italian Institute of Marine Sciences has also started research on underwater hyperspectral imaging detection. In 2017, an underwater hyperspectral imager was mounted on the ROV by the Italian Institute of Marine Sciences. The system reached 200 m depth underwater and detected different kinds of materials [14].
According to the study mentioned previously, the detection depths of the underwater hyperspectral imaging detection systems change from shallow water to 4200 m. The systems which can reach deep water are rare. Although the maximal detection depth is deep, it may not be enough for further research in deep water. Hence, a line-scanning underwater hyperspectral imaging system used for deep-sea exploration was designed. Through the design of the optical system, mechanical structure, and electric control system, the underwater hyperspectral imaging system can be mounted on different underwater platforms to access the underwater hyperspectral data. The isolation performance and imaging quality were tested in a laboratory environment. According to the test result, the maximal detection depth of the system can reach 6000 m depth, and the system has a good imaging quality and spectral detection capability, which may provide a feasible plan for deep-sea exploration in the future.
The optical structure of the hyperspectral imaging system mainly includes three parts: the objective lens, spectrometer, and detector. Due to the severe light absorption of seawater at long wavelength [15], the main concerned detecting wavelength range of the system was from 400 to 700 nm. A detector (Basler Ac2040-90um, Germany) with high efficiency from 400 to 700 nm was first chosen. To have a relatively large field of view, the focal length of the objective length was determined as 25 mm. Because the system is used in deep sea where almost no natural light exists, the F-number of the whole system was determined as 2.5 to make full use of the light from the light source and have a relatively high signal-to-noise ratio. The objective lens of the system was designed to have a good imaging quality through focusing when the object distance changes. A prism-grating-prism structure was designed as the dispersion element so that the spectrometer can have a compact structure and small volume. The specification and value of the whole system are shown in Table 1. Simulation was performed by Zemax software, and part of the design result is shown in Figures 1, 2.
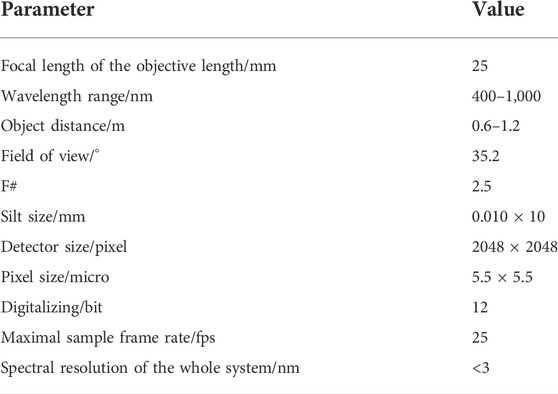
TABLE 1. Design parameters of the optical system.
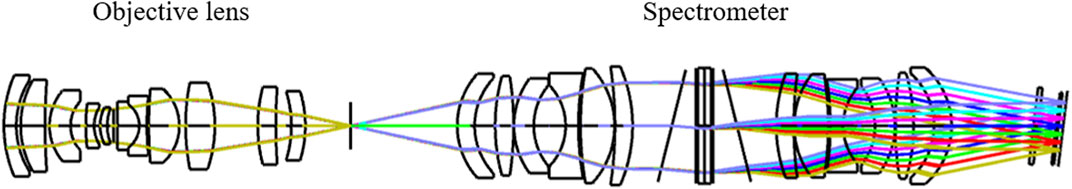
FIGURE 1. Optical structure of the whole underwater hyperspectral imaging system.
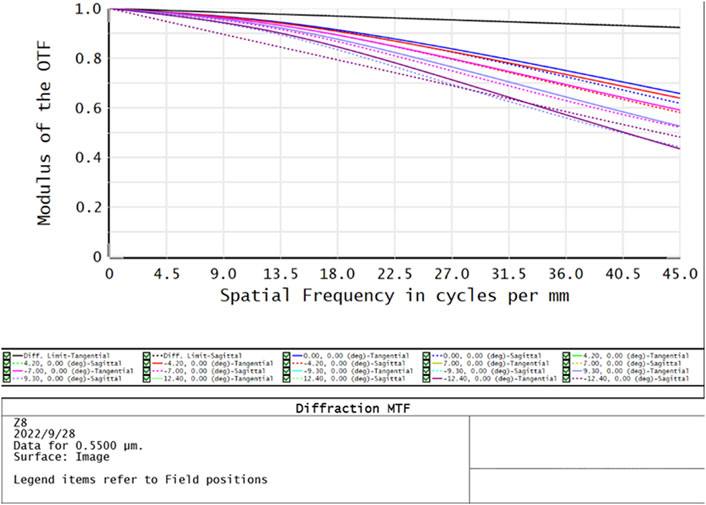
FIGURE 2. MTF curve of the whole system at the central wavelength.
The fixing structure of the optical elements and detector was first designed, which is shown in Figure 3A. Then, according to the size of the optical and mechanical structure designed previously, an instrument cabin was designed to resist the water and pressure in deep sea. To have a good water and pressure resistance, the material of the cabin was chosen as TC4 titanium alloy. To have a better resistance of the sea flow and be easy to manufacture, the cabin was designed to be cylindrical. To accommodate the imaging system, the internal diameter of the cabin was determined as 90 mm.Then, the parameters of the cabin can be determined according to Eqs 1, 2 mentioned as follows. D is the internal diameter of the cabin, which was 90 mm. K is the safety parameter, which was 1.5 in this design.
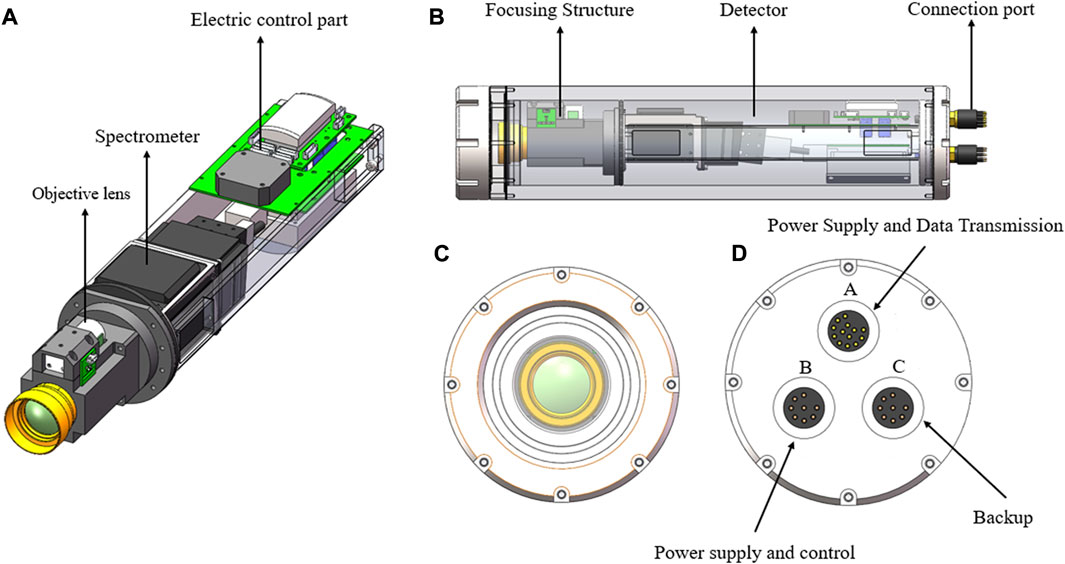
FIGURE 3. Mechanical structure design result. (A) Mechanical structure of the hyperspectral imaging system. (B) Mechanical structure of the instrument cabin. (C) Mechanical structure of the front cap of the instrument cabin. (D) Mechanical structure of the bottom cap.
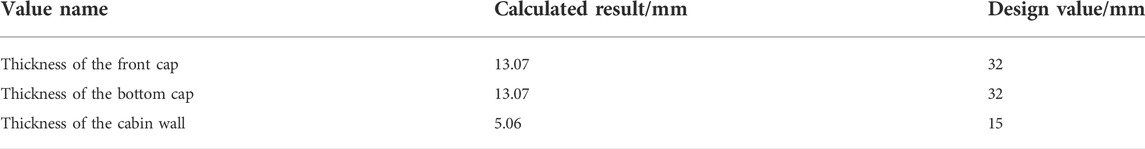
TABLE 2. Design parameters of the cabin.
The frame of the electric control system is shown in Figure 4. The core part of the electric control system is TX2-IPC, which is a minicomputer used for controlling the hyperspectral imager and saving the data accessed by the hyperspectral imager. The detector used in the underwater hyperspectral imager connects with the minicomputer with a USB3.0 data transmission line. The power, command, and data can be transmitted between the minicomputer and camera through the line. The commands sent from the minicomputer are given by the upper computer by the four cores of the eight core ports. The power supply of the whole system was achieved by the two cores of the eight core ports. The remaining two cores connected with the computer, and the computer connected with a 485-communication module to control the focusing stepper motor. The port of the 13 cores was only used for data transmission above water by eight cores through a network cable put inside the cabin. In addition, two cores of the 13 cores were used for power supply. A switch was used to share the data among the ports. Because the instrument works in the water environment, seawater can physically cool the instrument. To increase the safety factor, heat dissipation treatment of the instrument, the inside wall of the cabin, and the control system are coated with thermal silicone grease to ensure the instrument can work normally.
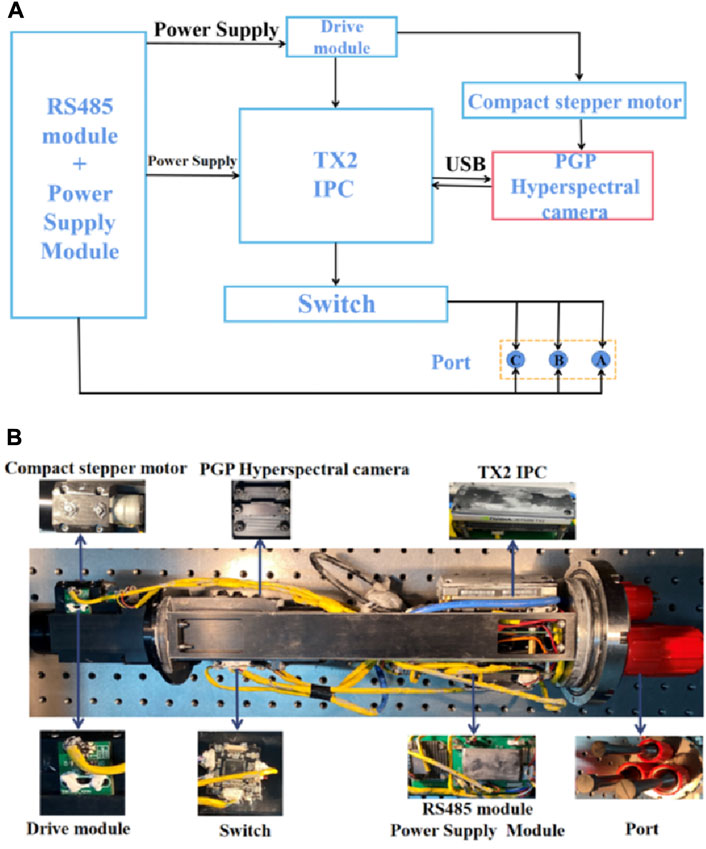
FIGURE 4. Design result of the electric control system. (A) Framework of the electric control system. (B) Actual structure of the electric control system.
To verify the watertight performance of the instrument cabin, a watertight test was taken. The instrument cabin was sent to a watertight performance test organization, and the cabin was put into a special pressure tank. The pressure tank generates large pressure inside to test the watertight performance and pressure resistance. The pressure changes with time, and its value is shown in Figure 5. The maximal pressure in the pressure tank increased to 60 MPa and lasted for about an hour. Also, the instrument cabin was flawless, which means the instrument cabin can be used underwater 6000 m.
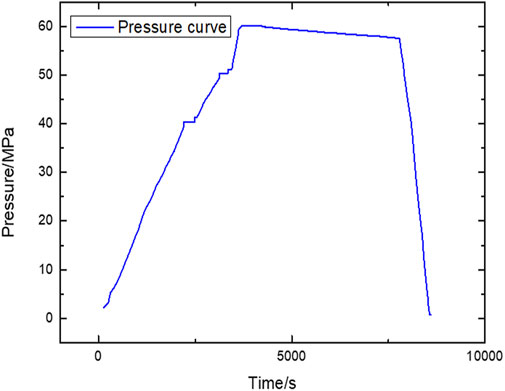
FIGURE 5. Pressure curve inside the pressure tank.
To access the monochromatic image from the raw data obtained by the hyperspectral image, a spectral calibration is necessary. A mercury lamp was used for spectral calibration, and the spectral resolution of the spectrometer at different peaks of the mercury lamp was calculated. The mercury lamp was placed in front of the slit of the spectrometer, and the raw data of the mercury lamp obtained by the spectrometer are shown in Figure 6. One row of the image is the spectrum of the mercury lamp, which is shown in Figure 7. A Gauss fitting method was used to determine the central position of the peaks of the mercury lamp and calculate the full width at half maxima (FWHM). According to the central position and peak wavelength, a linear fitting method was used to calculate the linear dispersion rate. Then, the spectral resolution can be calculated according to Eq. 3. The fitting result is shown in Figure 8. The spectral resolution calculated result is shown in Table.3.
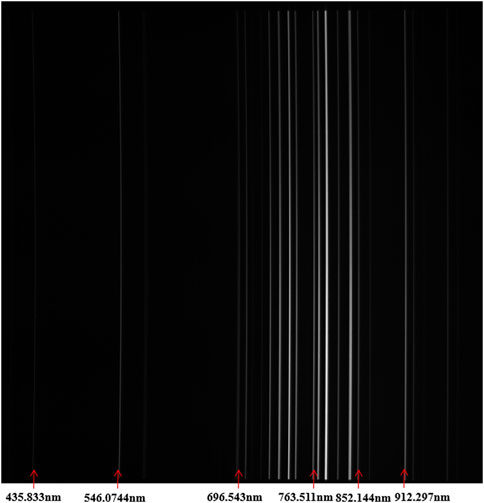
FIGURE 6. Raw data of the mercury lamp obtained by the spectrometer.

FIGURE 7. Spectrum of the mercury lamp obtained by the spectrometer.
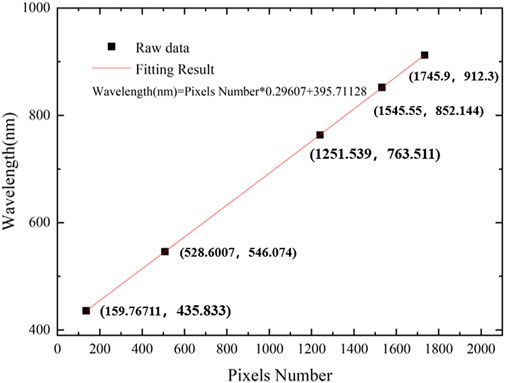
FIGURE 8. Linear fitting result of the calibration data.
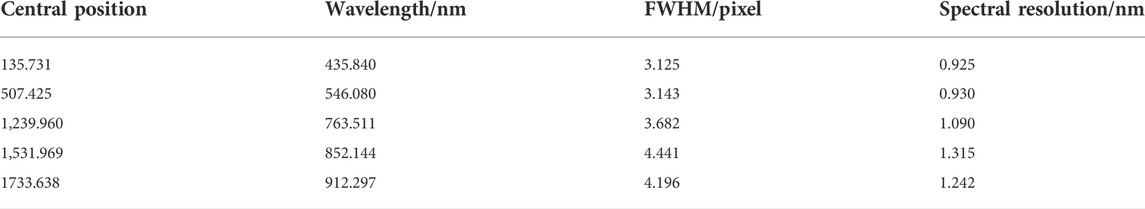
TABLE 3. Calibration result of the spectrometer.
To test the imaging quality and spectral detection capability in the range of 400–700 nm, an underwater environment was established in the laboratory. In addition, two LED sources with 100 W power were placed beside the underwater hyperspectral imager. A mechanical rotating platform was used as the carrying platform to carry out the scanning imaging job. The experiment environment is shown in Figure 9.
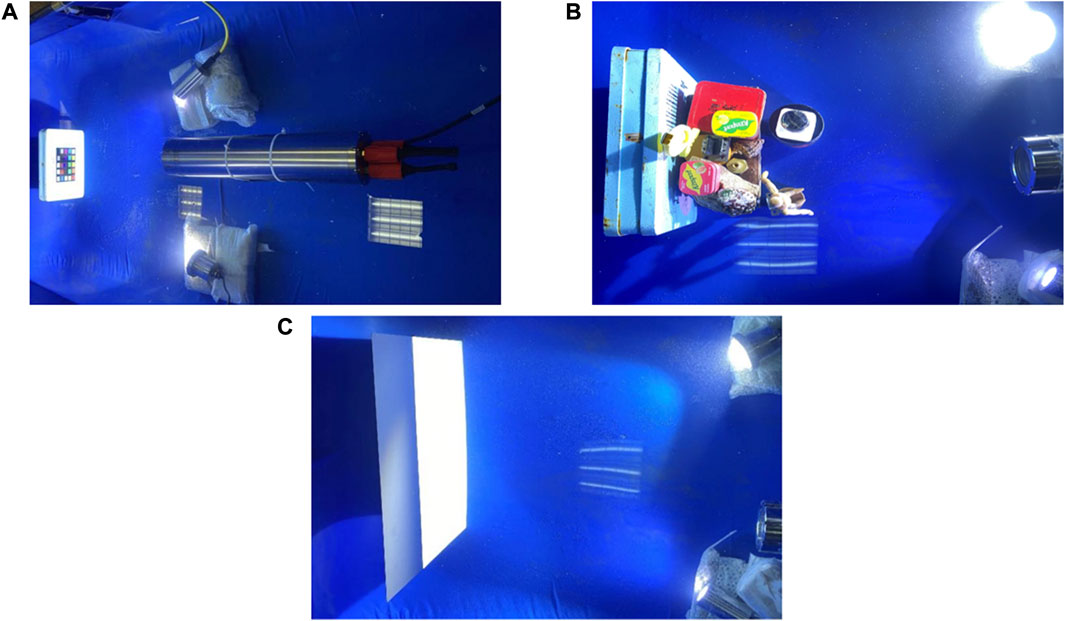
FIGURE 9. Underwater spectral imaging performance test. (A) Underwater hyperspectral imager scanning the color blocks. (B) Underwater hyperspectral imager scanning different objects. (C) Underwater hyperspectral imager scanning the standard whiteboard.
A board with different color blocks was first detected to verify the spectral detection capability of the system. The monochromatic images of different wavelengths are shown in Figure 10. The spectrum of different color blocks is shown in Figure 11. A standard whiteboard was also used as the target to measure the standard spectrum of the light source. The spectrum of the light source is shown in Figure 12. The reflectivity of the different color blocks can be calculated according to the stand spectrum of the light source. The reflectivity curves of different color blocks are shown in Figure 13. The characteristics of the reflectivity curves are consistent with the wavelength range of different colors, which means that the system has a good spectral detection capability.
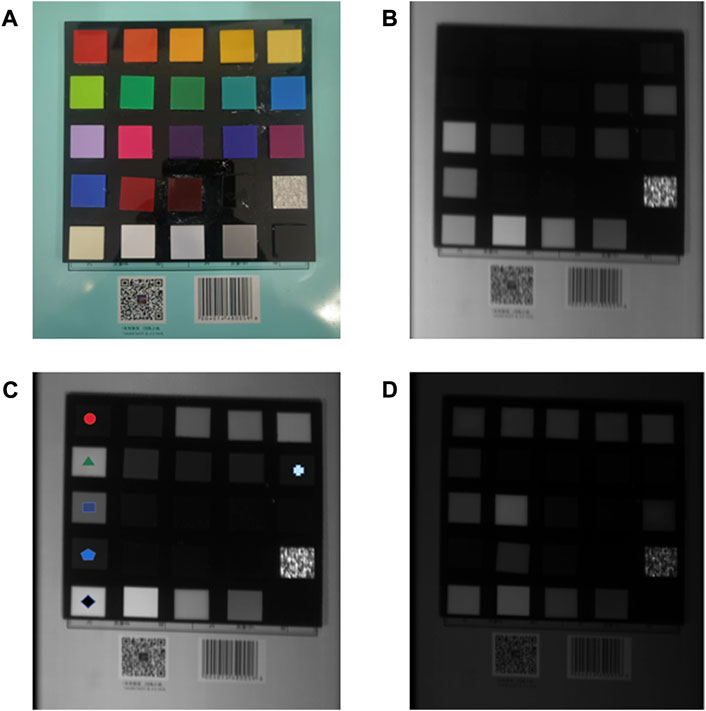
FIGURE 10. Monochromatic image obtained by the system. (A) Actual color blocks. (B) Monochromatic image of the color blocks at 455 nm. (C) Monochromatic image of the color blocks at 555 nm. (D) Monochromatic image of the color blocks at 655 nm.
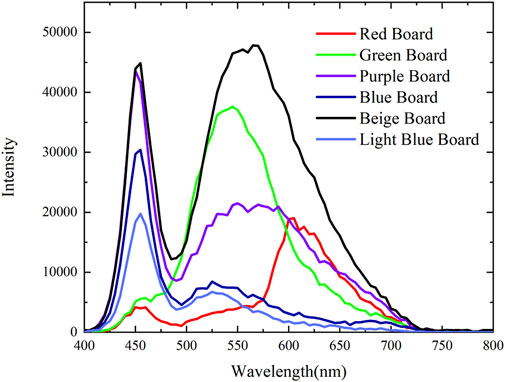
FIGURE 11. Spectrum of different color blocks.
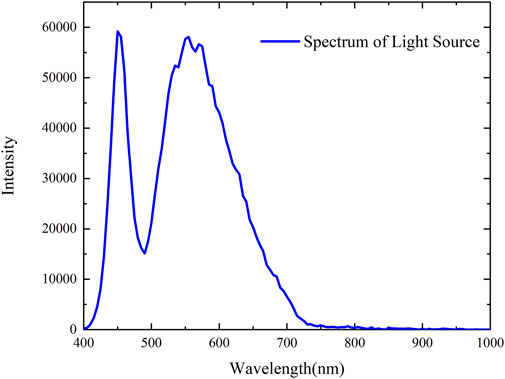
FIGURE 12. Spectrum of the standard light source.
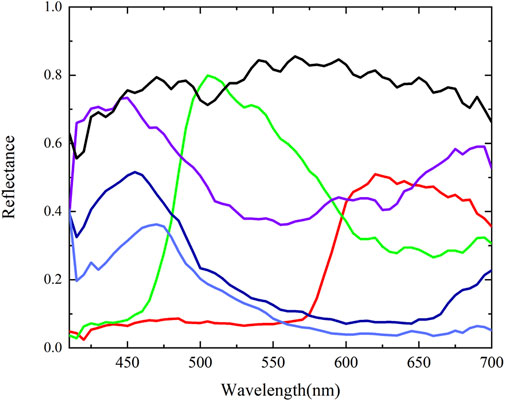
FIGURE 13. Reflectivity of different color blocks.
Different kinds of objects like metal boxes, plastic bottles, and some shells were used as the target. The monochromatic images of different wavelengths are shown in Figure 14. In addition, the spectrum and reflectivity of different objects are shown in Figures 15A,B. As shown in Figure 14, the system has a good imaging quality. Different objects can be classified according to the spectrum or reflectivity curves. According to the detecting results, the system has a good underwater detection capability, which may provide a feasible technical detecting plan for deep-sea exploration.
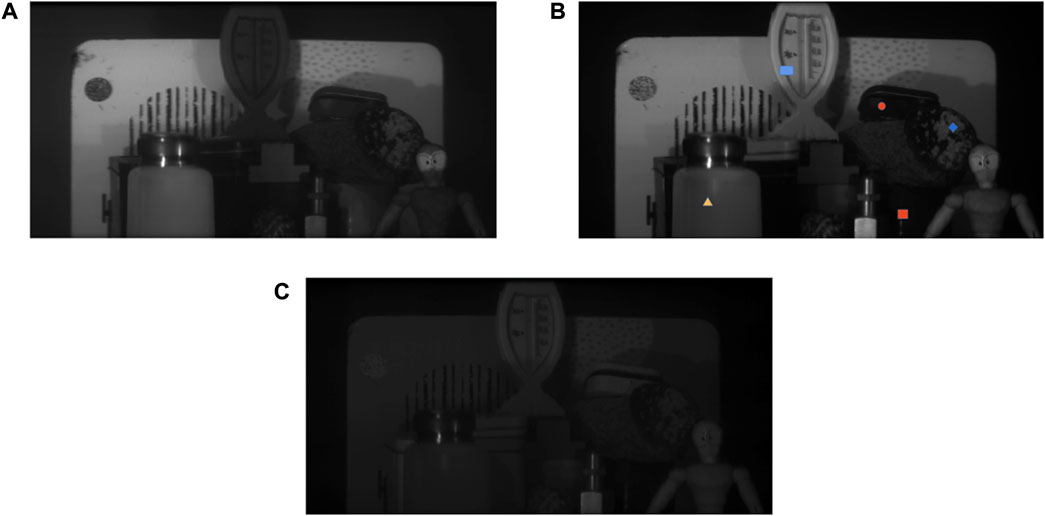
FIGURE 14. Monochromatic images of the different objects. (A) Monochromatic images of different objects at 455 nm. (B) Monochromatic images of different objects at 555 nm. (C) Monochromatic images of different objects at 655 nm.
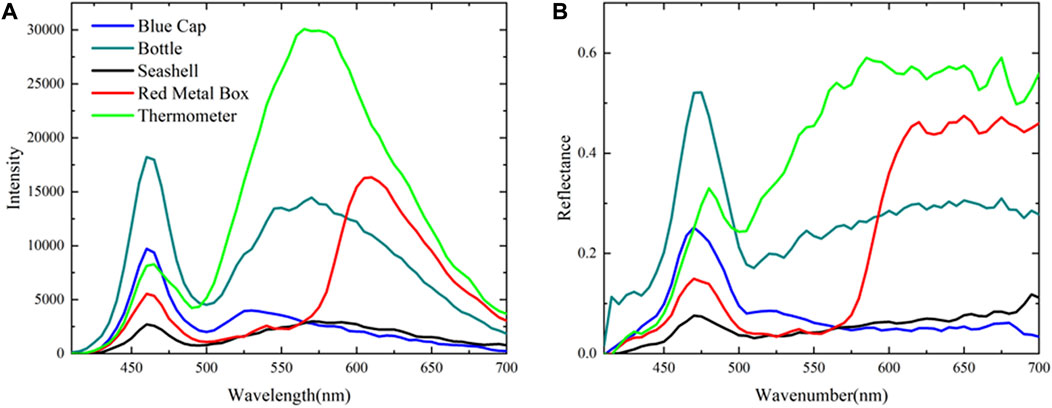
FIGURE 15. (A) Spectrum of different objects. (B) Reflectivity of different objects.
To make up the requirement for high-resolution deep-sea detection, an underwater hyperspectral imaging system was developed. The optical system was first designed according to deep-sea exploration requirements. Then, the mechanical structure and instrument cabin were designed. The electric control system was established. In addition, the communication with the upper computer, control of camera, and data transmission can be achieved by using the internal minicomputer. The multiple performances of the instrument have been tested in the laboratory environment. According to the test result, the spectral resolution of the spectrometer is better than 3 nm, and the system can work underwater 6000 m. Different underwater targets can be distinguished according to the spectrum accessed by the system. The system has a good underwater detection capability and may provide new feasible plans for future deep-sea exploration.
The datasets presented in this article are not readily available because the complete dataset needs to be further collated. Requests to access the datasets should be directed to Qingsheng Xue, xueqingsheng@ouc.edu.cn.
QX: conceptualization and methodology. HL: experiment, simulation, and writing—original draft. FL: data processing. HB: data processing and writing—review and editing.
The study was funded by the Key Research and Development Program of Shandong Province (2020CXGC010706), the National Natural Science Foundation of China (U2006209 and 41575023), the National Natural Science Foundation of China (U2106210), the Scientific research funds of Taishan scholars (202105033008), the Excellent Researcher plan project (202112003), the Key deployment project of the Marine Science Research Centre of the Chinese Academy of Sciences (COMS2019J04), the National Key Research and Development Program of China (2019YFC1408300, 2019YFC1408301, and 2018YFF01011003), and the Consulting Research Project of the Chinese Academy of Engineering (2020-XZ-5-03).
The authors declare that the research was conducted in the absence of any commercial or financial relationships that could be construed as a potential conflict of interest.
All claims expressed in this article are solely those of the authors and do not necessarily represent those of their affiliated organizations, or those of the publisher, the editors, and the reviewers. Any product that may be evaluated in this article, or claim that may be made by its manufacturer, is not guaranteed or endorsed by the publisher.
1. Qiao S, Sampaolo A, Patimisco P, Spagnolo V, Ma Y. Ultra-highly sensitive HCl-LITES sensor based on a low-frequency quartz tuning fork and a fiber-coupled multi-pass cell. Photoacoustics (2022) 27:100381. doi:10.1016/j.pacs.2022.100381
2. Ma Y, Feng W, Qiao S, Zhao Z, Gao S, Wang Y. Hollow-core anti-resonant fiber based light-induced thermoelastic spectroscopy for gas sensing. Opt Express (2022) 30(11):18836–44. doi:10.1364/OE.460134
3. Fu Y, Cao J, Yamanouchi K, Xu H. Air-laser-based standoff coherent Raman spectrometer. Ultrafast Sci (2022) 2022:1–9. doi:10.34133/2022/9867028
4. Kzhang Z, Zhang F, Xu B, Xie H, Fu B, Lu X, et al. High-sensitivity gas detection with air-lasing-assisted coherent Raman spectroscopy. Ultrafast Sci (2022) 2022:1–8. doi:10.34133/2022/9761458
5. Kratzer S, Harvey ET, Philipson P. The use of ocean color remote sensing in integrated coastal zone management—a case study from himmerfjärden, Sweden. Mar Pol (2014) 43:29–39. doi:10.1016/j.marpol.2013.03.023
6. Asada A, Ura T. Three dimensional synthetic and real aperture sonar technologies with Doppler velocity log and small fiber optic gyrocompass for autonomous underwater vehicle. In: 2012 oceans. IEEE (2012). p. 1–5. doi:10.1109/OCEANS.2012.6405126
7. ElMasry G, Sun DW. Principles of hyperspectral imaging technology//Hyperspectral imaging for food quality analysis and control. Academic Press (2010). p. 3–43. doi:10.1016/B978-0-12-374753-2.10001-2
8. Johnsen G, Ludvigsen M, Sørensen A, Sandvik Aas LM. The use of underwater hyperspectral imaging deployed on remotely operated vehicles-methods and applications. IFAC-PapersOnLine (2016) 49(23):476–81. doi:10.1016/j.ifacol.2016.10.451
9. Dumke I, Nornes SM, Ludvigsen M. First hyperspectral survey of the deep seafloor: DISCOL area. In: Peru basin//EGU general assembly conference abstracts (2017). p. 4529.
10. Dumke I, Ludvigsen M, Ellefmo SL, Soreide F, Johnsen G, Murton BJ. Underwater hyperspectral imaging using a stationary platform in the Trans-Atlantic Geotraverse hydrothermal field. IEEE Trans Geosci Remote Sens (2018) 57(5):2947–62. doi:10.1109/TGRS.2018.2878923
11. Ødegård Ø, Mogstad AA, Johnsen G, Sorensen AJ, Ludvigsen M. Underwater hyperspectral imaging: A new tool for marine archaeology. Appl Opt (2018) 57(12):3214–23. doi:10.1364/AO.57.003214
12. Chennu A, Färber P, De’ath G, de Beer D, Fabricius KE. A diver-operated hyperspectral imaging and topographic surveying system for automated mapping of benthic habitats1-12. Sci Repscientific Rep (2017) 7(11):77122. doi:10.1038/s41598-017-07337-y
13. Chennu A, Färber P, Volkenborn N, Al-Najjar MAA, Janssen F, de Beer D, et al. Hyperspectral imaging of the microscale distribution and dynamics of microphytobenthos in intertidal sediments. Limnol Oceanogr Methods (2013) 11(10):511–28. doi:10.4319/lom.2013.11.511
14. Foglini F, Grande V, Marchese F, Bracchi VA, Prampolini M, Angeletti L, et al. Application of hyperspectral imaging to underwater habitat mapping, Southern Adriatic Sea. Sensors (2019) 19(10):2261. doi:10.3390/s19102261
15. Wozniak B, Dera J. Light absorption by suspended particulate matter (SPM) in sea water. New York: Springer (2007). doi:10.1007/978-0-387-49560-6_5
Keywords: deep-sea exploration, hyperspectral image, optical design, optical system, underwater hyperspectral imaging
Citation: Xue Q, Li H, Lu F and Bai H (2022) Underwater hyperspectral imaging system for deep-sea exploration. Front. Phys. 10:1058733. doi: 10.3389/fphy.2022.1058733
Received: 30 September 2022; Accepted: 12 October 2022;
Published: 08 November 2022.
Edited by:
Yufei Ma, Harbin Institute of Technology, ChinaReviewed by:
Qikun Pan, Changchun Institute of Optics, Fine Mechanics and Physics (CAS), ChinaCopyright © 2022 Xue, Li, Lu and Bai. This is an open-access article distributed under the terms of the Creative Commons Attribution License (CC BY). The use, distribution or reproduction in other forums is permitted, provided the original author(s) and the copyright owner(s) are credited and that the original publication in this journal is cited, in accordance with accepted academic practice. No use, distribution or reproduction is permitted which does not comply with these terms.
*Correspondence: Qingsheng Xue, eHVlcWluZ3NoZW5nQG91Yy5lZHUuY24=
Disclaimer: All claims expressed in this article are solely those of the authors and do not necessarily represent those of their affiliated organizations, or those of the publisher, the editors and the reviewers. Any product that may be evaluated in this article or claim that may be made by its manufacturer is not guaranteed or endorsed by the publisher.
Research integrity at Frontiers
Learn more about the work of our research integrity team to safeguard the quality of each article we publish.