94% of researchers rate our articles as excellent or good
Learn more about the work of our research integrity team to safeguard the quality of each article we publish.
Find out more
ORIGINAL RESEARCH article
Front. Phys., 25 October 2022
Sec. Physical Acoustics and Ultrasonics
Volume 10 - 2022 | https://doi.org/10.3389/fphy.2022.1058474
This article is part of the Research TopicAdvances in Noise Reduction and Feature Extraction of Acoustic SignalView all 13 articles
The combination of underwater acoustic processing and the Global Navigation Satellite System (GNSS) has achieved remarkable economic benefits in offshore operations. As the key technology of GNNS positioning, feature extraction of underwater acoustic signals is affected by the complex marine environment. To extract more effective information from underwater acoustic signals, we use four types of multi-scale entropies, including multi-scale sample entropy (MSE), multi-scale fuzzy entropy (MFE), multi-scale permutation entropy (MPE), and multi-scale dispersion entropy (MDE), to analyze and distinguish underwater acoustic signals. In this study, two groups of real-word underwater acoustic signal experiments were performed for feature extraction of ship-radiated noises (SRNs) and ambient noises (ANs). The results indicated that the performance of the MFE-based feature extraction method is superior to that of feature extraction methods based on the other three entropies under the same number of features, and the highest average recognition rate (ARR) of the MFE-based feature extraction method for SRNs reaches 100% when the number of features is 3.
The Global Navigation Satellite System (GNSS) plays an indispensable role in offshore operations and coastal defense; the positioning of marine targets depends heavily on accurate feature extraction. However, the extremely complex marine environment may seriously interfere with receiving underwater acoustic signals [1–4]. Therefore, it poses challenges to feature extraction of underwater acoustic signals and GNSS positioning [5, 6].
Traditional feature extraction methods include time domain, frequency domain, and time–frequency domain methods, which are not suitable for processing nonlinear and non-stationary signals [7–9]. With the continuous development of entropy theory, entropy-based feature extraction methods are used to analyze underwater acoustic signals [10–13], which is also effective in the analysis of nonlinear and non-stationary signals. The common entropies include sample entropy (SE), fuzzy entropy (FE), permutation entropy (PE), and dispersion entropy (DE).
SE and FE are acclaimed tools for quantifying the regularity and unpredictability of time series [14–16]. Richman and Moorman first proposed the concept of SE, which overcomes the defect that approximate entropy is restricted by the data record length [17]. As an improved algorithm of SE, the FE was put forward by Chen et al. which not only has the advantages of SE that is effective on short time series but also gives the definition of entropy in the case of small parameters by introducing the concept of fuzzy sets [18].
Both PE and DE are complexity metrics based on Shannon entropy, which can represent the complexity of the signal [19–21]. A new PE is proposed by Bandt and Pompe [22], which measures the chaos degree of the time series through employing the permutation pattern and has stronger anti-noise ability. However, PE considers only the order of the time series, and hence, some information of amplitudes may be not regarded. To deal with the problem, DE is introduced in [23] as a new complexity index, which considers the magnitude relationship of amplitude, and it is superior to PE in calculation speed as well as the ability to describe the valuable information of a signal.
Since these entropies mentioned above cannot reflect the useful information of the signal from the multi-scale, many scholars at home and abroad introduced the coarse-grained operation to generate multi-scale improved algorithm based on entropy [24], including multi-scale sample entropy (MSE), multi-scale fuzzy entropy (MFE), multi-scale permutation entropy (MPE), and multi-scale dispersion entropy (MDE). Among them, MSE successfully tracked the change of drug concentration during sevoflurane anesthesia [25]; MFE and MDE can accurately diagnose the fault types and fault severities [26, 27]; MPE was applied to feature extraction of ship-radiated noise and showed excellent performance [28].
In order to illustrate the feasibility of multi-scale entropy in feature extraction of underwater acoustic signals, we performed two comparative experiments for ambient noises (Ans) and ship-radiated noises (SRNs) by using feature extraction methods based on MSE, MFE, MPE, and MDE, respectively. The general structure of this paper is as follows: Section 2 introduces the basic theories of MSE, MFE, MPE, and MDE; Section 3 and Section 4 carry out the experiments of feature extraction and classification for six Ans and six SRNs separately; finally, and Section 5 is the conclusion of this article.
Fuzzy entropy is an improved algorithm of sample entropy; SE and FE can be used to characterize the complexity of time series. Figure 1 shows the flow chart of SE and FE. In the flow of SE, the phase space of time series is reconstructed, next the maximum distance between two vectors is calculated to obtain the similarity degree and average value of similarity degree, and then, the embedding dimension is added to 1. By repeating the abovementioned steps, the value of SE can be calculated as follows:
where
Compared with SE, in the flow of FE, after phase space reconstruction of time series, all elements of each vector are subtracted from the mean value of the corresponding vector, the maximum distance between two vectors is calculated, and the membership function is introduced to calculate the similarity; in addition, other steps are the same as in SE, and the value calculation formula is shown as Eqn. 1. The work in [14, 15] shows the specific steps of SE and DE, respectively.
PE and DE are algorithms based on the Shannon entropy theorem. Figure 2 depicts the flow chart of PE and DE, and their differences are shown in the dotted box. For DE, the time series is mapped to a new series by the normal cumulative distribution function (NCDF) and rounding function, and then we reconstruct the phase space of this new time series to obtain a dispersion pattern series, then we calculate pattern probability, and the value of entropy is defined as follows:
where n is the number of pattern series and
For PE, the phase space of the time series is reconstructed directly, and then, we rearrange the reconstructed vectors to obtain a new array pattern sequence; then, we calculate pattern probability, and the value of PE is calculated by using Eqn. 2. The specific steps of PE and DE are shown in [22, 23], respectively.
The four types of entropy mentioned above can only measure the time series on a single scale, which often leads to a lack of series information. In order to solve this problem, the multi-scale method is adopted, the specific steps are as follows:
The coarse graining operation is introduced to a time series
where
Six distinct types of ANs are selected for complexity, feature extraction and recognition, which came from the National Park Service [29]. These ANs are labeled HRS, LRS, LWS, MWS, SS, and WSS, respectively. 400,000 sampling points are taken for each AN, and Figure 3 shows the time domain waveform of six ANs.
In order to compare the feature extraction effects of four kinds of entropy for each AN. For each group of feature extraction experiments, we take 100 samples for each AN without repeating sampling points, and each sample is composed of 4000 sampling points. The MSE, MPE, MDE, and MFE of the six ANs are extracted from SF1 (SF1 means the scale factor 1, SF2 means the scale factor 2, and so on) to SF10. For comparison and analysis, Table 1 shows the parameter settings of four kinds of entropy.
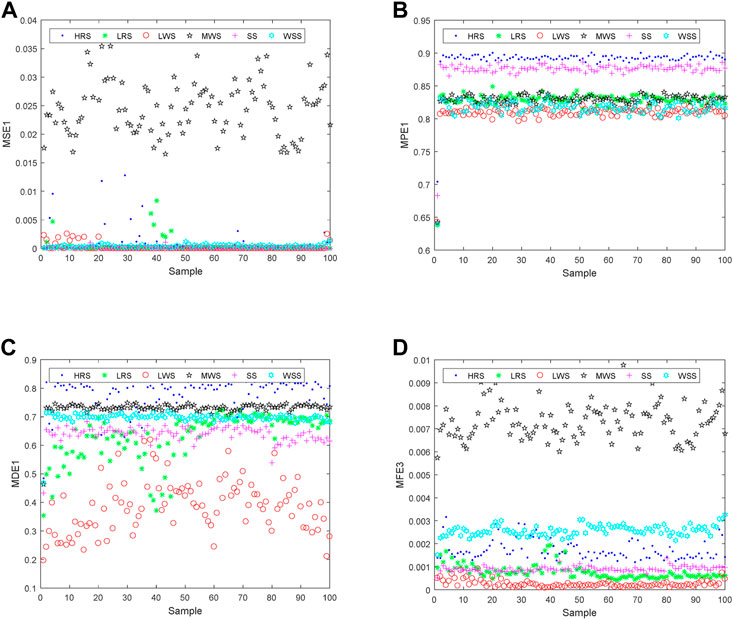
It can be seen from Figure 4 that the MSE of HRS, LWS, SS, and WSS are mixed together; compared with MPE and MDE, MSE and MFE are better at distinguishing MWB; the discrimination effect of MPE on HRS and SS is better than the other three entropies; and each entropy of ANs has a large amount of aliasing. It concluded that the discrimination effect of four kinds of entropy four marine environmental noise is poor.

FIGURE 4. Single-feature distribution correspond to the highest ARR for six ANs. (A) is MSE, (B) is MPE, (C) is MDE, (D) is MFE.
In order to compare the recognition effects of each entropy for six ANs more conveniently, we calculated the highest ARR of each AN under four kinds of entropy by the K-nearest neighbor (KNN) algorithm [30]. Table 2 shows the highest ARR of a single feature for six ANs.
It can be observed from Table 2 that the ARR of the four feature extraction methods for the six ANs is lower than 77.0% the recognition rate of the four feature extraction methods for HRS is higher than 60%; the recognition rates of the MSE-based feature extraction method for LRS and MWS is 100%; the ARR of the MSE-based feature extraction method for six ANs is the lowest, the ARR of the MFE-based feature extraction method for six ANs is the highest; it can be concluded that it is difficult to accurately distinguish six ANs by the single-feature extraction method.
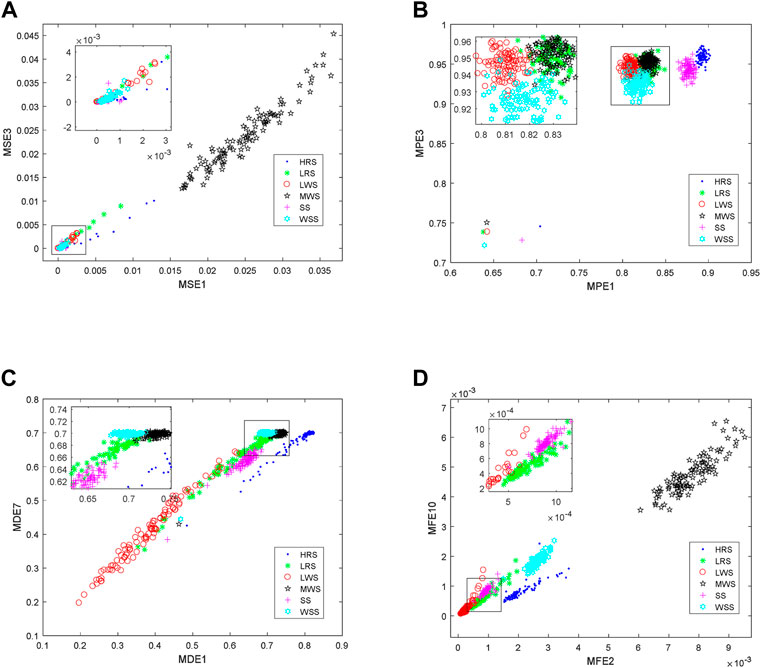
In order to further improve the recognition rate of the six ANs, the multi-feature extraction method based on four kinds of entropy is used to extract and classify the six ANs. Figure 5 indicates that the multi-feature distribution results correspond to the highest ARR for six ANs.

FIGURE 5. Multi-feature distribution results correspond to the highest ARR for six ANs. (A) is MSE, (B) is MPE, (C) is MDE, (D) is MFE.
From the Figure 5, we can find that compared with the single-feature extraction method, the multi-feature extraction method has a better discrimination effect on six ANs; multi-feature extraction methods based on MSE and MFE have a better ability to distinguish MWS than MPE and MDE; compared with the other three feature extraction methods, the multi-feature extraction method based on MSE has the worst effect on SS; multi-feature extraction methods based on MFE are better at distinguishing WSS. Results show that compared with the other three feature extraction methods, the multi-feature extraction method based on MFE can better distinguish six ANs.
We calculate the highest average recognition rates of multi-features for six ANs by the KNN algorithm, in which (1, 3) represents double features of complexity parameter under SF1, and SF3 (1, 3, 5) represents triple features of complexity parameter under SF1, SF3, and SF5, and so on. Table 3 shows the highest ARR of four types of entropies for six ANs under different numbers of features. Figure 6 shows the highest ARR of four types of entropies for six ANs.
It can be seen from Table 3 and Figure 6 that with the increase of the number of features, the recognition of feature extraction methods based on the four entropy increases first rapidly and then decreases slowly; under the same number of features, the multi-feature extraction method based on MSE has the lowest recognition rate; the recognition rate of the multi-feature extraction method based on MFE is the highest, and reaches 98.7% when the number of extracted features is 3, which is at least 2.6% higher than the other three multi-feature extraction methods. The results show that the multi-feature extraction method can better identify six ANs, compared with the other three multi-feature extraction methods, MFE can better distinguish six ANs.
Six different types of SRNs are chosen for feature extraction and classification, which are called ship1, ship2, ship3, ship4, ship5 and ship6 respectively. The six types of SRNs are all from the National Park Service [29]. The number of sampling points of each type of SRN is
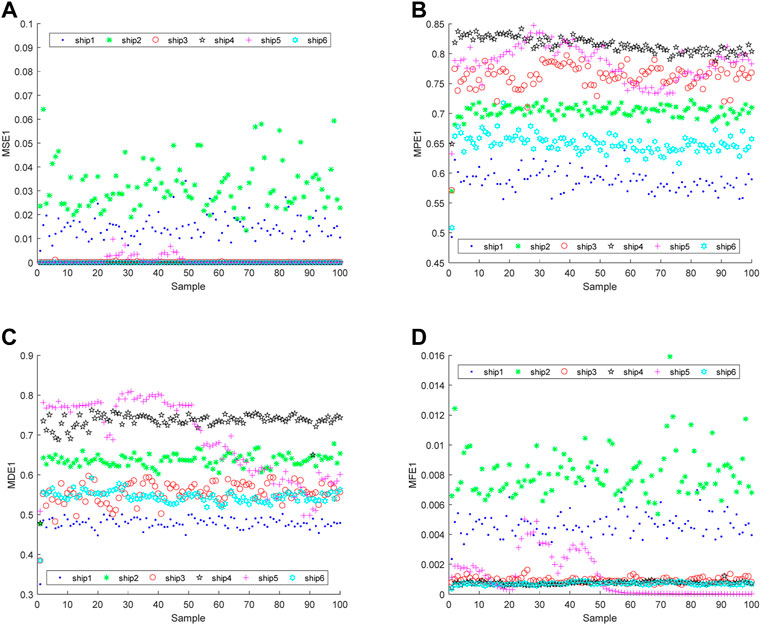
100 samples are selected for each type of S-Ss, and the sampling points of each sample is 4000. MSE, MPE, MDE, and MFE of the six SRNs are extracted from SF1 to SF10. The parameters of the four kinds of entropy are consistent with those mentioned in Section 2; Figure 9 demonstrates the single-feature distributions corresponding to the highest ARR for six SRNs.

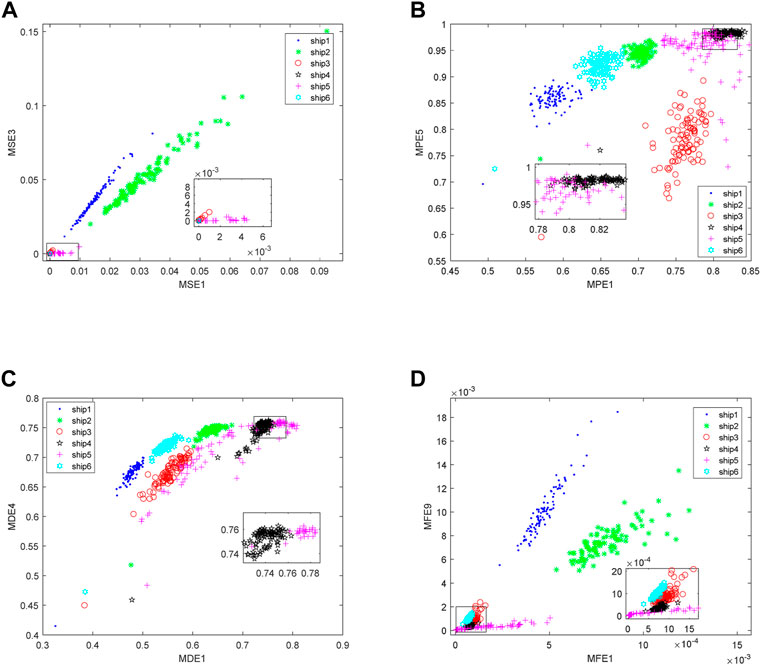
FIGURE 9. Multi-feature distributions correspond to the highest ARR for six SRNs. (A) is MSE, (B) is MPE, (C) is MDE, (D) is MFE.
Figure 8 shows that for the four kinds of entropies, the feature distributions of six SRNs all have aliasing in general, especially ship3 and ship5; for MSE, the scattered points representing ship3 to ship6 are distributed almost in the same straight line; compared with MSE and MFE, the feature distributions of MPE and MDE have fewer overlapping areas; for MFE, the feature distributions of ship2 fluctuate in a larger area compared with that of other SRNs. In summary, only the single feature is adopted, which makes it difficult to distinguish the six S-Ss, and the MSE has the worst separability for six SRNs.

FIGURE 8. Single-feature distributions correspond to the highest ARR for six SRNs. (A) is MSE, (B) is MPE, (C) is MDE, (D) is MFE.
In order to more obviously compare the average recognition rates of six SRNs, the KNN classifier was introduced to classify six different SRNs. 100 samples of each SRN are selected, of which 50 samples are used as training samples and the other 50 samples are test samples. Table 4 shows the highest ARR of a single feature.
From Table4, it can be concluded that, for the MSE-based feature extraction method, the ARR is the lowest, the recognition rates of ship4 and ship5 are 0%, and the recognition rate of ship6 only reaches 4%; compared with the feature extraction methods based on MSE, MPE, and MDE, the MFE-based feature extraction method has the highest ARR; for the feature extraction methods based on these four entropies, the highest ARRs are lower than 75%. It can be concluded that it is difficult to accurately distinguish six SRNs by the single-feature extraction method.
To more clearly compare the feature extraction effects of four kinds of entropies on six SRNs, we adopted the multi-feature extraction methods based on MSE, MPE, MDE, and MFE separately. Figure 9 shows the multi-feature distributions corresponding to the highest ARR for six SRNs.
It can be observed from Figure 9 that the aliasing of multi-feature distribution of MSE for six SRNs is the most serious, and the multi-feature distribution of MFE has the least overlapping part; for the four multi-feature extraction methods based on MSE, MPE, MDE, and MFE, respectively, they can accurately distinguish ship1 and ship2; compared with the other three multi-feature extraction methods, the MFE-based multi-feature extraction method has excellent performance in the recognition of ship5. In summary, the MFE-based multi-feature extraction method has the best separability for six kinds of ships.
In order to further compare the discrimination abilities of the four entropies for six SRNs, we calculated the highest average recognition rates of multi-features for six SRNs. Figure 10 is the highest ARR of four types of entropies for six SRNs, Table 5 shows the highest ARR of four types of entropies for six SRNs under different numbers of features.
As can be indicted from Figure 10 and Table 5, for the feature extraction methods based on the four types of entropy, the recognition rate for six SRNs increased with the increase of the number of features; under the same number of features, the highest ARR of the MSE-based feature extraction method is the lowest; the highest ARR of the MFE-based feature extraction method is higher than these of which based on the other types of entropy; the highest ARR of the MFE-based feature extraction method reaches 100% when the number of features is 3. In conclusion, compared with the extraction methods based on MSE, MPE, and MDE, the MFE-based feature extraction method has the highest recognition rate.
To effectively extract the features of the underwater acoustic signal, two comparative experiments were performed for the real-world underwater acoustic signal by using feature extraction methods on MSE, MPE, MDE, and MFE. The following conclusions are obtained:
1) Through the feature extraction and classification recognition of ANs, it is concluded that with the increase of the number of features, the recognition of the feature extraction method based on four entropies first increases rapidly and then decreases slowly. The multi-feature extraction method based on MFE has the best feature extraction effect and the highest ARR for six ANs with the same number of features.
2) In the feature extraction of SRNs, compared with feature extraction methods based on the other types of entropies, the highest ARR of MFE-based feature extraction method are the highest under the same number of features; the average recognition rate of MFE-based feature extraction method reaches 100% when the number of features is 3; the application of MFE in feature extraction can effectively improve the performance of GNNS in positioning for marine target.
The datasets presented in this study can be found in online repositories. The names of the repository/repositories and accession number(s) can be found in the article/supplementary material.
All authors listed have made a substantial, direct, and intellectual contribution to the work and approved it for publication.
The authors declare that the research was conducted in the absence of any commercial or financial relationships that could be construed as a potential conflict of interest.
All claims expressed in this article are solely those of the authors and do not necessarily represent those of their affiliated organizations, or those of the publisher, the editors, and the reviewers. Any product that may be evaluated in this article, or claim that may be made by its manufacturer, is not guaranteed or endorsed by the publisher.
1. Li Q. Advances of research work in some areas of underwater acoustics signal processing. Appl Acoust (2001) 20(1):1–5. doi:10.15949/j.cnki.0371-0025.2001.04.002
2. Vaccaro R. J. The past, present, and the future of underwater acoustic signal processing. IEEE Signal Process Mag (1998) 15(4):21–51. doi:10.1109/79.689583
3. Wang Q., Zeng X., Wang L., Wang H., Cai H. Passive moving target classification via spectra multiplication method. IEEE Signal Process Lett (2017) 24(4):451–5. doi:10.1109/lsp.2017.2672601
4. Yang H., Li L., Li G. A new denoising method for underwater acoustic signal. IEEE Access (2020) 8:201874–88. doi:10.1109/access.2020.3035403
5. Li G., Chang W., Yang H. A new hybrid model for underwater acoustic signal prediction. Complexity (2020) 2020:1–19. doi:10.1155/2020/5167469
6. Jiang J., Shi T., Huang M., Xiao Z. Multi-scale spectral feature extraction for underwater acoustic target recognition. Measurement (2020) 166(15):108227. doi:10.1016/j.measurement.2020.108227
7. Banazadeh A., Seif M., Khodaei M., Rezaie M. Identification of the equivalent linear dynamics and controller design for an unmanned underwater vehicle. Ocean Eng (2017) 139:152–68. doi:10.1016/j.oceaneng.2017.04.048
8. Feng Z., Zuo M., Jian Q., Tian T., Liu Z. Joint amplitude and frequency demodulation analysis based on local mean decomposition for fault diagnosis of planetary gearboxes. Mech Syst Signal Process (2013) 40(1):56–75. doi:10.1016/j.ymssp.2013.05.016
9. Wang S., Zeng X. Robust underwater noise targets classification using auditory inspired time-frequency analysis. Appl Acoust (2014) 78:68–76. doi:10.1016/j.apacoust.2013.11.003
10. Li Y., Xiao C., Jing Y., Yang X. A fusion frequency feature extraction method for underwater acoustic signal based on variational mode decomposition, duffing chaotic oscillator and a kind of permutation entropy. Electronics (2019) 8(1):61. doi:10.3390/electronics8010061
11. Yang X., Wang L., Li X. A novel linear spectrum frequency feature extraction technique for warship radio noise based on complete ensemble empirical mode decomposition with adaptive noise, duffing chaotic oscillator, and weighted-permutation entropy. Entropy (2019) 21:507. doi:10.3390/e21050507
12. Li Y., Tang B., Yi Y. A novel complexity-based mode feature representation for feature extraction of ship-radiated noise using VMD and slope entropy. Appl Acoust (2022) 196:108899. doi:10.1016/j.apacoust.2022.108899
13. Chen Z., Li Y., Liang H., Yu J. Hierarchical cosine similarity entropy for feature extraction of ship-radiated noise. Entropy (2018) 20(6):425. doi:10.3390/e20060425
14. Li M., Liu H., Zhu W., Yang L. Applying improved multiscale fuzzy entropy for feature extraction of MI-EEG. Appl Sci (2017) 7(1):92. doi:10.3390/app7010092
15. Manis G., Aktaruzzaman M., Sassi R. Low computational cost for sample entropy. Entropy (2018) 20(1):61. doi:10.3390/e20010061
16. Cuesta-Frau D., Miró-Martínez P., Oltra-Crespo S., Molina-Picó A., Dakappa P. H., Mahabala C., et al. Classification of fever patterns using a single extracted entropy feature: A feasibility study based on sample entropy. Math Biosciences Eng (2020) 17(1):239–49. doi:10.3934/mbe.2020013
17. Richman J., Moorman J. Physiological time-series analysis using approximate entropy and sample entropy. Am J Physiology-Heart Circulatory Physiol (2000) 278:H2039–49. doi:10.1152/ajpheart.2000.278.6.h2039
18. Chen W., Wang Z., Xie H., Yu W. Characterization of surface EMG signal based on fuzzy entropy. IEEE Trans Neural Syst Rehabil Eng (2007) 15(2):266–72. doi:10.1109/tnsre.2007.897025
19. Zanin M., Zunino L., Rosso O., Papo D. Permutation entropy and its main biomedical and econophysics applications: A review. Entropy (2012) 14(8):1553–77. doi:10.3390/e14081553
20. Li Y., Li Y., Chen Z., Chen X. Feature extraction of ship-radiated noise based on permutation entropy of the intrinsic mode function with the highest energy. Entropy (2016) 18(11):393. doi:10.3390/e18110393
21. Li Y., Geng B., Jiao S. Dispersion entropy-based lempel-ziv complexity: A new metric for signal analysis. Chaos Solitons Fractals (2022) 161:112400. doi:10.1016/j.chaos.2022.112400
22. Bandt C., Pompe B. Permutation entropy: A natural complexity measure for time series. Phys Rev Lett (2002) 88:174102. doi:10.1103/physrevlett.88.174102
23. Rostaghi M., Azami H. Dispersion entropy: A measure for time series analysis. IEEE Signal Process Lett (2016) 23:610–4. doi:10.1109/lsp.2016.2542881
24. Anne H. Multiscale entropy approaches and their applications. Entropy (2020) 22(6):644. doi:10.3390/e22060644
25. Wang Y., Liang Z., Voss L. J., Sleigh J. W., Li X. Multi-scale sample entropy of electroencephalography during sevoflurane anesthesia. J Clin Monit Comput (2014) 28:409–17. doi:10.1007/s10877-014-9550-1
26. Lebreton C., Kbidi F., Graillet A., Jegado T., Alicalapa F., Benne M., et al. PV System failures diagnosis based on multiscale dispersion entropy. Entropy (2022) 24(9):1311. doi:10.3390/e24091311
27. Zhao H., Sun M., Deng W., Yang X. A new feature extraction method based on EEMD and multi-scale fuzzy entropy for motor bearing. Entropy (2017) 19(1):14. doi:10.3390/e19010014
28. Li Y., Li Y., Yu J. A novel feature extraction method for ship-radiated noise based on variational mode decomposition and multi-scale permutation entropy. Entropy (2017) 19(7):342. doi:10.3390/e19070342
29.National Park Service. Soundclips (2022). Available At: https://www.nps.gov/glba/learn/nature/soundclips.
Keywords: multi-scale fuzzy entropy, multi-scale dispersion entropy, multi-scale permutation entropy, multi-scale sample entropy, marine ambient noise, ship-radiated noise, feature extraction
Citation: Zhao D, Lei Y, Xu J and Cai H (2022) A comparative study of four types of multi-scale entropies in feature extraction of underwater acoustic signals for potential GNSS positioning applications. Front. Phys. 10:1058474. doi: 10.3389/fphy.2022.1058474
Received: 30 September 2022; Accepted: 11 October 2022;
Published: 25 October 2022.
Edited by:
Yuxing Li, Xi’an University of Technology, ChinaReviewed by:
Zhenyi Ou, Guangdong Ocean University, ChinaCopyright © 2022 Zhao, Lei, Xu and Cai. This is an open-access article distributed under the terms of the Creative Commons Attribution License (CC BY). The use, distribution or reproduction in other forums is permitted, provided the original author(s) and the copyright owner(s) are credited and that the original publication in this journal is cited, in accordance with accepted academic practice. No use, distribution or reproduction is permitted which does not comply with these terms.
*Correspondence: Yu Lei, bGVpeXVAeHVwdC5lZHUuY24=
Disclaimer: All claims expressed in this article are solely those of the authors and do not necessarily represent those of their affiliated organizations, or those of the publisher, the editors and the reviewers. Any product that may be evaluated in this article or claim that may be made by its manufacturer is not guaranteed or endorsed by the publisher.
Research integrity at Frontiers

Learn more about the work of our research integrity team to safeguard the quality of each article we publish.