
95% of researchers rate our articles as excellent or good
Learn more about the work of our research integrity team to safeguard the quality of each article we publish.
Find out more
ORIGINAL RESEARCH article
Front. Phys. , 07 November 2022
Sec. Optics and Photonics
Volume 10 - 2022 | https://doi.org/10.3389/fphy.2022.1057519
This article is part of the Research Topic State-of-the-Art Laser Spectroscopy and its Applications : Volume II View all 51 articles
 Shoulin Wang1
 Weihua Gong1
 Zhaowei Wang1*Yubin Wei1Yanfang Li1Tingting Zhang1
 Qinduan Zhang1Lin Zhang1Fugang Song1
 Wei Zhang1*Tongyu Liu1,2
Owing to interference fringes in the multireflective gas cell, the detection sensitivity of a system in tunable diode laser absorption spectroscopy (TDLAS) will decrease significantly. In this work, a combined scheme of complete ensemble empirical mode decomposition with adaptive noise (CEEMDAN) and wavelet threshold denoising (WTD) is proposed. Theoretical simulations were performed to validate the effects of the proposed algorithm, which was also verified via a CO2 detection experiment. After CEEMDAN-WTD processing, the noisy intrinsic mode function (IMF), pure IMF, and residual components of the detection signal were identified and reconstructed successfully. Based on analysis of the simulations, CEEMDAN-WTD algorithm improved the signal-to-noise ratio by 1.87 times and decreased the root mean-squared error by 37.6% than the moving average algorithm. For the CO2 detection system, R2 = 0.999 was determined by the calibration experiment. Additionally, based on Allan variance analysis and a long-time experiment, the limit of detection was estimated to be 3.08 ppm for an average time of 148 s and measurement accuracy of 0.65%, respectively. The obtained results sufficiently validate that the CEEMDAN-WTD algorithm can effectively suppress interference fringe noise in TDLAS.
Carbon dioxide (CO2) is considered to be the main component of greenhouse gases (GHGs). Anthropogenic excessive emissions of GHGs have caused severe climate and environmental problems, such as global warming, melting of glaciers, rising sea levels, and extreme weather incidents [1]. Recently, CO2 emissions have increased annually owing to continuous developments with energy consumption and industrialization. Therefore, accurate measurement of CO2 emissions is of great significance for developing and implementing mitigation strategies [2–4]. Tunable diode laser absorption spectroscopy (TDLAS) is a gas detection technology that has been widely used in various fields [5]. It has the advantages of high sensitivity, real-time detection, fast response, and noncontact measurements [6, 7]. TDLAS mainly includes the direct absorption spectrum (DAS) [8] and wavelength modulation spectrum (WMS) [9]. The DAS can be established with a simple structure at very low cost; however, it is easily affected by noise, resulting in low detection sensitivity [10].
Detection equipment with both high accuracy and miniaturization ability have become new topics of research in certain application scenarios of TDLAS. One way to realize such equipment is to achieve long path lengths and compact gas sensors using multireflection gas absorption cells [11]. However, interference fringes caused by multiple reflections of the laser beam on the optical elements can lead to large deviations in the inversion of the concentration and severely affect the accuracy of the detection system. Therefore, suppression of the interference fringes of gas concentration signals has become a focus of current research. Luo et al. [12] proposed an adaptive harmonic feeding generative adversarial network as well as a novel adaptive weighting scheme for interference fringe suppression. They realized an average absolute oxygen concentration inversion of 0.57% for an actual pharmaceutical production line. Although neural networks are powerful tools, the learning time and training data required for the algorithms are considerable. Moreover, local convergence of the minimum value may lead to training failure. Zhou et al. [13] employed a multifrequency modulation method to suppress the interference fringe noise of a residual oxygen detection system in encapsulated pharmaceutical bottles, achieving a signal standard deviation of 2.96 and signal-to-noise ratio (SNR) of 36.979 dB. However, subtle differences in the diameters and thicknesses of different glass bottles can lead to significant variations in the interference demodulation amplitudes and spacing, thus limiting the application of their method to glasses with different parameters.
Kalman filter [14], wavelet transform [15], moving average [16], Wiener filter [17], and Gabor transform [18] have all been used to address noise suppression problems. Although these five methods reduce the influences of interference fringes on the detected signals, they are computationally intensive and not conducive to practical applications. Guo [19] and Yu [20] proposed approaches using empirical mode decomposition (EMD) and combined variable mode decomposition [21] with Savitzky–Golay denoising (VMD-SG), respectively; the computation times of these two methods were less than those of the Kalman and other methods. However, the EMD algorithm has problems with mode mixing and endpoint effects. Furthermore, the EMD algorithm directly removes the high-frequency intrinsic mode function (IMF), which can cause signal distortion upon reconstruction. To solve the mode-mixing problem of EMD, Huang [22] proposed ensemble empirical mode decomposition (EEMD); taking the characteristic that the mean value of white noise is zero, EEMD eliminates mode mixing by adding uniformly distributed Gaussian white noise in the decomposition process and averaging the decomposition results. However, the purity of the original signal in inevitably degraded in EEMD; to overcome this disadvantage, the complete ensemble empirical mode decomposition with adaptive noise (CEEMDAN) algorithm was first proposed in 2011 by Torres et al. [23]. The CEEMDAN algorithm is an improved modified version of EEMD, where white noise is added at each EMD stage and its specific residual is calculated to obtain each modal component; after decomposition, the reconstruction error is almost zero. Compared to EEMD, it overcomes mode mixing and effectively reduces reconstruction errors. However, it causes loss of useful high-frequency information during signal reconstruction. The wavelet threshold denoising (WTD) method applied in signal reconstruction is used to address this concern. Advantageously, WTD adapts to the requirements of time–frequency signal analysis to focus on arbitrary details of the signal. However, as the hard threshold function is not continuous at the threshold, the signal can easily fluctuate after hard-threshold-function processing. In contrast, the soft threshold function is coherent, but the signal loses a part of the high-frequency coefficients above the soft threshold.
In this work, a CEEMDAN and WTD combined algorithm is designed for application to direct absorption spectroscopy. The remainder of this paper is organized as follows. First, we discuss the causes of interference fringes, how to combine the two algorithms, and the methods for improvement. Then, the denoising ability of the combined algorithm is demonstrated via simulation analysis and comparisons with other filtering algorithms. Finally, we analyze the stability and detection limit of the CEEMDAN-WTD algorithm via calibration experiments and Allan variance analysis.
When a laser beam passes through a certain gas medium, the light intensity of the beam decays owing to partial absorption by the gas. The input and output light intensities (I0 and It, respectively) satisfy Beer–Lambert law, and the output light intensity can be described as follows [24, 25]:
where S(T) is the line strength of the spectral feature, C is the concentration of the gas to be measured, P is the pressure of the gas, L is the effective optical path length of the laser passing through the gas, and φ(ν-ν0) represents the gas absorption spectral line shape function.
Almost all TDLAS systems show optical interference fringes that are caused by multiple reflections of the laser on the surface of the optical element; these fringes are also known as the etaloning effects. The transmitted light intensity can be calculated from the phase difference between multiple beams of light. According to the principle of the Fabry–Perot interferometer, the transmitted light intensity can be expressed as [26]
Here, R is the interface reflectivity (assuming that the two interfaces have the same reflectivity), δ is the phase difference between the directly transmitted beam and that after secondary reflection. For the small surface reflectances of the lenses and transmission windows used in TDLAS systems, the transmitted light intensities sinusoidally vary with phase difference. Then, Eq. 2 can be simplified as
The laser is assumed to be incident in a direction perpendicular to the parallel glass plate. Then, the distance between the two parallel interfaces is l, refractive index of the optical medium through which the laser passes is n, and laser wavelength is λ. The phase difference in Eq. 3 is given by
The transmitted light intensity can be calculated by combining Eqs. 3, 4 as
Optical interfaces, such as laser windows, gas-cell windows, detector windows, and collimating lenses, are present in TDLAS systems, and all of these may cause optical interference fringes. The strength of the optical interference fringe is proportional to the reflectance of the interface in a direct absorption spectroscopy detection system. The reflectance of a typical optical quartz-glass surface is about 0.02 [27]. Theoretically, based on Eq. 3, the equivalent absorbance fluctuation due to the etalon effect is 0.04. Moreover, the equivalent absorbance corresponding to the gas detection limit in the current direct absorption spectroscopy detection system based on TDLAS is 10−3, which is considerably less than 0.04. Therefore, to utilize the high accuracy and sensitivity of TDLAS, the direct absorption spectroscopy detection system needs to be optimized, and optical interference fringes need to be suppressed.
The CEEMDAN algorithm decomposes a signal (original signal with Gaussian white noise) into finite IMFs and residual components [28]. The specific steps are as follows [29]:
1) Add i (i = 1,2,3,4 … I) sets of Gaussian white noise to the original signal, which is defined as x(t) so that the signal to be processed is obtained as
where ε is the amplitude (ratio of standard deviation of the amplitude of the white noise to that of the original signal), and ei(t) is the ith content N (0,1) of the added Gaussian white noise.
2) Decompose each xi(t) using EMD to obtain the first IMFs:
The first residual is obtained by subtracting the first IMF from the original signal x(t):
3) Add i sets of white noise to r1(t) to compose a new signal to be processed:
Decompose each xi(t) by EMD to extract the second mode as follows:
Additionally, the second residual is
4) Repeat steps (1)–(3) until the resulting residual can no longer be decomposed. Finally, the k modal components, remaining residual rk(t), and original signal x(t) can be expressed as
WTD filters the signal to remove noise and extract the maximum useful signal; it is based on the principle that the selected wavelet basis function at different scales and a certain shift are applied by inner product with the original signal. Then, the result is mapped to the time and frequency domains. Owing to the different properties of the wavelet coefficients of the signal and noise, noise can be maximally filtered out by selecting a threshold value and reconstructing the signal.
Threshold handling, including selection of both the threshold value and threshold function, is significant for WTD analysis [30]. The wavelet coefficients of the noise are analyzed to select a suitable threshold value that is greater than the maximum noise level. Hard and soft threshold functions are commonly used for this purpose, which are given in Eqs. 13, 14, respectively:
Here, ωs denotes the set of wavelet coefficients after decomposition, ω is the set of wavelet coefficients, and λj is the threshold value. However, both the hard and soft threshold functions have certain defects, and the denoising results are not ideal for complex signals. The hard threshold function preserves the local characteristics of the signal; however, as it is not continuous at the threshold value, the reconstructed signal can easily oscillate (pseudo-Gibbs phenomenon).
The soft threshold function is a continuous function; hence, the smoothness of its signal is better than that of the hard threshold function. Additionally, wavelet coefficients less than the threshold are set to 0. However, there is a constant deviation between the original wavelet coefficients and those after decomposition. Therefore, to overcome the shortcomings of the soft and hard threshold functions, we present an improved threshold function having the following expression:
where a is the adjustment factor. When a = 0, the improved threshold function is close to the semisoft threshold function. When a tends to infinity, the new threshold function can be approximated to the hard threshold function. Unlike the hard threshold function, our proposed function is continuous. By changing the value of a to modify the properties of the threshold function, abrupt changes can be handled smoothly and the oversized wavelet coefficients are quantized such that they are close to the original values, thereby significantly preserving the true signal. A comparison of the different threshold functions is presented in Figure 1.
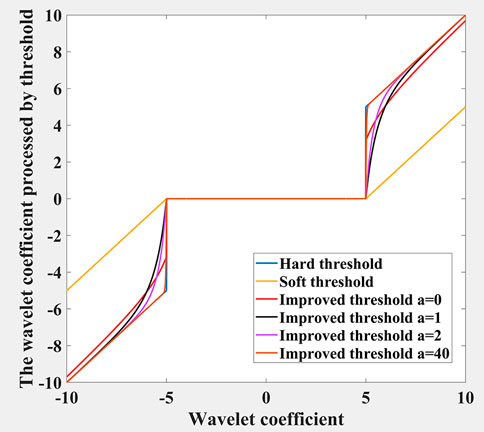
FIGURE 1. Comparison of different thresholding functions.
The flowchart of the CEEMDAN-WTD algorithm is given in Figure 2. CEEMDAN is first performed on the original signal to obtain multiple groups of IMFs. The correlation coefficient method is used to determine the IMF component that is dominated by noise. Then, this IMF component with noise is handled by WTD to improve the problem of loss of the real signal during the CEEMDAN process. Finally, the pure IMF component decomposed by CEEMDAN, noisy IMF component after wavelet processing, and residual component are reconstructed to obtain the processed signal.
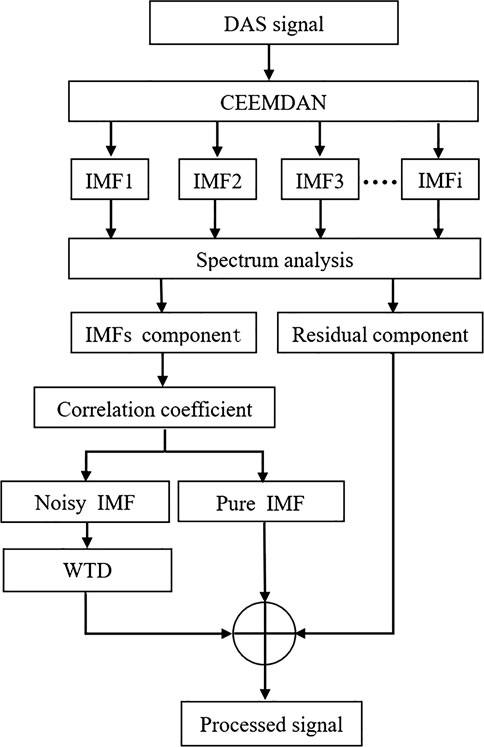
FIGURE 2. The flowchart of the CEEMDAN-WTD.
Herein, a CO2 detection system based on the DAS is employed to verify the CEEMDAN-WTD algorithm. The simulation parameters are as follows: standard atmospheric pressure, temperature T = 296 K, and effective absorption optical path length of the gas L = 200 cm. It is well known that the interference fringes are usually overlaid on real signals in the form of periodic sinusoidal functions to yield periodic fluctuations in the detected signal. Therefore, interference fringe noise is simulated by adding a sinusoidal signal with a certain amplitude to the simulated signal and random noise. Figure 3 displays this simulation signal.
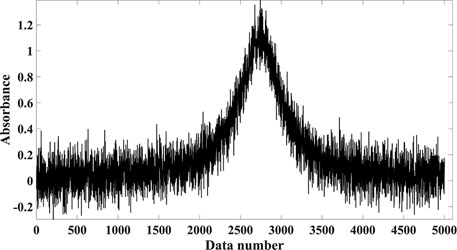
FIGURE 3. Simulation signal.
Before the signal is processed using the CEEMDAN algorithm, Gaussian white noise of amplitude Nstd, average number of signals N, and maximum number of iterations allowed Maxiter are selected. In this study, Nstd = 0.2, N = 100, and Maxiter = 2000. The 12 IMF components and the residuals are shown in Figure 4. Spectral analysis was performed for each IMF component. Figure 5 shows that the large-amplitude low-frequency mode components are decomposed precisely and that there is no confusion between the modes.
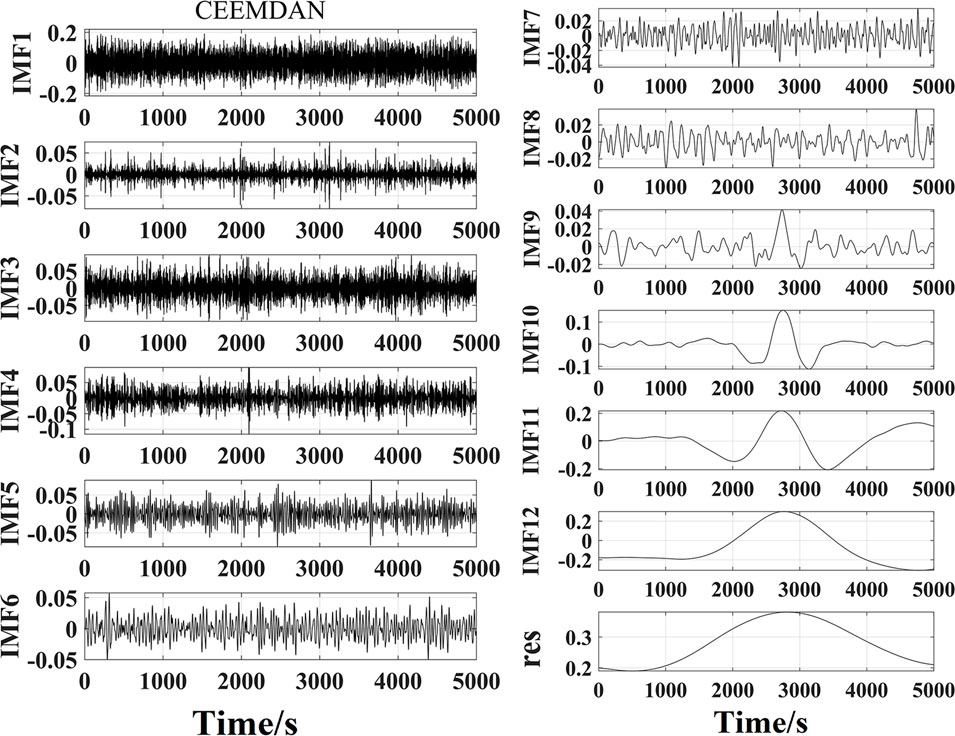
FIGURE 4. Decomposition diagram obtained IMF1-IMF12 using CEEMDAN.
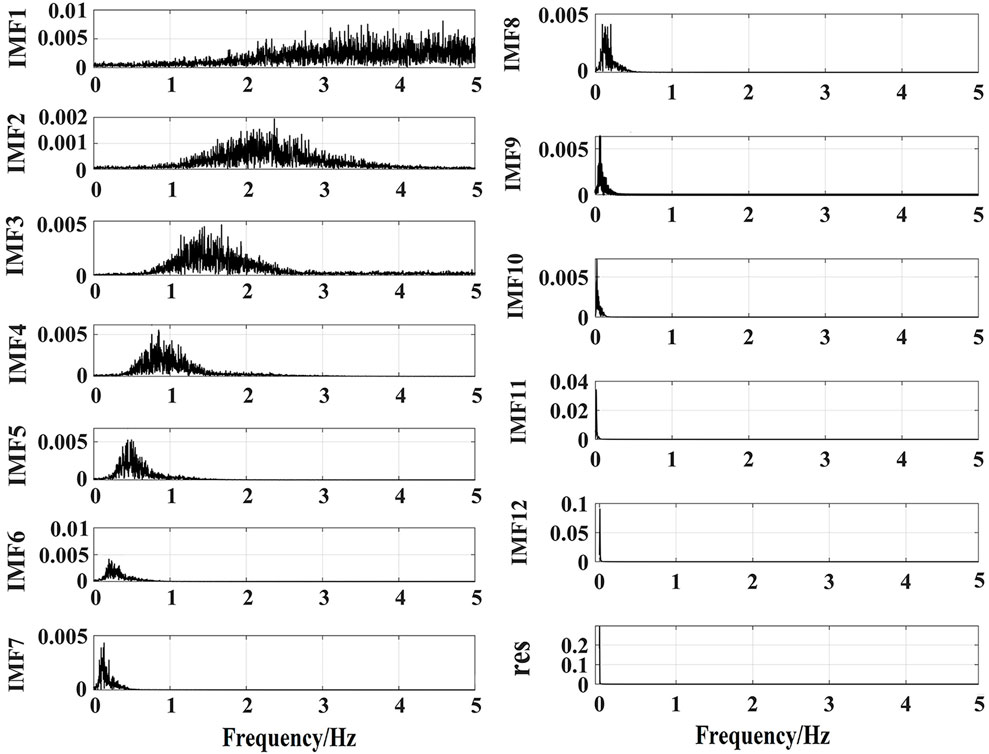
FIGURE 5. Frequency spectrum of IMF1-IMF12.
Generally, interference fringe noise is a high-frequency signal. For a signal with such noise, the signal energy is mostly concentrated in the IMF component with a relatively large order. To accurately discriminate the noisy IMF components, the correlation coefficient R is used herein to reflect the relationship between the IMF component and original signal to determine the IMF component with noise [31]. Table 1 presents the calculation results.
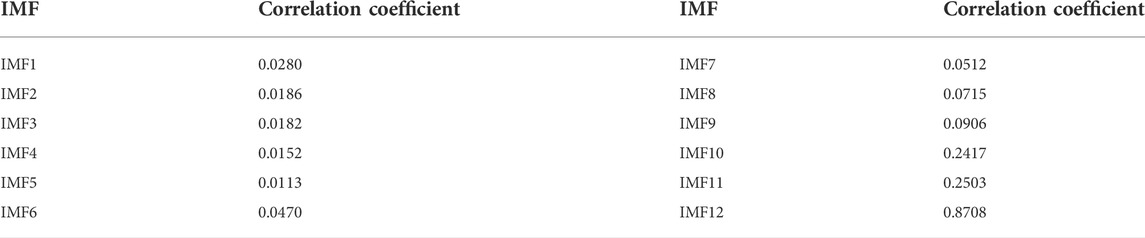
TABLE 1. Correlation coefficients between the IMF components and original signal.
IMF1–IMF9 components are correlation coefficients less than 0.1, which are considered as components with noise [32]. These components are denoised using the improved WTD proposed in this work. The Daubechies wavelet (db10) was chosen as the wavelet basis, and the number of decomposition layers was set as 7. To verify the steps of the CEEMDAN-WTD algorithm, the denoising results were compared with those of the moving average, Kalman filter, WTD, EMD-WTD, EEMD-WTD, CEEMD-WTD, and VMD-WTD. The comparison shows that the CEEMDAN-WTD algorithm is significantly better than the other methods in terms of suppression of interference fringes and has equally excellent peak value extraction. The denoised results of the above methods are compared in Figure 6 and Figure 7.
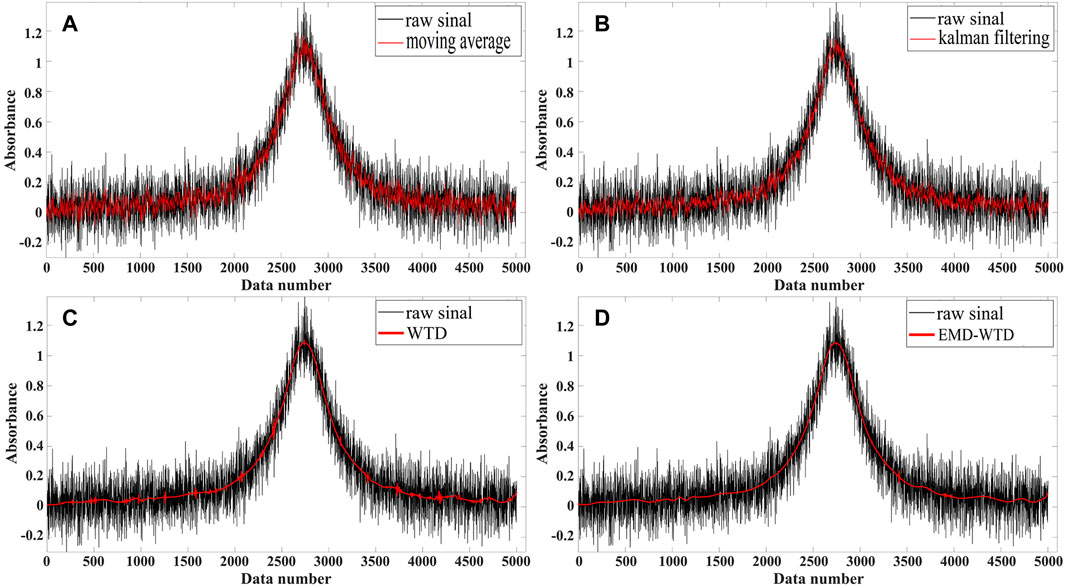
FIGURE 6. Comparison of moving average, Kalman filtering, WTD and EMD-WTD methods.
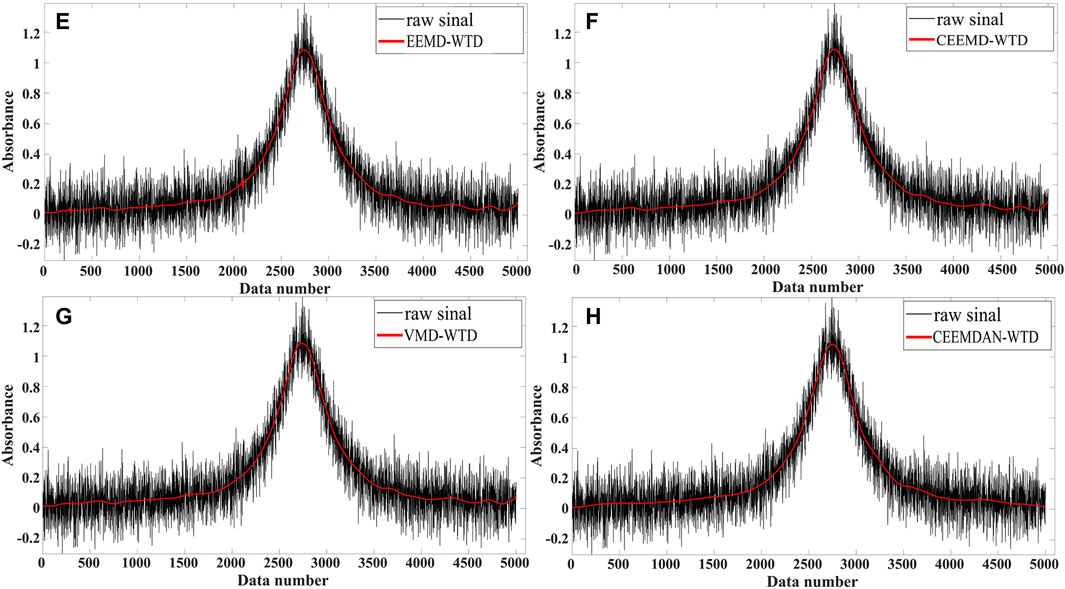
FIGURE 7. Comparison of EEMD-WTD, CEEMD-WTD, VMD-WTD and CEEMDAN-WTD methods.
SNR and root mean-squared error (RMSE) [33] are considered as two important bases for evaluating the processing effect; SNR and RMSE are determined using Eqs. 16, 17, respectively.
where Xi is the original signal, xi the signal after processing, and N is the number of sampling points of the signal.
SNR represents the ratio of effective power of the signal to that of the noise; it is proportional to the denoising effect. RMSE reflects the deviation between the measured and actual values; it indicates the degree of signal distortion. Contrary to SNR, the smaller the RMSE, the smaller is the deviation between the two signals and more satisfactory is the denoising effect. The calculated SNR and RMSE results of the eight denoising methods are shown in Table 2. Among these methods, the SNR improvement of the signal is largest after CEEMDAN-WTD processing. The SNR improved by 1.87 times from 17.4605 to 32.6050 and RMSE reduced by 37.6% from 0.0456 to 0.0080 compared to the moving average approach; this indicates that CEEMDAN-WTD has the best denoising effect.
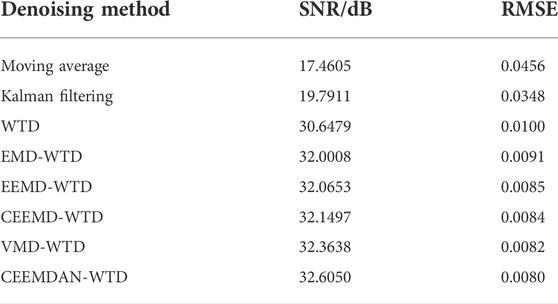
TABLE 2. SNR and RMSE results after applying various denoising methods.
The experimentally acquired CO2 concentration signal was processed using the CEEMDAN-WTD algorithm at temperature T = 300 K, pressure P = 1 atm, and optical path length L = 200 cm. Figure 8 illustrates the detection principle of the CO2 system. The source uses a distributed feedback (DFB) laser (DFB-2004-4.5-BF2-FC/APC, Nanosystems and Technologies GmbH, Germany) with a center frequency of 2004 nm. The laser output wavelength was controlled through a temperature controller and laser driver (LDC501, Stanford Research Systems, USA). The laser wavelength varied with current at a rate of 0.026 nm/mA. A signal generator (33210A, Keysight, USA) was used to generate a 10 Hz triangular wave signal that was applied to the laser driver to scan the center wavelength over the CO2 absorption line. The collimated laser beam entered the gas absorption cell and reached the photodetector after multiple reflections. The gas absorption cell employed was a White cell with an effective absorption path length of 200 cm. The photoelectric detector converted the light signals containing the gas concentration information into electrical signals. The data acquisition card (DAQ) (PCL-4472, National Instruments, USA) captured the electrical signal and input it to the PC for analysis and processing.
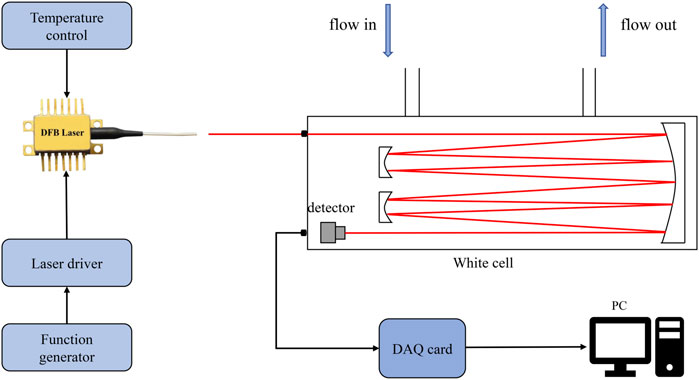
FIGURE 8. TDLAS experimental system structure.
As shown in Figure 9 and Figure 10, the DAS signal of 300 ppm CO2 was detected, and the results were processed using various methods. As shown in the figure, the original signal represented by the black curve was severely disturbed by noise; obvious interference fringe noise was present, which can result in errors in the detected absorption peak values. When using the traditional moving average method, the reconstructed signal still contained disturbances from the interference fringe noise. Further, the WTD and other methods were used for comparison, and the reconstructed DAS signal showed poor smoothness. In the results from CEEMDAN-WTD processing, the overall curve was smooth and the useful signal features were preserved well. From locally magnified images, we determined that the local signal did not mutate. In addition, the positions of the features remained unchanged, and the interference fringe noise was suppressed well. The results after denoising by various methods are shown in Table 3. The SNR and RMSE values of the proposed method are 14.3158 dB and 5.3093 × 10⁻⁴, respectively.
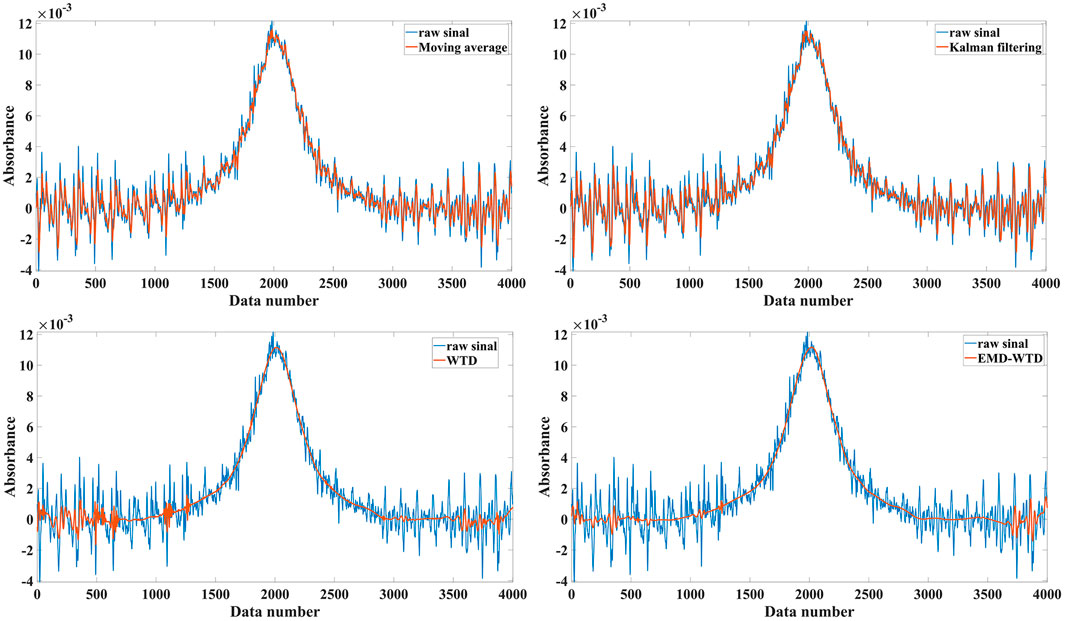
FIGURE 9. DAS signal of CO2 detected in the experiment and the denoising result by using moving average, Kalman filtering, WTD and EMD-WTD.
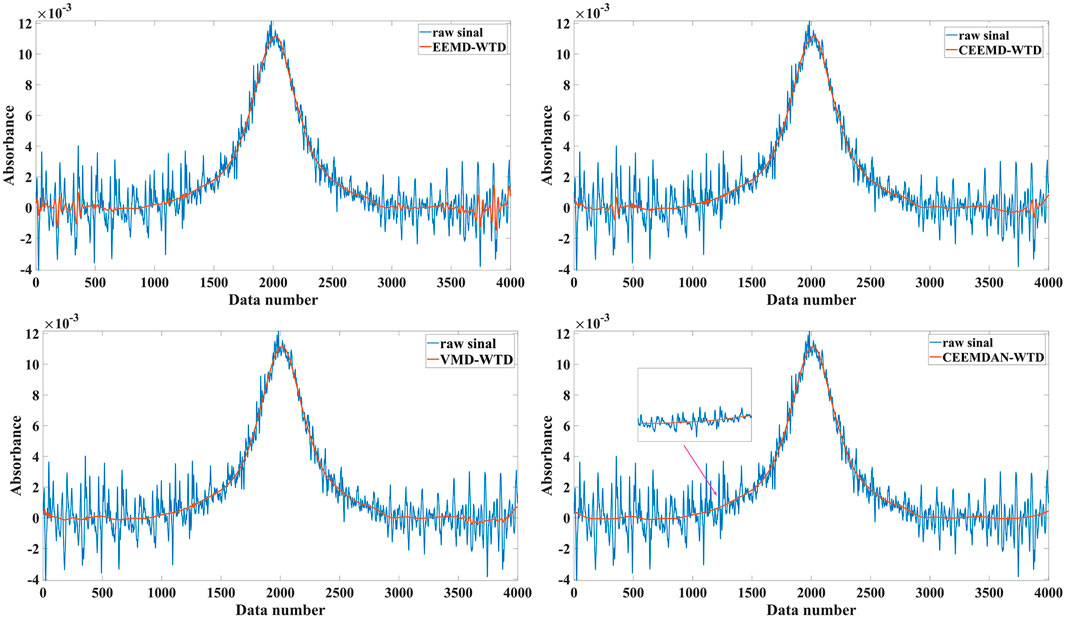
FIGURE 10. DAS signal of CO2 detected in the experiment and the denoising result by using EEMD-WTD, CEEMD-WTD, VMD-WTD and CEEMDAN-WTD.
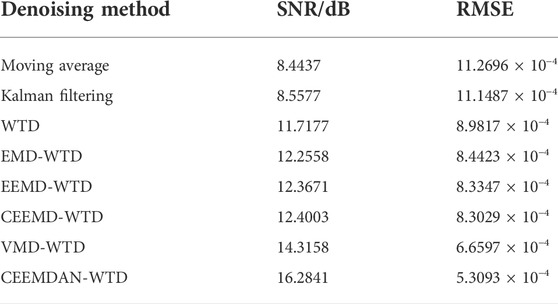
TABLE 3. SNR and RMSE results after denoising the DAS signal.
We varied the CO2 concentrations (50 ppm, 60 ppm, 70 ppm, 100 ppm, 200 ppm, and 300 ppm) under the same experimental conditions (P = 1 atm, T = 300 K, and L = 200 cm) and collected the absorption spectra of CO2 [34]. The peaks of the absorption spectra were extracted using the noise reduction process proposed herein, and a straight line was fitted based on the concentrations and peaks of the absorption spectra; the expression of the straight line is as follows [35]:
Figure 11 illustrates the fitting results, where the peak value of the DAS signal has a favorable linear relationship with the gas concentration. The determination coefficient (R2) was calculated to be 0.999. This demonstrates the excellent linear concentration response of the CO2 detection system with the CEEMDAN-WTD denoising algorithm.

FIGURE 11. The fitting result in the calibration experiment.
Allan variance is an important tool for quantitatively analyzing various types of noise; it can be used to visually observe the variation patterns of noise with integration time as well as evaluate the sensitivity of the system [36]. In the experiment, 1000 data points of CO2 at a concentration of 50 ppm were measured with a sampling period of 1 s. The signal amplitude was converted to concentration using Eq. 16. The 1000 data points were analyzed via Allan variance. Figure 12 shows the relationship between the Allan deviation and averaging time τ. From these, the lower limit of detection (LOD) of the system can be obtained [37]; when the averaging time was 1 s, the LOD was 7.82 ppm, and when the averaging time was 148 s, the LOD reached a minimum of 3.08 ppm.
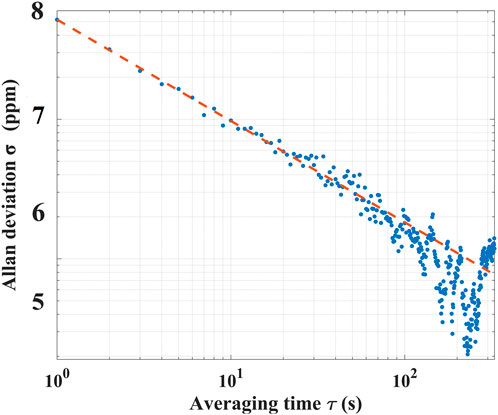
FIGURE 12. Allan variance plot for time series measurements of pure CO2 and a slope indicating white behavior of the instrument.
Stability is an important indicator that affects the sensitivity of a detection system. Theoretically, a perfectly stable detection system can have extremely high detection sensitivity if the detected signals are infinitely averaged. However, various factors can cause system instabilities, such as changes in the laser wavelength due to ageing, temperature drift, white noise, and interference fringe noise from multiple reflections of the laser. Therefore, the actual experimental detection system is only stable for a limited period, which means that the system has an optimal averaging time. To further evaluate the stability of the system, a one-hour experiment was carried out in the lab for detecting 50 ppm of CO2 gas continuously. The upper panels of Figure 13 show the time series of the measured concentrations of 50 ppm CO2. The distribution histograms of deviations of the measured concentrations and the fitting curve of the probability distribution are depicted in the lower panels of Figure 13. From these, the half-width at half maximum (HWHM) was calculated as 0.326 ppm. Thus, it was confirmed that the precision of system measurement was better than 0.65%. The measured concentration data obviously resembled a Gaussian distribution. These results verify that the system has excellent precision and stability.
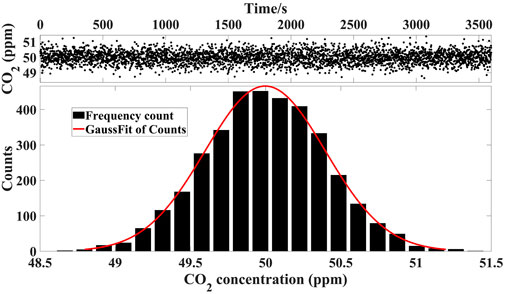
FIGURE 13. The measured CO2 concentration data (top) and the distribution histograms of deviation (bottom). The red line depicts a Gaussian profile.
In summary, a signal processing algorithm combining CEEMDAN and WTD was proposed herein to suppress the interference fringe noise of the TDLAS system. Moreover, the equation and detection procedure of the proposed algorithm are given. The algorithm reduces large reconstruction errors and loss of useful signals that occur when using the EEMD algorithm. Furthermore, the proposed novel threshold function overcomes the shortcomings of the soft and hard threshold functions. The CEEMDAN-WTD algorithm was evaluated with both simulation and experimental signals. The results showed that the CEEMDAN-WTD algorithm achieved better interference fringe noise suppression performance than the moving average, Kalman filter, WTD, EMD-WTD, EEMD-WTD, CEEMD-WTD, and VMD-WTD algorithms. Additionally, it exhibited excellent peak value extraction performance. The CEEMDAN-WTD algorithm increased the SNR by 1.87 times and decreased the RMSE by 37.6% compared to the moving average algorithm; its R2 was determined as 0.999 through calibration experiments. Allan variance analysis indicated that the proposed algorithm had a minimum system detection limit of 3.08 ppm for an averaging time of 148 s. From the long-time experiment, a measurement accuracy of 0.65% was verified.
The raw data supporting the conclusions of this article will be made available by the authors without undue reservation.
SW: methodology and writing—original draft. WG: software. ZW: writing—review and editing. YW: validation. YL: formal analysis. TZ: project administration and supervision. QZ: conceptualization. LZ: discussion and suggestions. FS: proofreading. WZ: resources. TL: funding acquisition.
This work was supported by the National Key Research and Development Program of China (Grant No. 2021YFB3201904), Natural Science Foundation of Shandong Province (Grant Nos. ZR2020QF098, ZR2020KC012, and ZR2022QF035), Innovation Team Program of Jinan (Grant Nos. 2020GXRC032 and 2021GXRC037), and Program from Qilu University of Technology (Grant Nos. 2022JBZ01-04, 2022GH001, 2022PX045, and 2022PT029).
TL was employed by Shandong Micro-Sensor Photonics Ltd. The remaining authors declare that this research was conducted in the absence of any commercial or financial relationships that could be construed as a potential conflict of interest.
All claims expressed in this article are solely those of the authors and do not necessarily represent those of their affiliated organizations, or those of the publisher, editors, and reviewers. Any product that may be evaluated in this article or claim that may be made by its manufacturer is not guaranteed or endorsed by the publisher.
1. Zhao YT, Guo JJ, Bao C, Liang CY, Jain HK. Knowledge graph analysis of human health research related to climate change. Int J Environ Res Public Health (2020) 17(20):7395. doi:10.3390/ijerph17207395
2. Yu JN, Ming TK, Yin CK, Raima N, Sajid A, Wasim I. Role of solar-based renewable energy in mitigating CO2 emissions: Evidence from quantile-on-quantile estimation. Renew Energ (2022) 182:216–26. doi:10.1016/J.RENENE.2021.10.002
3. Zhang ZH, Zhang FB, Xu B, Xie HQ, Fu BT, Lu X, et al. High-sensitivity gas detection with air-lasing-assisted coherent Raman spectroscopy. Ultrafast Sci (2022) 2022:1–8. doi:10.34133/2022/9761458
4. Fu Y, Cao JC, Yamanouchi K, Xu HL. Air-laser-based standoff coherent Raman spectrometer. Ultrafast Sci (2022) 2022:1–9. doi:10.34133/2022/9867028
5. Werle P. A review of recent advances in semiconductor laser based gas monitors. Spectrochimica Acta A: Mol Biomol Spectrosc (1998) 54(2):197–236. doi:10.1016/S1386-1425(97)00227-8
6. Ma YF. Recent advances in qepas and qepts based trace gas sensing: A review. Front Phys (2020) 8:268. doi:10.3389/FPHY.2020.00268
7. Liu XN, Ma YF. Tunable diode laser absorption spectroscopy-based temperature measurement with a single diode laser near 1.4 μm. Sensors (2022) 22(16):6095. doi:10.3390/s22166095
8. Razaa M, Ma LH, Yao C, Yang M, Wang Z, Wang Q, et al. MHz-rate scanned-wavelength direct absorption spectroscopy using a distributed Feedback diode laser at 2.3 µm. Opt Laser Techn (2020) 130:106344. doi:10.1016/j.optlastec.2020.106344
9. Rieker GB, Jeffries JB, Hanson RK. Calibration-free wavelength-modulation spectroscopy for measurements of gas temperature and concentration in harsh environments. Appl Opt (2009) 48(29):5546–60. doi:10.1364/AO.48.005546
10. Lin S, Chang J, Sun JC, Xu P. Improvement of the detection sensitivity for tunable diode laser absorption spectroscopy: A review. Front Phys (2022) 10:136. doi:10.3389/FPHY.2022.853966
11. Jiang J, Zhao MX, Ma GM, Song HT, Li CR, Han X, et al. TDLAS-based detection of dissolved methane in power transformer oil and field application. IEEE Sens J (2018) 18(6):2318–25. doi:10.1109/jsen.2017.2788871
12. Luo QW, Zhou J, Li WC, Yang CH, Gui WH. Interference fringe suppression for oxygen concentration measurement using adaptive harmonic feeding generative adversarial network. IEEE Sens J (2021) 22(3):2419–29. doi:10.1109/JSEN.2021.3133909
13. Zhou BX, Luo QW, Liu ZH, Yang CH. Multi-frequency modulation method for optical interference suppression in TDLAS system. In: Proceedings of the 32nd China Process Control Conference (2021). p. 1602. doi:10.26914/c.cnkihy.2021.047630
14. Leleux DP, Claps R, Chen W, Harman TL. Applications of Kalman filtering to real-time trace gas concentration measurements. Appl Phys B: Lasers Opt (2002) 74(1):85–93. doi:10.1007/s003400100751
15. Li CL, Guo XQ, Ji WH, Ma WG, Qiu X. Etalon fringe removal of tunable diode laser multi-pass spectroscopy by wavelet transforms. Opt Quan Electron (2018) 50(7):275–11. doi:10.1007/s11082-018-1539-4
16. Zou DB, Chen WL, Du ZF, Xu KX, Qi RB, Li HL, et al. Selection of digital filtering in the escaping ammonia monitoring with TDLAS. Spectral Anal (2012) 32(09):2322–6. doi:10.3964/j.issn.1000-0593(2012)09-2322-05
17. Kireev S, Kondrashov A, Shnyrev S. Application of the Wiener filtering algorithm for processing the signal obtained by the TDLAS method using the synchronous detection technique for the measurement problem of 13CO2 concentration in exhaled air. Laser Phys Lett (2019) 16(8):085701. doi:10.1088/1612-202X/ab27b9
18. Zhang LF, Wang F, Wei H, Wang J, Cui HB, Zhao GJ. Denoising of digital filtering based on wavelength modulation spectroscopy. Laser & Optoelectronics Progress (2021) 58(7):0730001–402. doi:10.3788/LOP202158.0730001
19. Guo XQ, Qiu XB, Ji WH, Shao LG, Li CL Minimization of interference fringes in tunable diode laser absorption spectrum based on empirical mode decomposition. Laser & Optoelectronics Progress (2018) 55(11):113001–469. doi:10.3788/LOP55.113001
20. Liang Y, Liu TG, Liu K, Jiang JF, Li YF. Optimized gas detection method based on variational mode-decomposition algorithm. Chinese Journal of Lasers (2021) 48(7):0706003–144. doi:10.3788/CJL2021480706003
21. Dragomiretskiy K, Zosso D. Variational mode decomposition. IEEE Trans Signal Process (2014) 62(3):531–44. doi:10.1109/TSP.2013.2288675
22. Wu ZH, Norden EH. Ensemble empirical mode decomposition: A noise-assisted data analysis method. Adv Adapt Data Anal (2009) 1(1):1–41. doi:10.1142/S1793536909000047
23. Torres ME, Colominas MA, Schlotthauer G, Flandrin P. A Complete ensemble empirical mode decomposition with adaptive noise. In: Proceedings of the 2011 IEEE International Conference on Acoustics: Speech and Signal Processing (ICASSP) (2011). p. 4144–7. doi:10.1109/ICASSP.2011.5947265
24. Jia XN, Roels J, Baets R, Roelkens G. A miniaturised, fully integrated NDIR CO2 sensor on-chip. Sensors (2021) 16:5347. doi:10.3390/s21165347
25. Abitan H, Bohr H, Buchhave P. Correction to the Beer-Lambert-Bouguer law for optical absorption. Appl Opt (2008) 47(29):5354–7. doi:10.1364/ao.47.005354
26. Werle P. Accuracy and precision of laser spectrometers for trace gas sensing in the presence of optical fringes and atmospheric turbulence. Appl Phys B (2011) 102(2):313–29. doi:10.1007/s00340-010-4165-9
27. He XY, Su Y. Machined surface microstructure of optical silica glasses. J Wuhan Univ Techn (2010) 32(13):34–7. doi:10.3963/j.issn.1671-4431.2010.13.009
28. Xu L, Cai DS. Research on signal processing of fiber optic gyroscope based on least square smooth filtering and CEEMDAN. J Vibration Shock (2020) 39(10):269–78. doi:10.13465/j.cnki.jvs.2020.10.037
29. Meng XM, Cai CC, Wang YQ, Wang QJ, Tan LL. Remaining useful life prediction of lithium-ion batteries using CEEMDAN and WOA-SVR model. Front Energ Res (2022) 10:1460. doi:10.3389/fenrg.2022.984991
30. Mou XJ, Li HL, Tuo XG. Research on improved wavelet threshold denoising algorithm and its simulation. Process Automation Instrumentation (2020) 41(08):46–50. doi:10.16086/j.cnki.issn1000-0380.2019070036
31. Xie MW. The relation of covariance, correlation coefficient and correlation. J Appl Stat Manage (2004) 03:33–6. doi:10.13860/j.cnki.sltj.2004.03.008
32. Fei HL, Liu M, Qu GJ, Gao Y. A method for blasting vibration signal denoising based on ensemble empirical mode decomposition-wavelet threshold. Explosion and Shock Waves (2018) 38(01):112–8. doi:10.11883/bzycj-2016-0148
33. Li GL, Zhang ZC, Zhang XN, Wu YH, Ma K, Jiao Y, et al. Performance of a mid-infrared sensor for simultaneous trace detection of atmospheric CO and N2O based on PSO-kelm. Front Chem (2022) 10:930766. doi:10.3389/fchem.2022.930766
34. Qiao SD, Sampaolo A, Patimisco P, Spagnolo V, Ma YF. Ultra-highly sensitive HCl-LITES sensor based on a low-frequency quartz tuning fork and a fiber-coupled multi-pass cell. Photoacoustics (2022) 27:100381. doi:10.1016/j.pacs.2022.100381
35. Zhang L, Li YF, Wei YB, Wang ZW, Zhang TT, Gong WH, et al. SNR enhancement of direct absorption spectroscopy utilizing an improved particle swarm algorithm. Photonics (2022) 6:412. doi:10.3390/photonics9060412
36. Luo QW, Yang CH, Song C, Zhou J, Gui WH. TDLAS/WMS embedded system for oxygen concentration detection of glass vials with variational mode decomposition. IFAC-PapersOnLine (2020) 53(2):11626–31. doi:10.1016/J.IFACOL.2020.12.644
Keywords: tunable diode laser absorption spectroscopy (TDLAS), complete ensemble empirical mode decomposition with adaptive noise (CEEMDAN), interference fringes, wavelet threshold denoising (WTD), carbon dioxide
Citation: Wang S, Gong W, Wang Z, Wei Y, Li Y, Zhang T, Zhang Q, Zhang L, Song F, Zhang W and Liu T (2022) Interference fringe suppression in tunable diode laser absorption spectroscopy based on CEEMDAN-WTD. Front. Phys. 10:1057519. doi: 10.3389/fphy.2022.1057519
Received: 29 September 2022; Accepted: 17 October 2022;
Published: 07 November 2022.
Edited by:
Yufei Ma, Harbin Institute of Technology, ChinaReviewed by:
Jinbao Xia, Shandong University, ChinaCopyright © 2022 Wang, Gong, Wang, Wei, Li, Zhang, Zhang, Zhang, Song, Zhang and Liu. This is an open-access article distributed under the terms of the Creative Commons Attribution License (CC BY). The use, distribution or reproduction in other forums is permitted, provided the original author(s) and the copyright owner(s) are credited and that the original publication in this journal is cited, in accordance with accepted academic practice. No use, distribution or reproduction is permitted which does not comply with these terms.
*Correspondence: Zhaowei Wang, encud2FuZ0BxbHUuZWR1LmNu; Wei Zhang, emhhbmcud2VpQHFsdS5lZHUuY24=
Disclaimer: All claims expressed in this article are solely those of the authors and do not necessarily represent those of their affiliated organizations, or those of the publisher, the editors and the reviewers. Any product that may be evaluated in this article or claim that may be made by its manufacturer is not guaranteed or endorsed by the publisher.
Research integrity at Frontiers
Learn more about the work of our research integrity team to safeguard the quality of each article we publish.