
95% of researchers rate our articles as excellent or good
Learn more about the work of our research integrity team to safeguard the quality of each article we publish.
Find out more
ORIGINAL RESEARCH article
Front. Phys. , 29 November 2022
Sec. Soft Matter Physics
Volume 10 - 2022 | https://doi.org/10.3389/fphy.2022.1055393
This article is part of the Research Topic Probing Out-of-Equilibrium Soft Matter View all 10 articles
 Ya-Wen Chang1,2
 Ricardo Cruz-Acuña3,4Michael Tennenbaum1
 Alexandros A. Fragkopoulos1
 Andrés J. García4,5
 Alberto Fernández-Nieves1,6,7,8*
Out-of-plane curvature is an important, but poorly explored geometric parameter that influences cell behavior. We address the impact of curvature on epithelial proliferation through monitoring how MDCK cells proliferate on planar and curved toroidal hydrogel substrates with a broad range of Gaussian curvatures. We illustrate in detail the imaging processing methodology to characterize curved surfaces and quantify proliferation of cells. We find that MDCK cells grow readily on both curved and flat surfaces and can cover the entire surface of the toroidal structure as long as the initial seeding is uniform. Our analysis shows that proliferation does not depend on Gaussian curvature within the range probed in our experiment, but rather on cell density. Despite epithelial proliferation is insensitive to the curvature range presented in this study, the toroidal-construct fabrication technique and image processing methodology may find utility for probing cell processes like collective migration, as it involves long-range force transmission.
The physical environment of tissue plays a significant role in controlling the dynamic properties of cells, and through mechanical transduction, work synchronously with the chemical cues and biomolecular signaling processes to direct cell proliferation, migration, differentiation, and apoptosis [1–4]. Relevant physical parameters include stiffness, confinement, topology, and geometry. While many of these have been investigated extensively, substrate curvature has recently been highlighted as one of the least explored and perhaps most overlooked properties, despite its omnipresence in the in vivo environment [5, 6].
Subcellular topology on the order of nano- and micrometers, like those in fibril collagen matrixes or electrospun fibers, are well known to influence single cell alignment, cytoskeleton organization, and the direction in which cells grow [7, 8], a phenomena referred to as contact guidance [9]. The influence of larger geometric features that are on the order of a cell or more on cell behavior, however, are relatively unknown. Recently, several groups have shown evidence that macroscale curvature can direct cytoskeleton organization and cell alignment for different cell types, albeit to different extent depending on the cell type and confluency. Bade et al. showed that isolated human vascular smooth muscle cells and mouse embryonic fibroblasts on cylinders align weakly with the cylinder axis when the cylinder radius is larger than the cell size, while cells within confluent monolayers align strongly [10]. The study by Yu et al. showed that the density effect on epithelial cell alignment within confluent monolayers is enhanced on convex surfaces compared to concave surfaces [11]. An elevated cell polarization-marker expression was also found when comparing epithelial growth on curved versus flat surfaces. Curvature also drives distinct migration behavior [12–15] and can induce cell sheet delamination via large-scale force sensing and transmission [16, 17]. Madin-Darby Canine Kidney (MDCK) epithelial cells have been shown to sense curvature through nuclear shape changes [18], grow to have different cell heights [19], and elongate [20–23] and even migrate [24] differently depending on substrate curvature. Noteworthily, curvature effects on proliferation, the cellular process associated with cell fate and metastatic state in epithelial tissue, has yet to be explored and will be the focus of this study. Previous studies of cells on patterned planar substrates have suggested that in-plane curvature and tension at the cell interface is an important factor regulating proliferation [25]. However, these geometric confinements do not reflect the out-of-plane curvature seen in native tissue architectures; many epithelial structures in biology have, in fact, out-of-plane curvature, including instentinal villi, tubes and ascini [26, 27].
Fabrication of precisely curved and smooth surfaces at the micrometer-to-millimeter scale is challenging. Methods to create curved substrates such as hemispheres, circular channels, and cylinders include micromachining, photolithography, chemical etching, electrospinning, and replica molding of microfabricated or precision-printed 3D structures [6, 28, 29]. Substrate materials range from glass, quartz, synthetic polymers, polydimethylsiloxane elastomers to hydrogels, with the choice of substrate material often depending on the availability of fabrication techniques. Simple geometries based on spheres and cylinders have been the most used. Curvature at any point along surfaces can be characterized by its Gaussian and mean curvatures, which are the product and the mean of the two principal curvatures at that point, respectively. Tortuous organs and vessels can have a range of positive to negative Gaussian curvatures that are not reflected in spheres or in cylindrical geometries. Spheres or spherical caps have constant positive Gaussian curvature and constant mean curvature, and cylinders have zero Gaussian curvature and constant mean curvature. In this work, we use a supported 3D printing technique [30–32] to generate toroidal hydrogels that have varying signs of Gaussian curvature along their surface.
Other challenges for accessing curvature effects on cell behavior stem from the three-dimensional nature of the resultant constructs, which makes imaging and morphological assessment more difficult than in planar surfaces. Various tools and open-source software or add-ons have been developed for 3D/4D data visualization and morphological analysis of developing tissues [33–35]. Here, we built on our previous work to quantify biofilms and active systems on toroidal surfaces [36, 37], incorporating 3D cell segmentation tools [38], to extract quantitative data on the effect of curvature on epithelial proliferation.
In particular, we investigate the effect of Gaussian curvature on epithelial proliferation by growing model MDCK epithelial cells on toroidal-shaped hydrogels with curvatures on the order of ten cell lengths (sub-millimeters). To quantify how curvature affects proliferation, we develop methods to locate cells on surfaces and evaluate the curvature where each cell attaches. We also introduce a robust 3D segmentation scheme and an intensity comparison method for accurate identification of proliferating cells. We find that proliferation, measured by tracking the percentage of proliferating cells within the population, is independent of Gaussian curvature within the range probed in our experiments. Additionally, we find that proliferation is strongly affected by cell density on both toroidal and planar substrates, suggesting the relevance of acquiring time-dependent data when looking at active, dynamic systems like cells. Our work opens the door to additional studies with surfaces with higher curvatures and different cell types that could model a variety of complex real-life systems.
Madin-Darby canine kidney cells strain II (MDCK II) were obtained from Sigma-Aldrich and were maintained in Eagle’s minimal essential media (EMEM; ATCC) supplemented with fetal bovine serum (Life Technologies) at 10% (vol/vol), penicillin (100 IU/ml), and streptomycin (100 μg/ml) under standard tissue culture conditions (humidified 5% CO2 and 37°C). MDCKs were passaged at 70∼80% confluence from the culture surface and reseeded to the required cell density on hydrogel surfaces.
To prepare planar polyacrylamide (PA) hydrogels, solutions containing acrylamide, bis-acrylamide, tetramethylethylenediamine (TEMED), and potassium persulfate were cast into 9 mm-diameter disks using silicone molds (Sigma Press-To-Seal silicone isolator, 2 mm thick) and allowed to polymerize for 15 min at room temperature. The hydrogel disks were then rinsed with and stored in deionized water. To prepare toroidal PA hydrogels, we replace the catalyst TEMED and the persulfate initiator with 0.2% of photoinitiator Irgacure 2959 and added 1% Pluronic F127 to reduce interfacial tension and be able to make small toroidal droplets. Similar to the preparation of toroidal poly-N-isopropylacriamide hydrogels [31], toroidal droplets of the precursor solution were made by injecting the solution via a 34-gauge needle into a rotating bath of silicone-oil-based yield stress material consisting of 84% Dow Corning 9041 silicone elastomer blend and 16% 10cst silicone oil, after which the sample was polymerized with a UV-curing spot lamp (BlueWave 75 with 5 mm-lightguide) at an intensity of 370 mW/cm2 for 10 s. The photopolymerized toroidal PA hydrogels were removed from the yield-stress material and cleaned repeatedly with 0.01% Tween 20 and water for 5 times or until no silicone oil residue remained (Figure 1A). The PA toroidal hydrogels were stored in deionized water at 45°C until use (Figure 1B).
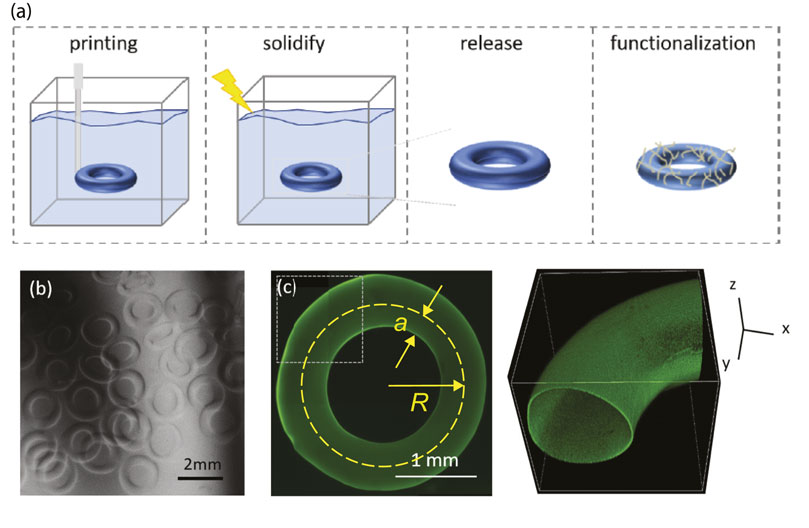
FIGURE 1. (A) Schematic of a hydrogel tori made by printing into a silicone support bath that is subsequently surface-activated via protein grafting. (B) Image of PA toroidal hydrogels in water after being released from the support bath. The dark regions are shadows of objects placed in the light path to enhance contrast of the hydrogel edge viewed with bright field imaging. (C) Confocal images of collagen-coated PA toroidal hydrogels viewed in 2D (left) via maximum intensity projection onto the xy-plane and in 3D (right) for the section of the hydrogel highlighted with a square box in the 2D image. Geometric parameters of a torus: ring radius R and tube radius a.
Before cells were seeded onto the hydrogels, the substrates were UV-sterilized and functionalized with collagen I. We adapted the PA hydrogel functionalization scheme of Yamatoto et al [39]. The basis of the procedure consisted in hydrolysing the PA hydrogels with 0.1 M NaOH for 1.5 h at 45°C. The carbonyl groups generated in this way were then activated at room temperature and pH 7 using 1-ethyl-3-[3-dimethylaminopropyl]carbodiimide hydrochloride (EDC) and N-hydroxysulfosuccinimide (NHS) at 36 mM and 72 mM, respectively, after which the unreacted EDC and NHS were removed through repeated rinsing with phosphate buffer. The activated hydrogels were then submerged in a collagen-I solution containing fluorescein-labeled collagen and unlabeled collagen at 1:6 ratio and a total collagen concentration of 0.2 mg/ml for ∼12 h at 4°C. Excess collagen was rinsed off with phosphate buffer and the gels were stored in phosphate buffer containing 0.01% sodium azide at 4°C until use (Figure 1C). The fluorescein-labeled collagen was synthesized and purified according to the following procedure [40]: 5 ml of rat tail collagen-I was dialyzed against 0.05 M borate buffer containing 0.04 M NaCl at pH 9.5. The solution was then reacted with fluorescein isothiocyanate overnight at 4°C. The excess fluorescein reagent was removed by dialysis, first against borate buffer and then against 0.2% acetic acid solution. The protein concentration of the fluorescein-labeled collagen solution was determined from the absorption intensity at 280 nm using a Nanodrop Spectrophotometer.
For planar substrate experiments, we place each hydrogel disk in 48 well plates and seeded the cells statically at 300 cells/mm2. The seeding density was controlled by adding a known number of cells, as estimated using a hemocytometer, to each well. For toroidal substrate experiments, individual toroidal hydrogels were placed into 2-ml tubes containing either 104 or 4 × 10⁴ cells/mL and incubated for 2 h with periodic mixing by gently inverting the tube three times every 15 min. The cell-coated toroidal gels were then gently rinsed with fresh medium to remove non-adherent cells and transferred into ultra-low attachment plates. Cells were allowed to spread and grow on the substrate at least overnight before they were assayed. Proliferation was assayed using the Click-iT EdU Imaging Kit (Life Technologies) to identify those that are actively proliferating or synthesizing DNA in the population. The procedure consisted in exposing the cells to EdU-containing growth media for 30 min, and then fixing and staining for EdU incorporation according to the manufacturer’s instructions. This was combined with immunostaining: Cells were fixed in 4% formaldehyde, blocked and permeabilized with universal blocking buffer (1% bovine serum albumin, 1% goat serum, 0.1% fish skin gelatin, 0.5% Triton X-100, and 0.05% sodium azide in PBS), and incubated with primary antibody anti-E-cadherin DECMA-1 (Sigma), followed by the secondary antibody goat anti-rat IgG Alexa Fluor 633 (Life Technologies) and nuclei DNA stain (Hoechst 33342). All assayed cells were triple-labeled for E-cadherin, nuclei, and EdU-containing nuclei.
All stained samples were placed in chambered coverglass for imaging. Planar samples were imaged with a 10× objective on a Nikon Ni-U upright microscope equipped with a Ds-Ri2 CMOS camera. 3D images of toroidal samples were taken on a Nikon A1R confocal microscope using a 20× objective with a resolution of 1.24 μm in the xy-plane and 2 μm along the z-axis. Images were acquired using Nikon NIS-Elements software on both systems. Up to four fluorescent channels were used.
All images were processed using custom-written MATLAB codes. Three widefield fluorescent image datasets and five 3D confocal image datasets are used in the analysis. Each dataset consists of a minimum of 24 image stacks from three replicated experiments. Each image stack was analyzed separately and the results were aggregated post-processing.
Multi-channel confocal images of MDCK II cells on collagen-functionalized toroidal hydrogels were separated into individual z-stacks and processed according to the workflow shown in Figure 2: We start by reconstructing the substrate or adherent surface from the FITC-collagen channel. This is accomplished by image binarization and locating the lowest voxel that contains labeled collagen at each xy-position, followed by surface smoothing. We used Otsu’s method to determine the threshold value for binarization, which finds the optimum threshold value that minimizes the total error of fitting two Gaussian distributions, one corresponding to the background and the other to the foreground [41]. We also remove connected objects that have a diameter of 1.2 μm or lower, a cutoff size that efficiently eliminates noise in the data while keeping the large connected volumes that constitute the gel surface. The smoothing algorithm for the interface is based on minimizing the residual sum-of-squares between the input and output interface combined with a penalty function proportional to the resultant curvature [42] (see supplementary information). This method requires an input smoothing parameter s that tunes the strength of the penalty function. The value of the square root of s is an estimate of the size of features in pixels that are smoothed out. Hence, the parameter is chosen to be only a few pixels, large enough to remove the local experimental noise, but small enough to retain the overall curvature of the system. The reconstructed surface is then triangulated (Supplementary Figure S1), and the Gaussian and mean curvatures are measured using local displacement vectors and changes in the surface normal [36].
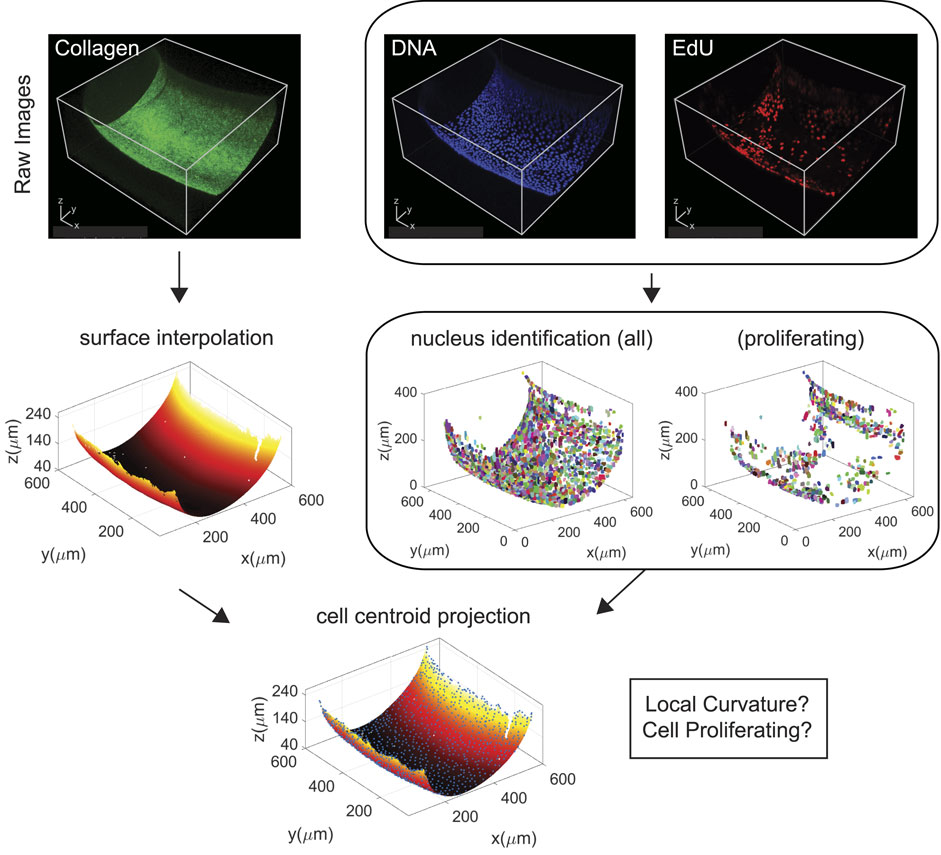
FIGURE 2. Workflow of confocal data processing of MDCK II cells on a toroidal hydrogel section.
Separately, we identify each individual cell nucleus from the nuclei channel. First, the image was binarized using the triangle algorithm for thresholding, where the threshold value is determined by constructing a line between the maximum and minimum non-zero values in the histogram and finding the value with the maximum distance from the constructed line to the histogram distribution [43]. This thresholding strategy was chosen due to the absence of an apparent foreground and background in the intensity histograms and is best represented with a single distribution instead of two (see comparison of histogram distribution for collagen versus nuclei channel in Supplementary Figure S2). Then, a 3D cell segmentation routine that uses the watershed algorithm in the CellSegm toolbox [38] was implemented. Connected volumes smaller than a cutoff size were filtered while those larger than a critical size were passed through the watersheld splitting algorithm (Supplementary Figures S3, S4). An additional filtering step consists in measuring the distance of cell centroids to the reconstructed substrate and removing any cell that is over 20 μm away from the surface, as the height of an adhered epithelial monolayer is within 10 μm from the substrate [44]; doing this removes noise and any volume that is not an adherent cell. We then combined the processed data from the FITC-collagen channel and the nuclei channel, namely the reconstructed substrate and the segmented cell volumes, and projected the centroid of each cell onto the surface by finding the closest point on the collagen surface to each cell (Supplementary Figure S5), which enables the identification of each cell with their corresponding adherent substrate location as well as its curvature. Finally, as the EdU stain co-localize with nuclei DNA stain, we referenced the nuclei channel to determine cell volumes within which intensities in the proliferation channel will be integrated and compared to determine which cells were actively proliferating during the assay (Supplementary Figure S6).
For cells on planar substrates, only two channels were used for data processing, namely the nuclei and proliferation channel. A 2D version of the cell segmentation routine used in confocal data processing is employed to find the individual cell nuclei.
To examine the role of substrate curvature on cell population growth, we culture MDCK II cells on top of bio-adhesive polymer hydrogels that are toroidal-shaped. The surface of the hydrogel is functionalized with a mixture of unlabeled and FITC-labeled collagen. As a control, we also seed cells on top of planar hydrogels with identical composition and surface treatment. This ensures that all hydrogels, despite shape, have identical mechanical properties and present the same protein density for cell attachment. The elastic modulus of the hydrogels is
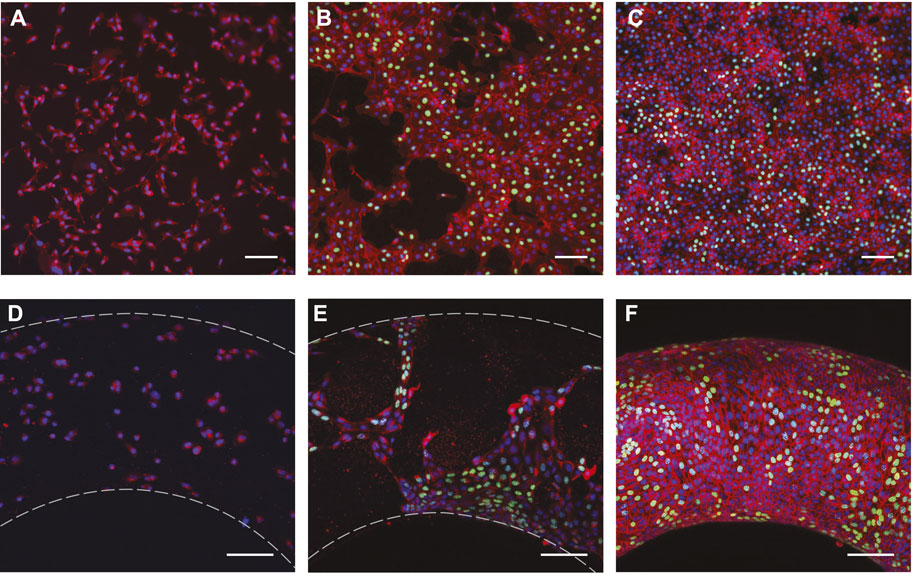
FIGURE 3. Fluorescence microscopy images of MDCK II cells cultured on planar (top row) and toroidal (bottom row) PA hydrogels after (A,D) 2 h (B,E) 26 h, and (C,F) 52 h. Images in the bottom row are maximum intensity projections of confocal stacks. Samples were stained for nuclei (DNA) and E-cadherin, which are false-colored in blue and red, respectively. Newly synthesized DNA was labeled by EdU for the 26 and 52 h samples, shown in green. Scale bars: 100 μm.
To quantify any spatial variation in proliferation, three-dimensional data containing substrate surface, nuclei of all and proliferating (false-labeled green in Figures 3B,C,E,F) MDCK cells on toroidal gels was collected and analyzed. Multiple image stacks were taken of a single toroid to cover as much of the toroidal surface as possible and three independent toroid were imaged at each condition. Note that only the lower half of the toroid was imaged as the loss in intensity becomes significant as light passes through two layers of dense tissue. Each image stack was then processed as follows:
To the confocal images from the collagen channel, we apply an intensity threshold using Otsu’s method as described in the methods section for each slice (each z-position) of the image. The threshold is scaled by the mean intensity of each slice, thus ensuring that light attenuation as we move deeper into the sample is accounted for. We then locate the surface by finding the lowest point with labeled collagen, and apply a smoothing parameter that is a few microns to eliminate voxel-level noise and artificial roughness from data extraction (Figures 4A,B). To measure the Gaussian curvature K and the mean curvature H, we follow the methods by Ellis et al. [36], fitting the triangulated surface to the Weingarten curvature matrix, and calculate K and H at each (x,y) point on the surface (Figures 4C,D). The range of Gaussian and mean curvatures sampled in the toroidal section is in the range (−6, 6) mm−2 and (−4, −1) mm−1, respectively. Note H < 0, as we choose the normal of a curve in an elliptic region of the surface to have negative normal curvature. As expected, the value of K becomes negative towards the inside of the torus, where |H| also becomes smaller. The Gaussian and mean curvature of a torus, a surface obtained by revolving a circle of radius a, about a central axis, vary along the surface and are solely functions of the tube radius a, the ring radius R, and the polar angle in the circular cross section. The structures here, however, are not that of a torus but a toroid. This is better observed by representing each surface point with Gaussian and mean curvature, where we capture the deviation of the surface from that of a torus. The H versus K curve of our hydrogel section (Figure 4D) is only loosely linearly related and does not fit well with the known relationship between the two curvatures:
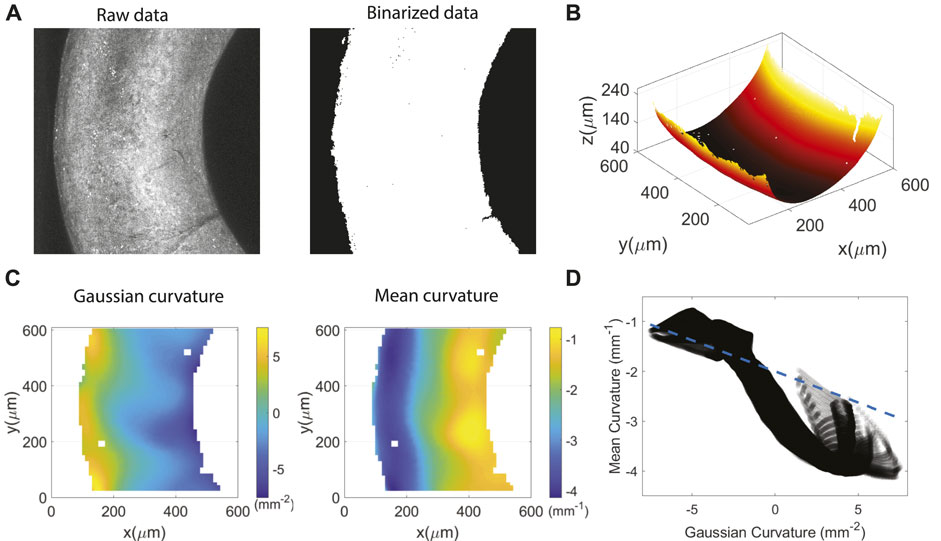
FIGURE 4. Image processing with collagen channel. The dimensions of the toroidal gels are a ≈ 0.2 mm and R ≈ 0.7 mm (aspect ratio ζ = R/a = 3.5) as measured by fitting circles to bright field images of multiple tori. (A) Maximum intensity projection of the raw data and the binarized data after thresholding. (B) 3D view of the interpolated and smoothed surface from locating the lowest point of each xy-postion through the entire image stack. (C) Gaussian and mean curvatures of the surface. (D) Gaussian versus mean curvature of every point on the surface. The dashed line represents the theoretical relationship between H and K for a torus with a tube radius of 250 μm and a ring radius of 800 μm.
For stained nuclei (DNA), we implement the triangle algorithm for thresholding (Supplementary Figure S2). To identify solid objects, i.e., cell nuclei, in our images, we find connected (voxel) elements that are above a certain size to be potential cell nuclei volumes (Figures 5A,B). We then apply the 3D watersheld algorithm to segment cell volumes that do not have distinct boundaries between neighboring cells. Cell volume histogram before and after segmentation show that connected volumes of multiple cells are successfully split into smaller individual volumes, corresponding to single cell nuclei (Figures 5C,D). The last filtering step is based on cell centroid-to-surface distance, where any segmented volume whose centroid distance from the surface is larger than one typical cell size is removed (Figures 5E,F). This removes any remaining noise or cell volumes that are not attached to the gel surface.
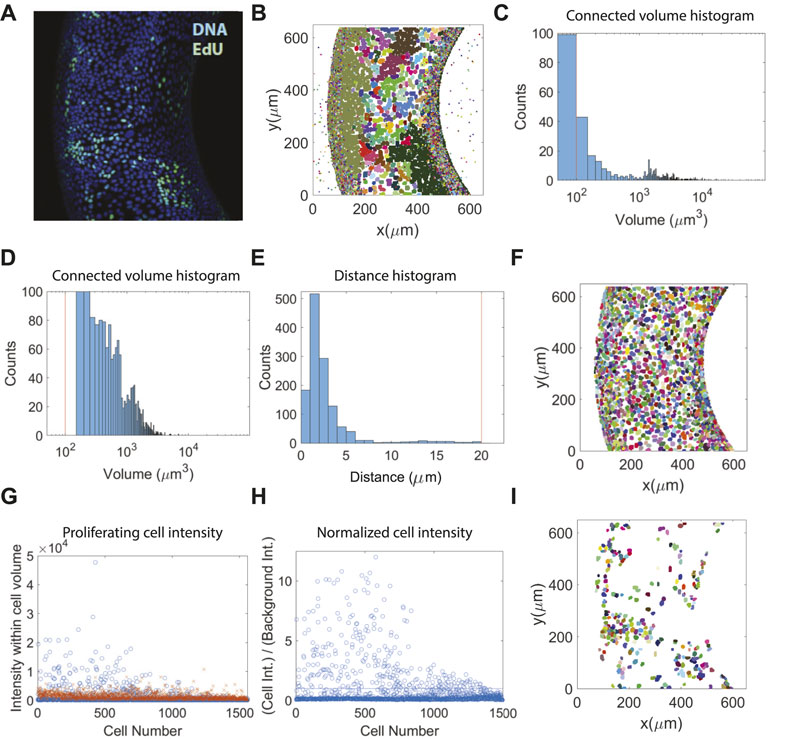
FIGURE 5. Proliferation and nuclei data segmentation results. (A) Merged maximum intensity projection from the whole nuclei staining (DNA) and proliferation channel (EdU). (B) xy-projected view of processed nuclei data showing connected volume elements. (C,D) Cell volume histogram before (C) and after (D) segmentation. (E) Histogram of cell centroid-to-surface distance. The vertical line at 20 μm is the cut-off distance. (F) xy-projected view of processed nuclei data after segmentation. (G) Sum of voxel intensities in every cell volume of all cells as detected in the proliferation (EdU) channel. The crosses represent the corresponding background intensity, as defined in the text. (H) Normalized cell intensity over background intensity for all cell volumes. The horizontal line marks the intensity cutoff for proliferating cells. (I) xy-projected view of proliferating cells using the Icell/Ib = 1 cutoff criteria.
To distinguish proliferating from non-proliferating cells, we compare the average intensity within the cell volume to that of the background in the EdU channel. Since most of the voxels in the EdU image stack contains no cells, the background intensity Ib is defined as the average intensity of all voxels
Combining the interpolated surface and segmented nuclei data allow us to re-parametrize each cell in terms of the local curvature of the substrate. The centroid of each cell, obtained from the 3D cell segmentation procedure is projected onto the collagen surface, as shown in Figure 6A. This is done by finding the point on the surface with the shortest distance to the cell centroid. Since curvatures K and H are calculated at each point on the surface (Figures 4C,D), we can map the xyz-coordinate of each projected cell centroid onto the curvature plane. Note that all points on the surface have a unique (x,y) coordinate because we only image the bottom half of the toroid. With this, each proliferating and non-proliferating cell can be identified by its local Gaussian and mean curvatures on the substrate, as shown by the discrete points in Figures 6B,C.
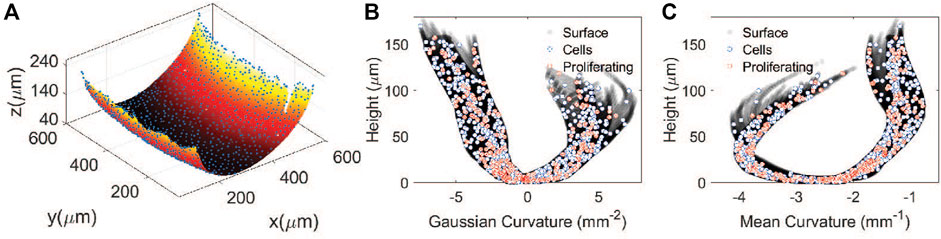
FIGURE 6. Identification of cells with substrate curvature. (A) Projection of cell centroids onto the recontructed hydrogel surface. (B) Gaussian curvature versus height for each cell. (C) Mean curvature versus height for each cell. The filled circles are points on the surface. The open circles represent all the cells and the crosses are proliferating cells.
To determine whether there are correlations between proliferation and local substrate curvature, we aggregate processed data from multiple image stacks and from at least three replicas with identical conditions, namely seeding density and incubation time, and bin the results by Gaussian curvature. Figures 7A,B show the number of all cells Nall and proliferating cells Np in 0.25 mm2 Gaussian curvature bins for four different conditions: starting cell concentrations of 4 × 10⁴ cell/mL, incubated for 26 and 52 h, and of 104 cell/mL, incubated for 72 and 112 h. The fraction of cycling cells during the 30-min proliferation assay is determined by dividing the number of proliferation cells by all cells Np/Nall in each bin. We find that the proliferation fraction is independent of Gaussian curvatures in the (−10,10) mm−2 range of our studies, which include cultures on both toroidal and flat surfaces (Figure 7C). Proliferation fractions outside of this range (K < − 10 and K > 10 mm−2) appear larger, but the data is noisy and not so reliable due to the smaller number of cells counted. Instead, the proliferation fraction depends more strongly on the incubation time and the seeding density of the MDCK II cells. Increasing incubation time for cells on flat substrates and toroidal substrates all show reduction in the proliferation fraction Np/Nall: Proliferation fraction decreased from ∼50% to ∼25% when the incubation time increased from 26 h to 52 h for cells grown on flat substrates with a seeding area density of ∼300/mm2 and on toroidal gel substrates when seeded at 40K/ml. Similar values were also observed for cells grown on toroidal gels seeded at 10K/ml, but at longer incubation times, namely 72 h and 112 h. This can be explained by considering the time required to reach similar cell densities or cell area for a lower seeding concentration. The decrease in proliferation fraction with increasing incubation time or cell packing density (Table 1), on the other hand, is consistent with collective behavior and contact inhibition of proliferation of epithelial cells, where a progressive decrease in proliferation is observed until mitotic arrest is achieved [45, 46].
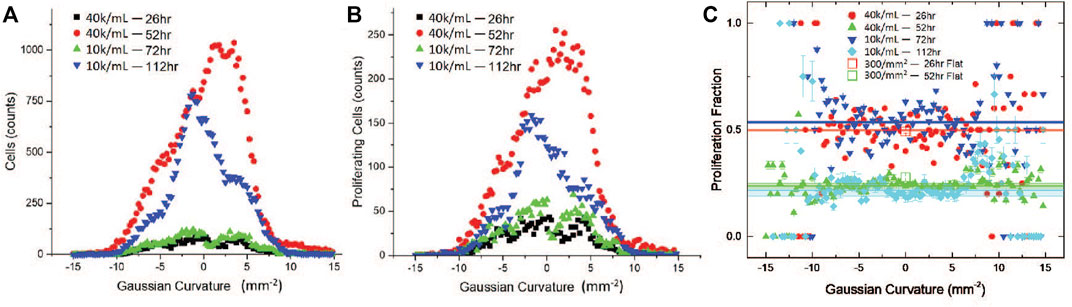
FIGURE 7. Proliferation as a function of curvature. (A) Number of cells as a function of Gaussian curvature on toroidal gels. (B) Number of proliferating cells as a function of Gaussian curvature on toroidal gels. (C) Proliferation fraction as a function of Gaussian curvature on toroidal and planar gel surfaces. Solid symbols are toroidal gel data and open symbols are planar gel data. The horizontal lines are averages over all Gaussian curvature ranges for toroidal data, with standard errors estimated from the background ± 10%.
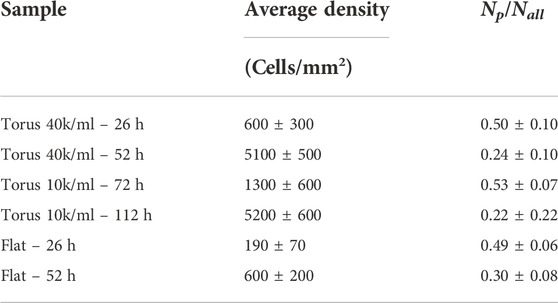
TABLE 1. Average cell density and proliferation fraction.
We have introduced a 3D printing-based fabrication technique to generate “living” toroidal constructs and detailed a method of analysis for quantifying proliferation of epithelial cells on toroidal surfaces. We have shown that reconstructing 3D surfaces and mapping cell positions onto curved substrates can help determine whether curvature plays a role in epithelial proliferation. We found that, within the curvature range of our experiments, carried out on toroidal surfaces of dimensions a ≈ 0.2 mm and R ≈ 0.7 mm, proliferation is independent of Gaussian curvature. We also found that proliferation is influenced by the overall cell density regardless of the substrate geometry or seeding density. The results here suggest that curvature at this length scale has no overriding effect on the rate of proliferation for epithelial cells. However, additional work on substrates with higher curvatures, preferably up to one or a couple inverse cell sizes, is desirable to further address whether curvature can be used to affect cell proliferation. In fact, there is recent work reporting that the rate for MDCK cells to achieve confluency changes for curvatures on the order of the inverse cell size [47].
The raw data supporting the conclusions of this article will be made available by the authors upon reasonable request.
All authors listed have made a substantial, direct, and intellectual contribution to the work and approved it for publication.
We thank support from MCIN/AEI/10.13039/501100011033/FEDER, UE (Grant No. PID2021-122369NB-100).
The authors declare that the research was conducted in the absence of any commercial or financial relationships that could be construed as a potential conflict of interest.
All claims expressed in this article are solely those of the authors and do not necessarily represent those of their affiliated organizations, or those of the publisher, the editors and the reviewers. Any product that may be evaluated in this article, or claim that may be made by its manufacturer, is not guaranteed or endorsed by the publisher.
The Supplementary Material for this article can be found online at: https://www.frontiersin.org/articles/10.3389/fphy.2022.1055393/full#supplementary-material
1. Watt FM, Huck WTS. Role of the extracellular matrix in regulating stem cell fate. Nat Rev Mol Cel Biol (2013) 14:467–73. doi:10.1038/nrm3620
2. Lo CM, Wang HB, Dembo M, Wang YL. Cell movement is guided by the rigidity of the substrate. Biophysical J (2000) 79:144–52. doi:10.1016/s0006-3495(00)76279-5
3. Engler AJ, Sen S, Sweeney HL, Discher DE. Matrix elasticity directs stem cell lineage specification. Cell (2006) 126:677–89. doi:10.1016/j.cell.2006.06.044
4. Haga H, Irahara C, Kobayashi R, Nakagaki T, Kawabata K. Collective movement of epithelial cells on a collagen gel substrate. Biophysical J (2005) 88:2250–6. doi:10.1529/biophysj.104.047654
5. Baptista D, Teixeira L, van Blitterswijk C, Giselbrecht S, Truckenmüller R. Overlooked? Underestimated? Effects of substrate curvature on cell behavior. Trends Biotechnol (2019) 37:838–54. doi:10.1016/j.tibtech.2019.01.006
6. Callens SJP, Uyttendaele RJC, Fratila-Apachitei LE, Zadpoor AA. Substrate curvature as a cue to guide spatiotemporal cell and tissue organization. Biomaterials (2020) 232:119739. doi:10.1016/j.biomaterials.2019.119739
7. Lanfer B, Hermann A, Kirsch M, Freudenberg U, Reuner U, Werner C, et al. Directed growth of adult human white matter stem cell–derived neurons on aligned fibrillar collagen. Tissue Eng A (2010) 16:1103–13. doi:10.1089/ten.tea.2009.0282
8. Rovensky Y, Samoilov V. Morphogenetic response of cultured normal and transformed fibroblasts, and epitheliocytes, to a cylindrical substratum surface. Possible role for the actin filament bundle pattern. J Cel Sci (1994) 107:1255–63. doi:10.1242/jcs.107.5.1255
9. Flemming RG, Murphy CJ, Abrams GA, Goodman SL, Nealey PF. Effects of synthetic micro- and nano-structured surfaces on cell behavior. Biomaterials (1999) 20:573–88. doi:10.1016/s0142-9612(98)00209-9
10. Bade ND, Kamien RD, Assoian RK, Stebe KJ. Curvature and Rho activation differentially control the alignment of cells and stress fibers. Sci Adv (2017) 3:e1700150. doi:10.1126/sciadv.1700150
11. Yu SM, Oh JM, Lee J, Lee-Kwon W, Jung W, Amblard F, et al. Substrate curvature affects the shape, orientation, and polarization of renal epithelial cells. Acta Biomater (2018) 77:311–21. doi:10.1016/j.actbio.2018.07.019
12. Pieuchot L, Marteau J, Guignandon A, Dos Santos T, Brigaud I, Chauvy PF, et al. Curvotaxis directs cell migration through cell-scale curvature landscapes. Nat Commun (2018) 9:3995. doi:10.1038/s41467-018-06494-6
13. Yevick HG, Duclos G, Bonnet I, Silberzan P. Architecture and migration of an epithelium on a cylindrical wire. Proc Natl Acad Sci U S A (2015) 112:5944–9. doi:10.1073/pnas.1418857112
14. Bade ND, Xu T, Kamien RD, Assoian RK, Stebe KJ. Gaussian curvature directs stress fiber orientation and cell migration. Biophysical J (2018) 114:1467–76. doi:10.1016/j.bpj.2018.01.039
15. Xi W, Sonam S, Beng Saw T, Ladoux B, Teck Lim C. Emergent patterns of collective cell migration under tubular confinement. Nat Commun (2017) 8:1517. doi:10.1038/s41467-017-01390-x
16. Broaders KE, Cerchiari AE, Gartner ZJ. Coupling between apical tension and basal adhesion allow epithelia to collectively sense and respond to substrate topography over long distances. Integr Biol (2015) 7:1611–21. doi:10.1039/C5IB00240K
17. Yamashita T, Kollmannsberger P, Mawatari K, Kitamori T, Vogel V. Cell sheet mechanics: How geometrical constraints induce the detachment of cell sheets from concave surfaces. Acta Biomater (2016) 45:85–97. doi:10.1016/j.actbio.2016.08.044
18. Assoian RK, Bade ND, Cameron CV, Stebe K. Cellular sensing of micron-scale curvature: A frontier in understanding the microenvironment. Open Biol (2019) 9:190155. doi:10.1098/rsob.190155
19. Luciano M, Xue SL, De Vos WH, Redondo-Morata L, Surin M, Lafont F, et al. Cell monolayers sense curvature by exploiting active mechanics and nuclear mechanoadaptation. Nat Phys (2021) 17:1382–90. doi:10.1038/s41567-021-01374-1
20. Harmand N, Huang A, Henon S. 3D shape of epithelial cells on curved substrates. Phys Rev X (2021) 11:031028. doi:10.1103/physrevx.11.031028
21. Yu SM, Li B, Amblard F, Granick S, Cho YK. Adaptive architecture and mechanoresponse of epithelial cells on a torus. Biomaterials (2021) 265:120420. doi:10.1016/j.biomaterials.2020.120420
22. Rougerie P, Pieuchot L, Silva dos Santos R, Marteau J, Bigerelle M, Chauvy P, et al. Topographical curvature is sufficient to control epithelium elongation. Sci Rep (2020) 10:14784. doi:10.1038/s41598-020-70907-0
23. Yip AK, Huang P, Chiam KH. Cell-cell adhesion and cortical actin bending govern cell elongation on negatively curved substrates. Biophysical J (2018) 114:1707–17. doi:10.1016/j.bpj.2018.02.027
24. Werner M, Petersen A, Kurniawan NA, Bouten CVC. Cell-perceived substrate curvature dynamically coordinates the direction, speed, and persistence of stromal cell migration. Adv Biosyst (2019) 3:1900080. doi:10.1002/adbi.201900080
25. Nelson CM, Jean RP, Tan JL, Liu WF, Sniadecki NJ, Spector AA, et al. Emergent patterns of growth controlled by multicellular form and mechanics. Proc Natl Acad Sci U S A (2005) 102:11594–9. doi:10.1073/pnas.0502575102
26. Maechler FA, Allier C, Roux A, Tomba C. Curvature dependent constraints drive remodeling of epithelia. J Cel Sci (2019) 132:jcs222372. doi:10.1242/jcs.222372
27. Schock F, Perrimon N. Molecular mechanisms of epithelial morphogenesis. Annu Rev Cel Dev Biol (2002) 18:463–93. doi:10.1146/annurev.cellbio.18.022602.131838
28. Liu T, Chien CC, Parkinson L, Thierry B. Advanced micromachining of concave microwells for long term on-chip culture of multicellular tumor spheroids. ACS Appl Mater Inter (2014) 6:8090–7. doi:10.1021/am500367h
29. Bidan CM, Kommareddy KP, Rumpler M, Kollmannsberger P, Fratzl P, Dunlop JWC. Geometry as a factor for tissue growth: Towards shape optimization of tissue engineering scaffolds. Adv Healthc Mater (2013) 2:186–94. doi:10.1002/adhm.201200159
30. Pairam E, Le H, Fernández-Nieves A. Stability of toroidal droplets inside yield stress materials. Phys Rev E (2014) 90:021002. doi:10.1103/PhysRevE.90.021002
31. Chang YW, Dimitriyev MS, Souslov A, Nikolov SV, Marquez SM, Alexeev A, et al. Extreme thermodynamics with polymer gel tori: Harnessing thermodynamic instabilities to induce large-scale deformations. Phys Rev E (2018) 98:020501. doi:10.1103/PhysRevE.98.020501
32. Bhattacharjee T, Zehnder SM, Rowe KG, Jain S, Nixon RM, Sawyer WG, et al. Writing in the granular gel medium. Sci Adv (2015) 1:e1500655. doi:10.1126/sciadv.1500655
33. Barbier de Reuille P, Routier-Kierzkowska AL, Kierzkowski D, Bassel GW, Schüpbach T, Tauriello G, et al. MorphoGraphX: A platform for quantifying morphogenesis in 4D. eLife (2015) 4:e05864. doi:10.7554/eLife.05864
34. Heller D, Hoppe A, Restrepo S, Gatti L, Tournier AL, Tapon N, et al. EpiTools: An open-source image analysis toolkit for quantifying epithelial growth dynamics. Dev Cel (2016) 36:103–16. doi:10.1016/j.devcel.2015.12.012
35. Royer LA, Weigert M, Günther U, Maghelli N, Jug F, Sbalzarini IF, et al. ClearVolume: Open-source live 3D visualization for light-sheet microscopy. Nat Methods (2015) 12:480–1. doi:10.1038/nmeth.3372
36. Ellis PW, Pearce DJG, Chang YW, Goldsztein G, Giomi L, Fernandez-Nieves A. Curvature-induced defect unbinding and dynamics in active nematic toroids. Nat Phys (2017) 14:85–90. doi:10.1038/nphys4276
37. Chang YW, Fragkopoulos AA, Marquez SM, Kim HD, Angelini TE, Fernandez-Nieves A. Biofilm formation in geometries with different surface curvature and oxygen availability. New J Phys (2015) 17:033017. doi:10.1088/1367-2630/17/3/033017
38. Hodneland E, Kögel T, Frei DM, Gerdes HH, Lundervold A. CellSegm - a MATLAB toolbox for high-throughput 3D cell segmentation. Source Code Biol Med (2013) 8:16. doi:10.1186/1751-0473-8-16
39. Yamamoto M, Yanase K, Tabata Y. Generation of type I collagen gradient in polyacrylamide hydrogels by a simple diffusion-controlled hydrolysis of amide groups. Materials (2010) 3:2393–404. doi:10.3390/ma3042393
40. Baici A, Cohen G, Fehr K, Böni A. A handy assay for collagenase using reconstituted fluorescein-labeled collagen fibrils. Anal Biochem (1980) 108:230–2. doi:10.1016/0003-2697(80)90574-6
41. Otsu N. A threshold selection method from gray-level histograms. IEEE Trans Syst Man Cybern (1979) 9:62–6. doi:10.1109/tsmc.1979.4310076
42. Garcia D. Robust smoothing of gridded data in one and higher dimensions with missing values. Comput Stat Data Anal (2010) 54:1167–78. doi:10.1016/j.csda.2009.09.020
43. Zack GW, Rogers WE, Latt SA. Automatic measurement of sister chromatid exchange frequency. J Histochem Cytochem (1977) 25:741–53. doi:10.1177/25.7.70454
44. Zehnder S, Suaris M, Bellaire M, Angelini T. Cell volume fluctuations in MDCK monolayers. Biophysical J (2015) 108:247–50. doi:10.1016/j.bpj.2014.11.1856
45. Puliafito A, Hufnagel L, Neveu P, Streichan S, Sigal A, Fygenson DK, et al. Collective and single cell behavior in epithelial contact inhibition. Proc Natl Acad Sci U S A (2012) 109:739–44. doi:10.1073/pnas.1007809109
46. Venugopal B, Mogha P, Dhawan J, Majumder A. Cell density overrides the effect of substrate stiffness on human mesenchymal stem cells’ morphology and proliferation. Biomater Sci (2018) 6:1109–19. doi:10.1039/C7BM00853H
Keywords: curved (hyper-) surfaces, toroid, polymer gels, MDCK cells, cell proliferation, confocal microscopy
Citation: Chang Y-W, Cruz-Acuña R, Tennenbaum M, Fragkopoulos AA, García AJ and Fernández-Nieves A (2022) Quantifying epithelial cell proliferation on curved surfaces. Front. Phys. 10:1055393. doi: 10.3389/fphy.2022.1055393
Received: 27 September 2022; Accepted: 14 November 2022;
Published: 29 November 2022.
Edited by:
Ryan McGorty, University of San Diego, United StatesReviewed by:
Francisco Alarcón, University of Guanajuato, MexicoCopyright © 2022 Chang, Cruz-Acuña, Tennenbaum, Fragkopoulos, García and Fernández-Nieves. This is an open-access article distributed under the terms of the Creative Commons Attribution License (CC BY). The use, distribution or reproduction in other forums is permitted, provided the original author(s) and the copyright owner(s) are credited and that the original publication in this journal is cited, in accordance with accepted academic practice. No use, distribution or reproduction is permitted which does not comply with these terms.
*Correspondence: Alberto Fernández-Nieves, YS5mZXJuYW5kZXpuaWV2ZXNAdWIuZWR1
Disclaimer: All claims expressed in this article are solely those of the authors and do not necessarily represent those of their affiliated organizations, or those of the publisher, the editors and the reviewers. Any product that may be evaluated in this article or claim that may be made by its manufacturer is not guaranteed or endorsed by the publisher.
Research integrity at Frontiers
Learn more about the work of our research integrity team to safeguard the quality of each article we publish.