 Xiaohua Che
 Zhaoshuo Tian
95% of researchers rate our articles as excellent or good
Learn more about the work of our research integrity team to safeguard the quality of each article we publish.
Find out more
ORIGINAL RESEARCH article
Front. Phys. , 02 November 2022
Sec. Optics and Photonics
Volume 10 - 2022 | https://doi.org/10.3389/fphy.2022.1055049
This article is part of the Research Topic State-of-the-Art Laser Spectroscopy and its Applications : Volume II View all 51 articles
In this invited paper, a novel water chemical oxygen demand (COD) detection method based on laser spectroscopy is proposed, and the COD value is obtained according to the intensity ratio of laser Fluorescence-Raman signal produced by laser incident into water. Based on the laser Fluorescence-Raman ratio (LFRR) method, we design a portable water quality measurement system. In which, a 405 nm semiconductor laser is used as the light source. The laser is coupled into the delivering port of Y-type fiber and then transmitted into water. The generated Mie scattered light, water Raman light and corresponding fluorescence are received and transmitted into spectrometer through the detecting port of Y-type fiber, and the COD value can be obtained by analyzing the LFRR of water spectra. The mixed solution of sodium humate and glucose is used as the COD standard solution to calibrate the designed system. The experiment results show that the optimal volume ratio of the two solutions is 1:29. When the COD of standard solutions is in the 1–12 mg/L concentration range, a good linear relationship can be found between the COD value and LFRR value with a correlation coefficient of 0.974. In addition, the COD of natural water samples are measured with LFRR method, the results of which are consistent with COD values obtained by rapid digestion spectrophotometry. Meanwhile, experimental results prove that the COD detection method proposed in this paper has the advantages of high sensitivity, high precision, high detection speed and simplicity, which can be widely used in various water areas for real-time COD monitoring.
Water quality analysis is an important task of environmental monitoring. The chemical oxygen demand (COD) describes the concentration of reducing substances in water, which is an important parameter for evaluating the organic pollution and quality of water [1–3]. Generally, there are two methods for measuring the COD: chemical method and optical method. Currently, the method commonly used for determining COD is chemical method, which requires a long measurement period and a lot of chemical reagents that may lead to secondary pollution if the reagents are not handled properly [4]. Meanwhile, the chemical method cannot be used for real-time analysis of water quality. Compared to chemical method, optical method based on the material characteristic spectrum has been drew much attention in recent years for its rapid detection and pollution-free characteristics [4–10].
At present, the optical method mainly includes absorbance spectrophotometry, hyperspectral analysis [1, 2] and fluorescence spectroscopy. The absorbance spectrophotometry can be further divided into single-wavelength measurement method, double-wavelength measurement method, multi-wavelength measurement method and broad-spectrum measurement method. The essence of absorbance spectrophotometry is to measure the absorption of the organic matters at a certain wavelength to calculate the COD value of water, which is a common method for online COD measurement. However, this method has relatively poor sensitivity and may cause larger measurement errors when COD is lower than 20 mg/L [12]. The hyperspectral analysis method has the advantages of high spatial resolution, high spectral resolution and spectrum integration. However, the technical operation of this method is complicated and high cost [12]. The sensitivity of fluorescence measurement is typically 10–1,000 times that of absorbance spectrophotometry, and has received much attention in the field of water quality monitoring [14, 16]. Recently, some scientists have applied three-dimensional fluorescence spectrometry to water quality measurement [17–32]. In 2004, S. Lee used the fluorescence excitation-emission matrices (FEEM) to analyze various water quality parameters of domestic wastewater, and the results showed that there is a good linear relationship (r2 = 0.914) between measured COD values by wet chemical method and that of FEEM [12]. In 2010, Hur used synchronous fluorescence spectra and its first derivatives to analyze the BOD and COD of wastewater samples collected in sewer systems in urban and non-urban areas, and the good correlation coefficients of 0.92 and 0.94 for BOD and COD can be obtained, respectively [18]. In 2011, Liu analyzed the absorption and fluorescence properties in a large subtropical reservoir and then used a chromophoric dissolved organic matter (CDOM) fluorescence monitoring sensor to predict several water quality parameters including the COD, dissolved organic nitrogen (DON), dissolved organic phosphorus (DOP) and dissolved organic matter (DOM). The significant correlations were found between the CDOM concentration and total nitrogen (TN), total phosphorus (TP), COD, dissolved organic carbon (DOC), and the maximum fluorescence intensity of humic-like component (C1), suggesting that the real-time monitoring of CDOM concentrations could be used to predict these water quality parameters [33]. In 2019, Goffin presented a method for measuring the soluble COD in raw sewage by means of three-dimensional fluorescence spectroscopy, and the results showed that the approach can be served as a guideline for purposes of implementing online wastewater monitoring and conducting environmentally friendly soluble COD measurements in the laboratory [20].
Generally, the advantages of three-dimensional fluorescence spectroscopy are mass spectral measurement data and high sensitivity but with the disadvantages of slow detection speed and complex operation, thus it is not suitable for on-line water quality analysis. Compared to three-dimensional fluorescence spectroscopy, two-dimensional fluorescence spectroscopy uses a single-wavelength laser or LED as the excitation light source, which simplifies the experimental design, and has a high analysis speed in water quality measurement since that only two-dimensional spectral data need to be analyzed. Therefore, many scholars begin to apply the two-dimensional fluorescence spectroscopy in water quality measurement. In 2015, Bridgeman designed a novel LED-based fluorescence instrument for the rapid assessment of potable water quality, and the results demonstrated that this device can provide an accurate in situ in real time assessment of water quality [34]. In 2022, Zheng proposed a water quality COD analysis method based on laser-induced fluorescence spectra, and used a single-wavelength semiconductor laser (wavelength of 405 nm) as the excitation light source and collected the emitted fluorescence spectra through a portable fiber optic spectrometer. PCA and PLS algorithms were used for data dimensionality reduction and model building, respectively. The results indicated that the COD prediction errors of this model for the test set are less than 20% [35].
At present, although two-dimensional fluorescence spectroscopy can measure COD parameter through the analysis of fluorescence intensity, the practical measurement accuracy is often influenced by some factors such as the interference of environmental light, water fluctuation, instrument vibration and laser-aging using [34–36]. In this paper, the development of a portable, laser spectroscopy-based system, capable of the real-time detection of COD parameter in water is described. The system adopts Y-type fiber as the transmission medium of optical signal, and uses the LFRR to calculate the COD value, which can reduce the influence caused by various factors to some extent. In experiment, we adopt the mixed solution of sodium humate and glucose as the COD standard solution of spectral method, and obtain the optimal mixing ratio of the two solutions through the detection and analysis of spectrum at different standard solution concentrations. In addition, the spectra of COD standard solutions within a certain range are detected, and significant positive correlation is found between COD value of standard solutions and LFRR.
A typical spectrum produced by a laser incident on water is shown in Figure 1, it can be seen that the whole spectra consists of [33] Rayleigh-scattered and Mie-scattered laser signal IS generated by elastic scattering, water Raman signal IR generated by inelastic scattering of the excitation light and DOM (dissolved organic matters) fluorescence signal IF. In general, there are three significant water Raman peaks [37] with wavenumbers of 1,595 cm−1, 3,120 cm−1 and 3,400 cm−1 when the water molecule is excited, and the 3400cm−1 can be excited to generate the strongest water Raman signal IR since it has the highest Raman gain coefficient. When the laser incident into the water, the higher the concentration of organic matter in the water, the stronger the fluorescence signal is generated, thus it can be considered that the COD value is proportional to fluorescence intensity:
where the coefficient K and the limit of detection C are constant, which can be determined in experiment.
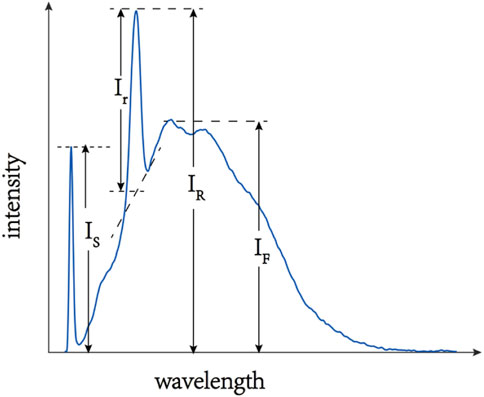
FIGURE 1. A typical spectrum produced by laser exciting water (IS is Rayleigh-scattered and Mie-scattered laser signal generated by elastic scattering, Ir is the intensity of water Raman signal by deducting the fluorescence background, IR is water Raman signal generated by inelastic scattering, IF is DOM fluorescence signal.
For the same water sample, the laser intensity fluctuations and environmental changes both have a major influence on the received fluorescence signal, which lead to instability of the measured COD value in practical application. To solve this problem, we measure the COD parameter of water quality using the LFRR method. In addition, since the spectral range of the fluorescence generated by organic matter is relatively large, the integrated-fluorescence-intensity IT is adopted to calculate the COD value to obtain the fluorescence features of organic matters.
where λ1 is the integrated starting wavelength, λ2 is the integrated ending wavelength,
A schematic view of the experimental setup is shown in Figure 2, which is primarily composed of four parts: laser spectrum detection system, optical fiber transmission system, signal processing system and sample system. The laser spectrum detection system consists of laser emission unit, spectrum detection unit, and data acquisition unit. The laser emission unit is composed of a 405 nm semiconductor laser. The laser spectrum detection system includes a filter, optical splitting system, coupling lens, and CCD [38]. The spectrometer used in the experiment can measure light with wavelengths between 400 and 760 nm with a resolution of 2 nm. The fiber transmission system is a “8 + 1” Y-type fiber of 80 cm, which contains delivering port, receiving port, and detecting port. A semiconductor laser is coupled into the delivering port of a 400 µm-diameter single-core fiber. The receiving port is eight fibers bundle group with diameter of 200 µm which is connected to spectrometer. A computer is employed as signal processing system to control both laser emission and spectra reception, furthermore, it can process spectral data as well as calculate water quality parameters. The sample system consists of test tube, and water sample.
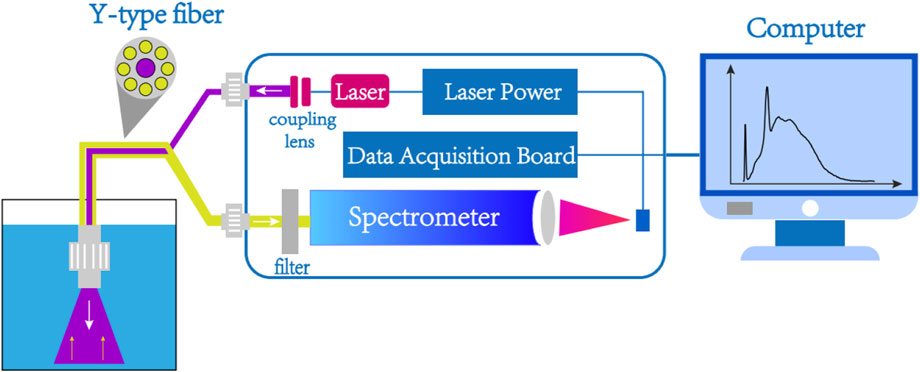
FIGURE 2. Experimental setup of the COD measurement.
During the measurement period, output laser at 405 nm is firstly directed into the detecting port of Y-type fiber through the delivering port and then immersed into water sample vertically. Subsequently, optical signal excited by the laser is transmitted into receiving port of Y-type fiber through eight-core fiber of detecting port, and then input into the optical splitting system through the long-pass filter. Eventually, the optical signal is converted into electrical signal through CCD and then sent to a computer via a USB port. The computer is used to process data and calculate the COD with the corresponding software. In addition, the computer can adjust the exposure time of the CCD according to the intensity of the spectrum signal, and collect the spectrum of the water sample by controlling the power of the laser to turn on and off, so that the interference of the background light can be eliminated dynamically.
The standard solution plays an important role in the calibration, adjustment and maintenance of instrument. Currently, potassium biphthalate and glucose are the commonly standard solutions used for potassium permanganate oxidation (CODMn) and potassium dichromate oxidation (CODCr), respectively. In addition, absorbance spectrophotometry usually uses potassium biphthalate standard solution to calibrate the instrument when measuring water quality COD. Therefore, it is also necessary to select a suitable standard solution to accurately calibrate the experimental setup of COD measurement in “Experimental setup”.
The organism in natural water is mainly composed of humic-like (estimated >50%) [39], protein-like, polysaccharide-like and polypeptide-like. For humic-like, it is vulnerable to generate the significant fluorescence when excited by UV laser, thus sodium humate can be employed as a substitute for humic-like in formulation of COD standard solution of laser spectroscopy. Since the fluorescence intensity in sodium humate solution is higher than that of natural water with same COD value, the mixed solution of no-fluorescence glucose solution and sodium humate solution is prepared as the COD standard solution. In the process, the ratio of sodium humate to glucose Rsg = Vsh/Vg is adjusted to make the fluorescence intensity of the standard solution close to the natural water sample, where Vsh is the volume of sodium humate solution, Vg is the volume of glucose solution.
It is considered that the standard solution reaches the optimum ratio when standard solution and natural water have the same COD value detected by rapid digestion spectrophotometry and integrated-fluorescence-intensity calculated by spectra. In order to determine the optimum Rsg, the corresponding steps are as follows: firstly, we adopt the rapid digestion spectrophotometry to measure the COD value of natural water samples collected from Riyue lake in Harbin Institute of Technology (Weihai). Secondly, under the same identical COD as natural water, we formulate the standard solutions with different Rsg. Finally, the optimum Rsg can be obtained when the spectral integrated-fluorescence-intensity of natural water is same as that of standard solution.
From the spectra of standard solutions and natural water (Figure 3), we can see that all spectra contain 405 nm scattered light signal, 471 nm water-Raman signal, and fluorescence signal of organism, in addition, a 680 nm chlorophyll fluorescence signal can also be seen in spectrum of actual water. Overall, Under the identical laser power, the fluorescence intensity increases with the proportion of sodium humate in standard solution.
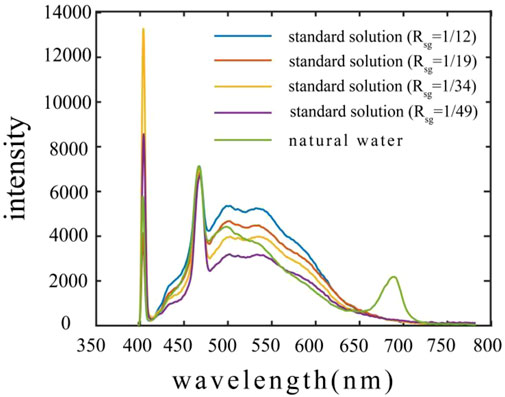
FIGURE 3. The spectra of standard solutions and natural water (vertical direction presents wavelength, horizontal direction presents spectral intensity, the green line presents natural water of COD = 8 mg/L collected from Riyue lake, and other color presents standard solutions under different ratios).
Excluding the effect of 405 nm scattered light signal and 680 nm chlorophyll fluorescence signal, the variation in integrated-fluorescence-intensity of standard solution with Rsg is shown in Figure 4A. It can be seen that the spectral integrated-fluorescence-intensity of the standard solution at the Rsg ranges of 1/50 to 1/20 increases with the increase of Rsg. This phenomenon can be explained that the sodium humate concentration in standard solution increases with Rsg, and results in the increase of fluorescence intensity and integrated-fluorescence-intensity. The crossing point (R = 1/29) of the two lines presents the optimum Rsg where the standard solution has same integrated-fluorescence-intensity as natural water.
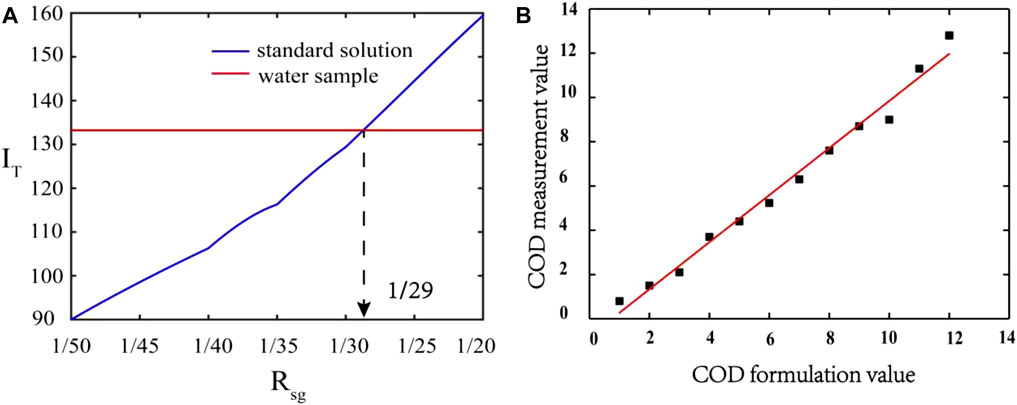
FIGURE 4. (A) The integrated-fluorescence-intensity of standard solution and natural water (red line is the result of natural water sample collected in Riyue lake, purple line is the result of standard solution) (B) The correlation between COD value of formulation and measurement (vertical direction presents COD formulation value, horizontal direction presents COD measurement value).
To verify the accuracy of R = 1/29, rapid digestion spectrophotometry is employed to test the COD measurement value of standard solutions with different concentrations, and the detection of all water samples are repeated for three times. The correlation between the COD standard solution preparation value and the measurement value is established in Figure 4B. It can be seen that the correlation between the COD standard solution preparation value and the measurement value with a correlation coefficient of 0.986 is obtained. The experimental results show that the standard solution prepared at R = 1/29 can be used to simulate natural water.
Figure 5 shows the measured spectra from standard solutions (R = 1/29) of different concentrations, the integrated-fluorescence-intensity increases with COD value at 1–12 mg/L, and a linear regression equation with a correlation coefficient r2 = 0.974 is obtained:
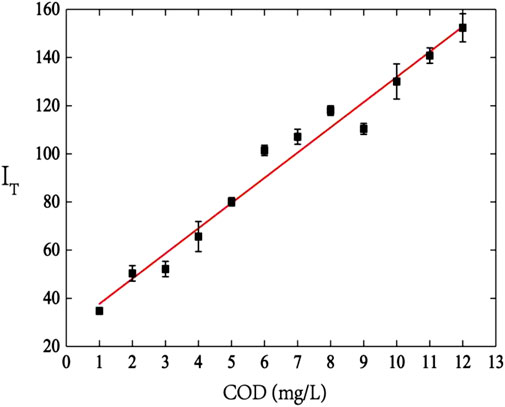
FIGURE 5. The correlation between COD value of standard solution and integrated-fluorescence-intensity (vertical direction presents COD value of standard solution, horizontal direction presents spectral integrated-fluorescence-intensity).
In the practical application, we adopt a Y-type fiber to collect spectral signal, and calculate COD value from Eq 3.
To validate the accuracy of the system designed in this paper, a comparison of the COD measurement results of water samples collected at three different locations in Riyue lake for laser spectroscopy versus rapid digestion spectrophotometry is shown in Table 1. The error of two method is 15.9%, 1.3% and 8.1%, respectively. Overall, the result indicates that laser spectroscopy proposed in this paper can meet the demand on COD measurement of natural water with high accuracy.
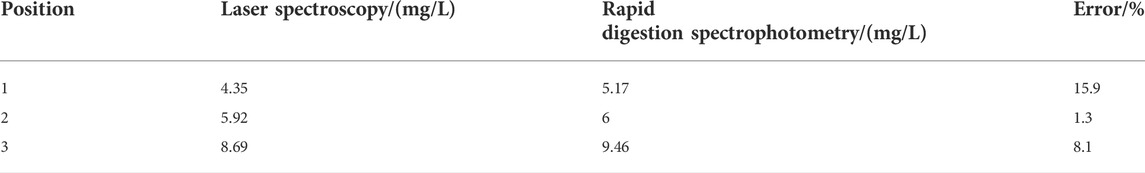
TABLE 1. COD measurement result of natural water samples.
In this paper, a novel water COD detection method based on laser Fluorescence-Raman ratio is proposed, and a small COD detection system is designed to realize the accurate COD measurement. In order to calibrate the instrument conveniently, the mixed solution of humic acid sodium and glucose is adopted as the standard solution for COD measuring by the laser spectroscopy method. The optimum ratio of sodium humate to glucose in standard solution is 1:29 in our experiment. Under this ratio, we detect the standard solution with COD value range of 1–12 mg/L, and establish the correlation between COD value with integrated-fluorescence-intensity. The linear correlation coefficient is r2 = 0.974, and the empirical formula is COD = 0.093 IT-2.359.
In the practical COD measurement, laser spectroscopy and rapid digestion spectrophotometry are used to detect the COD value of three natural water samples. The results of two methods have high consistency, and the measurement error in laser spectroscopy meets the COD detection requirement of natural water quality. The experimental results indicate that the system designed in this paper has the advantages of small probe volume, simplicity, high accuracy, high stability, and so on. Since the optimum ratio of standard solution may be different in different water area, the instrument should be calibrated again so as to achieve the accurate COD measurement in practical application.
The raw data supporting the conclusion of this article will be made available by the authors, without undue reservation.
XC: Validation, investigation, methodology, and writing—original draft preparation, ZT: writing—review and editing, supervision. All authors contributed to the article and approved the submitted version.
This study was supported by the China National Key Research and Development Program under Grant 2020YFE0201500. Excellent Youth Science Foundation of Shandong Province (Overseas), Grant No. 2022HWYQ-073. Youth Program of National Natural Science Foundation of China, Grant No. 12204132.
The authors declare that the research was conducted in the absence of any commercial or financial relationships that could be construed as a potential conflict of interest.
All claims expressed in this article are solely those of the authors and do not necessarily represent those of their affiliated organizations, or those of the publisher, the editors and the reviewers. Any product that may be evaluated in this article, or claim that may be made by its manufacturer, is not guaranteed or endorsed by the publisher.
1 Zhou K P, Bi W H, Zhang Q H, Fu X, Wu G. Influence of temperature and turbidity on water COD detection by UV absorption spectroscopy. Optoelectron Lett (2016) 12(6):461–4. doi:10.1007/s11801-016-6178-z
2 Kolb M, Bahadir M, Teichgraber B. Determination of chemical oxygen demand (COD) using an alternative wet chemical method free of mercury and dichromate. Water Res (2017) 122:645–54. doi:10.1016/j.watres.2017.06.034
3 Ramona R, Valero F, Valle M D. Rapid determination of chemical oxygen demand using a focused microwave heating system featuring temperature control. Analytica Chim Acta (2003) 491:99–109. doi:10.1016/s0003-2670(03)00795-5
4 Ye S, Chen X, Dong D M, Wang J, Wang X, Wang F. Rapid determination of water COD using laserinducedbreakdown spectroscopy coupled with partial least-squares and random forest[J]. Anal Methods (2018) 10:4879–4885.
5 Chen B, Wu H, Li S F. Development of variable pathlength UV–vis spectroscopy combined with partial-least-squares regression for wastewater chemical oxygen demand (COD) monitoring. Talanta (2014) 120:325–30. doi:10.1016/j.talanta.2013.12.026
6 Rudnitskaya A, Kirsanov D, Legin A, Beullens K, Lammertyn J, Nicolai BM, et al. Analysis of apples varieties – comparison of electronic tongue with different analytical techniques. Sensors Actuators B: Chem (2006) 116(1):23–8. doi:10.1016/j.snb.2005.11.069
7 Zhang Z H, Zhang F B, Xu B, Xie H, Fu B, Lu X, et al. High-sensitivity Gas detection with Air-Lasing-Assisted Coherent Raman spectroscopy. Ultrafast Sci (2022) 2022:1–8. doi:10.34133/2022/9761458
8 Fu Y, Cao J C, Yamanouchi K R, Xu H. Air-laser-based Standoff Coherent Raman spectrometer. Ultrafast Sci (2022) 2022:1–9. doi:10.34133/2022/9867028
9 Liu X N, Ma Y F. Tunable diode laser absorption spectroscopy based temperature measurement with a single diode laser near 1.4 μm. Sensors (2022) 22:6095. doi:10.3390/s22166095
10 Qiao S D, Sampaolo A, Patimisco P, Spagnolo V, Ma Y. Ultra-highly sensitive HCl-LITES sensor based on a low-frequency quartz tuning fork and a fiber-coupled multi-pass cell. Photoacoustics (2022) 27:100381. doi:10.1016/j.pacs.2022.100381
11 Abdlaty R, Gobara M, Naiem I, Mokhtar M. Innovative technique for analysis of wastewater contaminants using hyperspectral imaging. Environ Sci (2020) 9:1–10.
12 Jay S, Guillaume M. Regularized estimation of bathymetry and water quality using hyperspectral remote sensing. Int J Remote Sensing (2016) 37(2):263–89. doi:10.1080/01431161.2015.1125551
13 Hang J G, Xiong R C. Quick evaluation of chemical oxygen demand based on spectrophotometric and multi-linear analysis[J]. J Beijing University of Chem Technol (2007) 34 (40):389–392.
14 Liu Y H, Hu J F, Song Y. Review of Research and Application of Environmental Monitoring System Based on Radio Frequency Technology[J]. Technology Review (2021) 27 (8):1–7.
15 Carstea E M, Bridgeman J, Baker A, Reynolds DM. Fluorescence spectroscopy for wastewater monitoring: A review. Water Res (2016) 95:205–219. doi:10.1016/j.watres.2016.03.021
16 Baker A. Fluorescence properties of some farm wastes: Implications for water quality monitoring. Water Res (2002) 36(1):189–195. doi:10.1016/s0043-1354(01)00210-x
17 Lee S., Ahn K H. Monitoring of COD as an organic indicator in waste water and treated effluent by fluorescence excitation-emission (FEEM) matrix characterization. Water Sci Technology (2004) 50(8):57–63. doi:10.2166/wst.2004.0488
18 Hur J, Lee B M, Lee T H, Park DH. Estimation of Biological oxygen demand and chemical oxygen demand for combined sewer systems using synchronous fluorescence spectra. Sensors (2010) 10:2460–71. doi:10.3390/s100402460
19 Chen W, Westerhoff P, Leenheer J A, Booksh K. Fluorescence excitation-emission matrix regional integration to quantify spectra for dissolved organic matter. Environ Sci Technol (2003) 37(24):5701–10. doi:10.1021/es034354c
20 Goffin A, Rechdaoui S G, Rocher V, Varrault G. An environmentally friendly surrogate method for measuring the soluble chemical oxygen demand in wastewater: Use of three-dimensional excitation and emission matrix fluorescence spectroscopy in wastewater treatment monitoring. Environ Monit Assess (2019) 191(7):421. doi:10.1007/s10661-019-7570-5
21 Lee S, Ahn K.H. Monitoring of COD as an organic indicator in waste water and treated effluent by fluorescence excitation-emission (FEEM) matrix characterization. Water Sci Technol (2004) 50:57–63. doi:10.2166/wst.2004.0488
22 Janhom T, Wattanachira S, Pavasant P. Characterization of brewery wastewater with spectrofluorometry analysis. J Environ Manage (2009) 90(2):1184–90. doi:10.1016/j.jenvman.2008.05.008
23 Stedmon C A, Sobecka B S, Hansen R B, Le Tallec N, Waul CK, Arvin E. A potential approach for monitoring drinking water quality from groundwater systems using organic matter fluorescence as an early warning for contamination events. Water Res (2011) 45(18):6030–8. doi:10.1016/j.watres.2011.08.066
24 Du S X, Wu Y Q, Yuan Z B. Detection of COD in the wastewater treatment process based on fluorescence excitation-emission matrix spectrometry. Appl Mech Mater (2012) 178-181:599–602. doi:10.4028/www.scientific.net/amm.178-181.599
25 Zepp R G, Sheldon W M, Moran M A. Dissolved organic fluorophores in southeastern US coastal waters: Correction method for eliminating Rayleigh and Raman scattering peaks in excitation–emission matrices. Mar Chem (2004) 89:15–36. doi:10.1016/j.marchem.2004.02.006
26 Yang L Y, Hur J, Zhuang W. Occurrence and behaviors of fluorescence EEM-PARAFAC components in drinking water and wastewater treatment systems and their applications: A review. Environ Sci Pollut Res (2015) 22(9):6500–10. doi:10.1007/s11356-015-4214-3
27 Bieroza M, Baker A, Bridgeman J. Classification and calibration of organic matter fluorescence data with multiway analysis methods and artificial neural networks: An operational tool for improved drinking water treatment. Environmetrics (2011) 22(3):256–70. doi:10.1002/env.1045
28 Hambly A C, Henderson R K, Storey M V, Baker A, Stuetz R, Khan S. Fluorescence monitoring at a recycled water treatment plant and associated dual distribution system – implications for cross-connection detection. Water Res (2010) 44:5323–33. doi:10.1016/j.watres.2010.06.003
29 Vallieres M, Donaldson D J. Fluorescence Quenching of chlorophyll by Sea water components. ACS Earth Space Chem (2020) 4:2378–83. doi:10.1021/acsearthspacechem.0c00247
30 Bridgeman J, Baker A, Carliell-marquet C, Carstea E. Determination of changes in wastewater quality through a treatment works using fluorescence spectroscopy. Environ Technology (2013) 34(23):3069–77. doi:10.1080/09593330.2013.803131
31 Old G H, Naden P S, Granger S J, Bilotta G, Brazier R, Macleod C, et al. A novel application of natural fluorescence to understand the sources and transport pathways of pollutants from livestock farming in small headwater catchments. Sci Total Environ (2012) 417-418(4):169–82. doi:10.1016/j.scitotenv.2011.12.013
32 Chen Q, Wang L F, Chen W, Wang YS, Liu XY, Jiang H, et al. Fluorescence approach for the determination of fluorescent dissolved organic matter. Anal Chem (2017) 89(7):4264–71. doi:10.1021/acs.analchem.7b00324
33 Liu X, Zhang Y, Shi K, Zhu G, Xu H, Zhu M. Absorption and fluorescence properties of chromophoric dissolved organic matter: Implications for the monitoring of water quality in a large subtropical reservoir. Environ Sci Pollut Res (2014) 21(24):14078–90. doi:10.1007/s11356-014-3319-4
34 Bridgeman J, Baker A, Boxall J, Brown D. Portable LED fluorescence instrumentation for the rapid assessment of potable water quality. Sci Total Environ (2015) 524-525:338–46. doi:10.1016/j.scitotenv.2015.04.050
35 Zheng P C, Yang C, Zhang H X, et al. Research on water quality COD detection method based on laser induced fluorescence[J]. Laser J (2022).
36 Dudelzak A E, Babichenko S M, Poryvkina L V, Saar KJ. Total luminescent spectroscopy for remote laser diagnostics of natural water conditions. Appl Opt (1991) 30:453. doi:10.1364/ao.30.000453
37 Maes T, Jessop R, Wellner N, Haupt K, Mayes AG. A rapid-screening approach to detect and quantify microplastics based on fluorescent tagging with Nile Red. Sci Rep (2017) 7:44501. doi:10.1038/srep44501
38 Tian Z S, Bi Z J, Wang Y W, Zhao H. Rapid evaluation method based on DOM for water quality by microlaser fluorescence spectrometer. Appl Phys B (2020) 126(9):150–5. doi:10.1007/s00340-020-07498-1
Keywords: chemical oxygen demand, y-type fiber, spectroscopy, fluorescence, Raman laser, 405 nm laser
Citation: Che X, Tian Z, Sun F, Liu Q, Bi Z, Chen H and Cui Z (2022) Research on chemical oxygen demand based on laser Fluorescence-Raman spectroscopy. Front. Phys. 10:1055049. doi: 10.3389/fphy.2022.1055049
Received: 27 September 2022; Accepted: 18 October 2022;
Published: 02 November 2022.
Edited by:
Qun Hao, Beijing Institute of Technology, ChinaReviewed by:
Zaijun Chen, University of Southern California, United StatesCopyright © 2022 Che, Tian, Sun, Liu, Bi, Chen and Cui. This is an open-access article distributed under the terms of the Creative Commons Attribution License (CC BY). The use, distribution or reproduction in other forums is permitted, provided the original author(s) and the copyright owner(s) are credited and that the original publication in this journal is cited, in accordance with accepted academic practice. No use, distribution or reproduction is permitted which does not comply with these terms.
*Correspondence: Zhaoshuo Tian, dGlhbnpoYW9zaHVvQDEyNi5jb20=; Qingcao Liu, cWluZ2Nhby5saXVAaGl0LmVkdS5jbg==
Disclaimer: All claims expressed in this article are solely those of the authors and do not necessarily represent those of their affiliated organizations, or those of the publisher, the editors and the reviewers. Any product that may be evaluated in this article or claim that may be made by its manufacturer is not guaranteed or endorsed by the publisher.
Research integrity at Frontiers
Learn more about the work of our research integrity team to safeguard the quality of each article we publish.