
95% of researchers rate our articles as excellent or good
Learn more about the work of our research integrity team to safeguard the quality of each article we publish.
Find out more
ORIGINAL RESEARCH article
Front. Phys. , 22 November 2022
Sec. Biophysics
Volume 10 - 2022 | https://doi.org/10.3389/fphy.2022.1052203
 Sandra Pérez-Domínguez1
 Elisabeth Werkmeister2Maria Luisa Marini2
 Vincent Dupres2
 Sébastien Janel2
 Frank Lafont2
 Manfred Radmacher1*
In tissue, cells are obliged to confine and adapt to a specific geometric shape due to the surrounding environmental constraints. Under healthy conditions, fibroblasts present an elongated shape; however, changes in biochemical and physical properties of the extracellular matrix could distort the cell shape, inducing a pathological state. We have studied fibroblasts’ mechanical behavior under circular geometrical constraints. Circular micropatterns force fibroblasts to acquire a different shape from that of a healthy tissue, inducing a possible pathological condition. In total, three different fibroblast types from Dupuytren’s disorder, all obtained from the same patient, were confined in circular-shaped micropatterns of three different diameters (25, 35, and 45 µm), and mechanical properties were evaluated using an atomic force microscope (AFM). We found that control fibroblast mechanics (apparent Young’s modulus) increases with the increasing pattern diameter and comes together with a decrease in cell height and in loss tangent, translated into a more solid-like behavior. We hypothesize that these results resemble the transition toward the myofibroblast phenotype, ameliorating cytoskeleton formation and organization and enhancing cell contraction. Scar and Dupuytren fibroblasts did not display major changes in cell mechanics and cell height when changing the pattern diameter, suggesting that they are less affected by physical changes in the environment as they can adapt their shape to the geometrical dimensions. Therefore, our findings demonstrate that combining micropatterning and AFM measurements provides a powerful tool to study cell mechanics inducing constraints onto the cell, thus mimicking certain aspects of the tissue environment in both healthy and pathological states.
Dupuytren’s disease (DD) is a fibroproliferative disease that affects the palmar hand, causing progressive and permanent bending of the digits. The disease may cause hand contraction, hampering hand normal function and diminishing the patient’s quality of life. The palm of patients who suffer from the disease shows high numbers of fibroblasts, increased deposition of collagen, and the presence of myofibroblasts (differentiated fibroblasts that present α-smooth muscle actin (SMA)), which are involved in wound healing. In wound healing, fibroblasts from the surrounding area migrate to the damage area and experience a transdifferentiation into myofibroblasts that increase mechanical stress on the extracellular matrix (ECM) and help in tissue remodeling. The differentiation into the myofibroblast phenotype depends on the activation of transforming growth factor β-1 (TGFβ-1) that lives in the ECM and stimulates α-SMA expression that leads to an increase in cell contraction. Myofibroblast contraction is transmitted to the ECM, also provoking changes in ECM stiffness due to fiber rearrangements and protein deposition, such as collagen. Non-invasive treatments, such as needle fasciotomy and collagenase injection, have been used to treat the disease; however, in the vast majority of the cases, it recurs. Open surgery for removing the affected area is normally used in later stages of the disease.
Cell mechanics is a useful approach to study cell viscoelastic behavior at a single-cell level and is mainly governed by a cytoskeletal network, especially by actin fibers that are also responsible for cell contractility. The cytoskeleton network is important to maintain cell shape and mechanics, playing a role in many cellular processes, such as migration and contraction [1,2]. The cell–cell interplay, cell–ECM as well as matrix stiffness, and composition have been shown to modify cell mechanics dictating cell cytoskeletal network organization, cell shape, and polarity [3]. Many techniques have been used to assess cell mechanical behavior, like optical and magnetic tweezers, micropipette aspiration, and atomic force microscopy (AFM), among others. Atomic force microscopy (AFM) is one of the most established and leading techniques to measure cell mechanics under physiological conditions. It allows applying a well-defined force and provides both topographical and mechanical characterization of living cells [4].
In the last decade, the interest in studying mechanical properties of cancer cells in comparison to healthy counterparts using AFM has grown due to its ability to discriminate one from the other [5]. The majority of these studies were performed in hard cell culture dishes, whose stiffness is far from the natural tissue mechanics. Recently, soft artificial hydrogels, such as polyacrylamide (PA) and hydrogels employing abundant ECM proteins, like collagen, have been used to mimic cell’s environment stiffness. For example, changes in thyroid cells when plated in PA gels of different stiffness have been reported [6]. Lately, experiments trying to resemble cell’s environment are gaining importance, either biochemically or biophysically. The biochemical and biophysical composition of this environment governs many cellular processes, such as cell differentiation, growth, division, and even cell death [7,8]. In general, it is not easy to get access to tissue samples, especially from humans, which is the closest biological organization to cell’s natural conditions; therefore, different strategies have been devised to resemble cell’s natural environment. In tissue, cells are not isolated; instead, they are surrounded by a large number of neighboring cells and the extracellular matrix (ECM). This natural environment provides cells with geometrical constraints that not only influence cell morphology and mechanics but also polarity and function. In research, photolithography techniques generating reusable masks with specific geometries, as well as protein micropatterning, are considered a good compromise to resemble cell constraints in tissue. AFM experiments using cell culture dishes lead to continuous cell structural and morphological rearrangement; however, the use of micropatterns of different geometries and dimensions is an interesting approach to limit cell spreading in a defined space [9]. Regular pattern shapes mimicking tissue constraints drive cells to adapt their morphology and cytoskeletal architecture. One of the main advantages of systematizing a regular shape is the reduction in heterogeneity and variation due to constant and reproducible cell features. Many studies used PDMS-based lithography to confine cells in limited spaces, creating different geometries in which cells could adapt [10,11]. The ECM environment has a strong influence on actin cytoskeleton localization inside the cells that contributes to cell polarity establishment; hence, it was shown that convex micropattern features promoted the assembly of lamellipodia and concave features promoted the assembly of stress filaments [12,13]. Cell’s spreading direction—lamellipodia protrusions—differs depending on micropattern geometry [14,15]. Patterned cells in square or triangular shapes preferentially extended the lamellipodia at the corner; however, cells adherent to circular shapes formed lamellipodia at all regions of the perimeter. Several studies evaluated the directionality and speed of cell migration using switchable surfaces, whose adhesiveness can be turned on and off when desired ([16–18]). In addition, micropatterning can be used to study cell’s focal adhesion points using different geometries that provide similar cell morphology but different cytoskeleton distributions [9]. Therefore, the use of micropatterns could help resemble cell’s constraints under healthy tissue conditions, but it could also serve to study cell adaptability to new environments, forcing them to acquire a different geometrical constraint to healthy conditions.
In this study, we prepared circular micropatterns on glass coverslips using UV photolithography with a chrome photomask. The micropatterned surfaces were used to culture three different fibroblasts from Dupuytren’s disorder (control and pathological fibroblasts) on circular areas of different diameters (25, 35, and 45 µm in diameter), and cell mechanics was assessed employing AFM. Under healthy tissue conditions, fibroblasts possess an elongated shape; however, in the pathological state, physical and biochemical changes in the environment can modify fibroblast morphology; therefore, we employed circular-shaped patterns to force cells to develop in a non-natural state. Circular-shaped fibronectin micropatterns could enable us to induce or simulate a disorder typical of a pathological state and therefore compare the behavior of fibroblasts presenting different pathological states. Moreover, using the AFM sweep modulation scheme and analyzing the data using the structural damping model, we could extract viscous and elastic properties of the cells.
Primary fibroblasts were isolated from three surgically removed skin tissues of left-hand palmar fascia regions of a 55-year-old female patient. Scar fibroblasts were derived from cutaneous scar excision and control from adjacent skin tissue. Dupuytren fibroblasts were isolated from the nodules in the palmar fascia. Cells were incubated in Dulbecco’s modified Eagle medium (DMEM, containing 3.7 g/L NaHCO3 and 4.5 g/L d-glucose, FG0435, Sigma) supplemented with 10% fetal bovine serum (F7524, Sigma) and 2% streptomycin–penicillin (P0781, Sigma). Approximately 30,000 cells were added onto patterned coverslips and incubated for 5–6 h at 37 °C and 5% CO2. Then, the patterned coverslips were washed with a complete medium twice to remove non-adherent cells. Fibroblasts between passages 8–10 were used, where cells proliferate consistently.
Here, 22-mm-diameter round glass coverslips were sonicated with acetone for 2 min followed by water sonication for 2 min. The coverslips were then washed with ethanol for 1 minute and dried. Once the coverslips were completely dried, they were incubated in a UV ozone chamber (UVO Cleaner 30–220, Jelight Company Inc., USA) for 5 minutes to activate the surface. The surface of the coverslips must be coated with an antifouling polymer that prevents adhesion of molecules and cells. The activated surface of the coverslip was incubated with the antifouling PLL (20)-g [3.5]-PEG (2) solution (SuSoS AG, Switzerland) at a concentration of 0.1 mg/ml for 1 hour at room temperature in a wet chamber. After 1 hour of incubation, the coverslips were rinsed with PBS once and milli-Q water four times. To generate patterns, we used a chromate synthetic quartz mask that has the circles drawn on it (Delta Mask B.V., Netherlands) (circular-shaped micropatterns used have dimensions of 25, 35, and 45 µm diameter and illuminating a ring of 7 μm width). The coverslips were attached onto the mask with a small water drop and exposed to UV for 5 minutes. The UV oxidizes the PLL-PEG layer generating a chemically structured surface on the coverslip. After that step, the coverslips can be stored at 4°C for 1 month. Before usage, the coverslips need to be hydrated for 30 min with PBS and incubated with 25 μg/ml fibronectin—5 μg/ml fibrinogen (Sigma) for 1 hour at room temperature. The fibronectin–fibrinogen solution is prepared in 100 mM NaHCO3 (pH = 8.6), and the fibrinogen is labeled using an Alexa Flour 488 dye to allow checking pattern formation. The fibronectin should attach to the bare glass, that is, the areas where the PLL-PEG was removed by UV irradiation [19].
Approximately 10 cells of each type of fibroblasts were measured in 25-µm-diameter circles, 20 cells in 35-µm-diameter circles, and 15 cells of each fibroblast type in 45-µm-diameter circles. AFM measurements were performed using an MFP3D AFM (Asylum Research, Santa Barbara, California, USA) combined with an optical microscope (Zeiss Axiovert 135, Zeiss, Oberkochen) to control tip and sample positioning. Coverslips were glued onto cell culture dishes with superglue (UHU) to avoid detachment, and the medium was just added over the coverslip to avoid contamination with the glue. Cell culture dishes, containing samples, were fixed to an aluminum holder with vacuum grease (Merck, silicone high-vacuum grease) and mounted on the AFM stage with two magnets. The entire setup was enclosed in a home-built polymethylmethacrylate (PMMA) box in order to inject and maintain 5% CO2 during experiments. Patterned fibroblasts were probed on the nuclear region. PFQNM-LC-A-CAL cantilevers were used (Bruker, pre-calibrated spring constant around 100 pN/nm and resonance frequency of 45 kHz in air), which are three-sided pyramid cantilevers (opening angle 15–25°) with a sausage-like protrusion at the very end that has a length of 0.8–1 µm and a radius of curvature of 75 nm. Apparent Young’s modulus values were extracted from regular force curves, and the sweep frequency method was used to obtain cell rheological properties ([20]; Malvern Instruments, 2016). The force map scan size was 5 μm and composed of 16 or 256 force curves (4 × 4 or 16 × 16 lines per frame). Typically, the force curves were recorded at a scan rate of 2 Hz, corresponding to a maximum velocity of 20 μm/s.
Data analysis software IGOR (WaveMetrics, Lake Oswego, OR, USA) was used to evaluate the mechanical properties of cells in terms of apparent Young’s modulus (E). The Hertzian model for parabolic tips was used to calculate apparent Young’s modulus for each force curve within a force map [21]. The median and 25/75 percentiles and logarithmic histogram of apparent Young’s modulus were considered representative modulus of each force map. Sweep frequency data were fitted with the power law structural damping model [22,23] and corrected for the hydrodynamic viscous drag [24]. E* data are separated into real (in phase) and imaginary (out of phase) parts. The real part represents the storage modulus, and it is a measure of the elastic energy stored and recovered per cycle of oscillation. The imaginary part depicts the loss modulus, and it accounts for the energy dissipated per cycle of sinusoidal deformation. We also calculate the power law exponent and loss tangent, which is an index of the solid-like (<1) or the liquid-like (>1) behavior of the cell. This model assumes a storage modulus that increases with frequency following a power law with the exponent α and a loss modulus that includes a term that is a fraction η of the storage modulus and a Newtonian viscous term, μ [25,26].
After 5 to 6 hours of cell seeding on coverslips, cells were fixed with 4% paraformaldehyde for 10 min and permeabilized with 0.2% Triton X-100 for 5 min. The samples were washed with PBS after each step and then incubated with 10% FBS along with the primary antibody against vimentin (rabbit anti-vimentin 1:200) (Abcam, ab92547) for 30 min at room temperature. The secondary antibody (goat anti-rabbit 1:200, Atto647N) and Alexa Flour 488 phalloidin for actin fibers (1:200) (Thermo Fisher Scientific, A12379) were then incubated for 45 min at room temperature. DAPI (1:5,000) was added for 10 min, while the incubation of the secondary antibody was still running. Finally, cells were stored in PBS at 4 °C prior to image acquisition. An inverted spinning-disk microscope equipped with a Live SR module (LNSB2, Nikon TI-2, Yokogawa CSU-W1-T2, Gataca Systems) with the ×63 objective lens (Plan Apo, NA 1.4 Oil) was used to observe cells and collect fluorescent images (Photometrics Prime95B Scientific CMOS Camera) through appropriate filters (emission: 450/50; 525/50; 595/50; and 700/75). Three-dimensional-view representation videos were created using IMARIS software (Bitplane, Oxford Instruments).
The super-resolution images were taken using a stimulated emission depletion (STED) microscope (Abberior Instruments GmbH, Germany) with the ×100 objective lens (Plan Apo, NA 1.4 Oil), with an excitation at 640 nm followed by a depletion at 775 nm. SiR-actin (Cytoskeleton, Inc., 1:1,000) was used to label F-actin in live cells. The cell culture medium was replaced, and SiR-actin was directly added to the cells. The cells were then placed in the incubator at 37°C and 5% CO2 for 1–2 h prior to image acquisition.
Cell height and volume were calculated using Fiji software. From the orthogonal projections of the cell, the cell height was obtained, and the cell volume was estimated from the area of the orthogonal projections.
Differences between the apparent Young’s modulus of different cells or different patterns were determined using the Wilcoxon signed-rank test and Cohen’s d-test using IGOR. For each force volume, E’s median was calculated. The effect size (Cohen’s d) between the mean of E and the significance of difference (Wilcoxon signed-rank) between the E for each type of patterned fibroblasts was tested. p-values were obtained using the Wilcoxon signed-rank test, where * indicates p < 0.01, and Cohen’s d-test, where # indicates 0.2 < d < 0.5 and ## indicates d > 0.5.
Two different ECM proteins were tested in order to optimize the highest efficiency in cell patterning. We compared fibronectin versus collagen I as adhesive proteins, both present in fibroblast’s natural environment. The fibronectin-coated micropatterns provided much higher cell patterning and attachment success than collagen (Figure 1). The number of patterned cells in circular patterns with respect to the number of attached cells is similar in both cases, reaching around 50–60%. The rate of success, referring to the number of patterned cells with respect to the number of circular patterns, in the case of collagen micropatterns was around 20%; however, the fibronectin covering reached around 50% cell patterning.
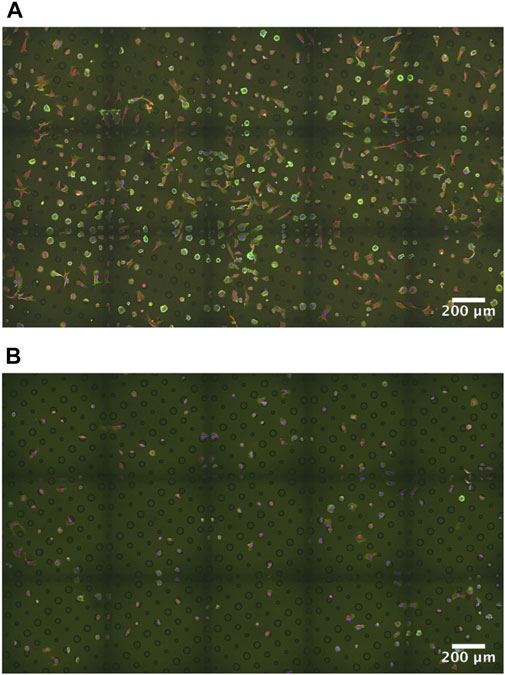
FIGURE 1. Dupuytren fibroblasts plated on the three circular micropatterns of different diameters. Adhesive proteins (A) fibronectin and (B) collagen I. Fibroblast labeling: actin in green, vimentin in red, and nuclei in blue. Supplementary Figures S9, S10: control and scar fibroblasts plated on the three circular micropatterns of different diameters (fibronectin coating).
We plated all fibroblast types in circular micropatterns, and Figure 2 shows an example of each fibroblast under all conditions. We could observe how actin filament distribution was significantly influenced by the pattern diameter. Thanks to the z-stack images taken along the entire cell height, from the bottom to the top layer, we could generate 3D view representation of the cells under all conditions (Supplementary Videos, Supplementary Material). This 3D view allowed us to assess if there was any correlation between cell height, pattern diameter, and fibroblast type (Table 1). Three-dimensional videos showed cells in which actin, vimentin, and nucleus were stained, giving interesting information about cell cytoskeleton organization. As actin fibers are one of the main cytoskeleton components that dictate the cell mechanical behavior, z- and orthogonal projections of scar fibroblasts—showing just actin fibers—patterned in the three circular-shaped patterns were generated (Figure 3). The z-projection accumulates all images taken alongside the cell body, from the bottom to the upper layer, and it shows how actin fibers organize within the cell when patterned on the circles of different diameters. In particular, in Figures 3B,C, the actin fibers follow the circular pattern that corresponds to the lamellipodia (concentric fibers) and in the cell body, which is sitting in the non-adherent area, filaments are less concentrated and organized. In the case of control fibroblasts, there is a decrease in cell height when the pattern diameter increases; however, scar and Dupuytren’s fibroblasts did not present the same behavior, showing a more constant cell height regardless of the pattern dimension (Figure 4 and Table 1). Moreover, from the xz projections, we estimated a relative volume of the cells; in all cases, fibroblasts increase their volume with the increasing pattern diameter (Supplementary Figure S13). Control fibroblasts appear to present less actin filaments than the pathological counterparts (Figure 2). A similar cell behavior was shown in flat rigid cell culture dishes. Control fibroblasts presented less and randomly distributed actin fibers in contrast to scar and Dupuytren fibroblasts, which displayed aligned and thick actin fibers [27,28] (Figure 5).
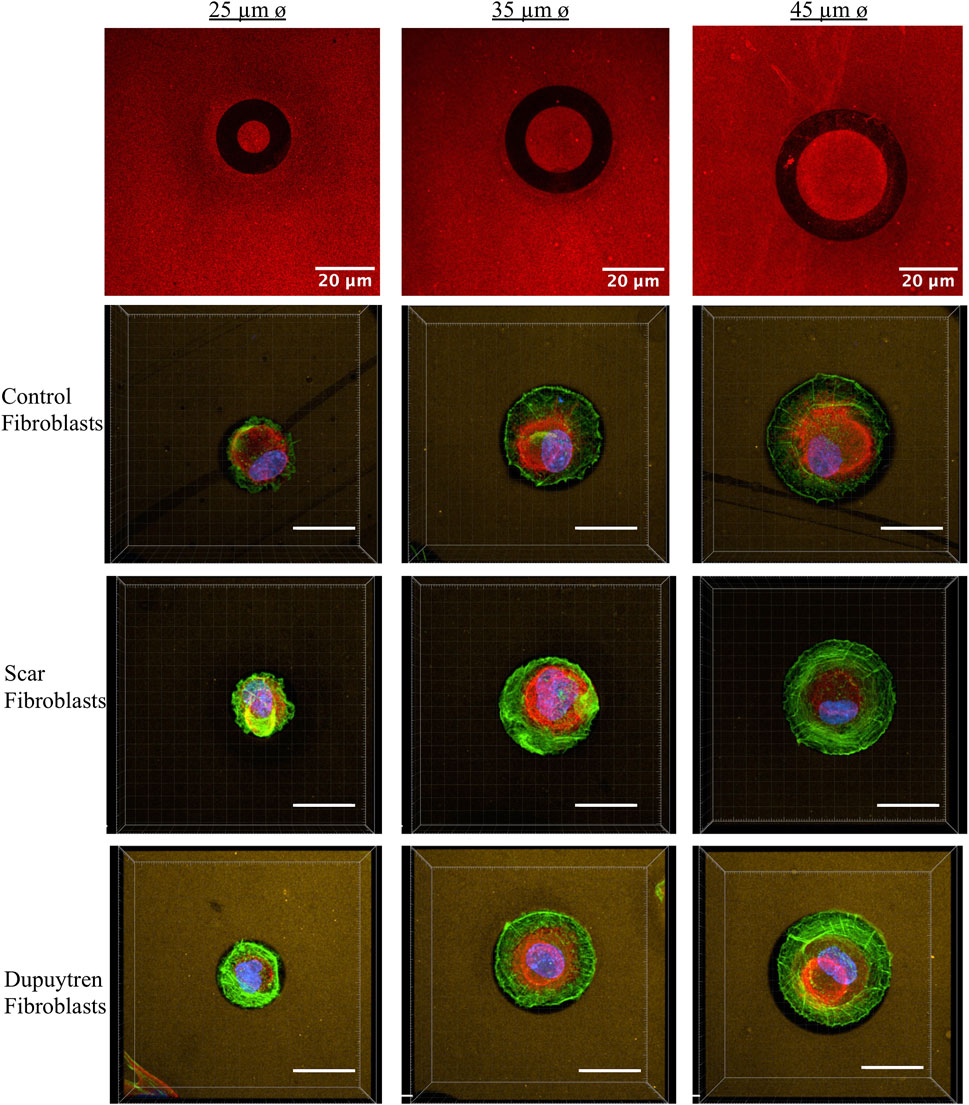
FIGURE 2. Examples of individual fibroblasts plated on 25-, 35-, and 45-μm-diameter circular micropatterns (left to right). The first row represents fibronectin circular-shaped micropatterns in black. The following rows represent fluorescence microscopy images of each type of fibroblasts in which the actin fibers are labeled in green, vimentin in red, and nuclei in blue. Three-dimensional view videos are available in the Supplementary Material.
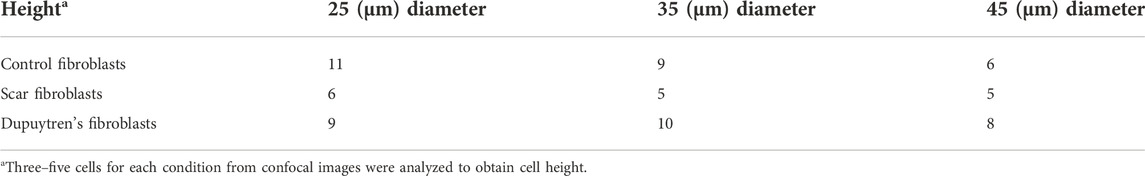
TABLE 1. Cell height when patterned in the different circular-shaped diameters.
FIGURE 3. Z and orthogonal projections of scar fibroblasts patterned in (A) 25-µm circle, (B) 35-µm circle, and (C) 45-µm circle. Actin fibers labeled in green. (Supplementary Figures S11, S12: control and Dupuytren fibroblasts projections).
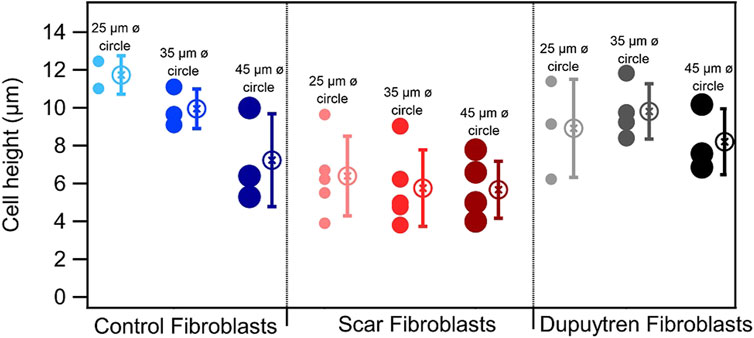
FIGURE 4. Mean and standard deviation representation of the cell height obtained from the xz projections (N = 4). The circles next to each mean value correspond to the individual measurements.
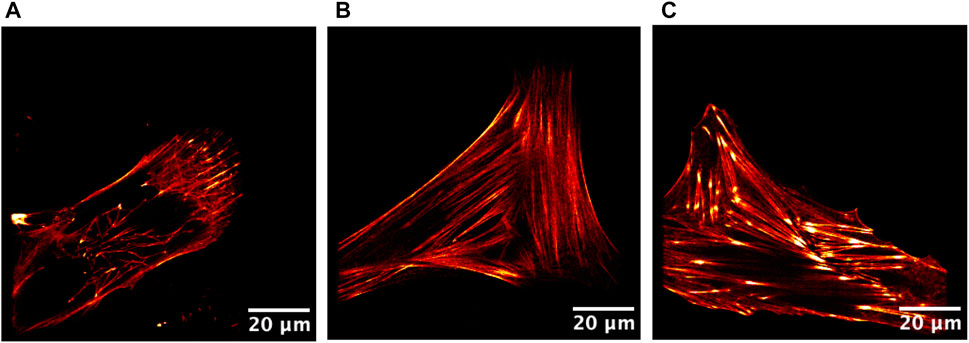
FIGURE 5. STED images of live single cells plated on cell culture dishes. (A) Control fibroblasts, (B) scar fibroblasts, and (C) Dupuytren fibroblasts. Actin fibers were labeled in red. Scale bar: 20 µm.
Mechanical and rheological properties of patterned cells were evaluated using AFM. The number of cells scanned in each circular-shaped pattern was arbitrary, since the pattern size at which the cells were adhered was analyzed after AFM measurements. Measurements were performed on the nuclear region to avoid artifacts of feeling the underlying support; but in some cases, the elasticity of the whole cell could be scanned (Figure 6A). We found that the softest area of the cell correlates with the tallest part that corresponds to the cell body (Figure 6B). The cell lamellipodia is thinner and stiffer due to the bottom effect and accumulation of actin filaments, as shown in the fluorescent images (Figure 2). Our AFM results corroborate the different behaviors of the three fibroblast types. The apparent Young’s modulus was extracted from the approach part of the force curves using the Hertzian model for parabolic tips. The apparent Young’s modulus of control fibroblasts increases with increasing pattern diameter (1.02, 1.39, and 2.12 kPa for 25-, 35-, and 45-µm-diameter circular constraints, respectively); however, this behavior is not followed by the other two cell types (Figure 7). Interestingly, Dupuytren fibroblasts maintain their mechanical properties regardless of the circle diameter (1.61, 1.58, and 1.59 kPa for 25-, 35-, and 45-µm-diameter circle constraints, respectively). In addition, scar fibroblasts appear to mix both behaviors, similar to control fibroblasts at a lower pattern diameter and closer to the pathological fibroblasts when the constraint diameter increases (1.02, 1.78, and 1.71 kPa for 25-, 35-, and 45-µm-diameter circle constraints, respectively). The Wilcoxon signed-rank test and Cohen’s d statistical analysis were used to evaluate statistical significance of apparent Young’s modulus between different cell types and pattern dimensions. Highly significant differences were found within control fibroblasts patterned on 25-μm and 45-µm-diameter circles. Cohen’s d-test suggested a medium size effect between control fibroblasts patterned on 25 and 35 µm circles; and also, between 35- and 45-µm-diameter circles. Moreover, a medium size effect was seen between scar fibroblasts patterned on 25-µm circles and the two larger patterns (scar fibroblasts on 35- and 45-µm-diameter circles). A large effect of the pattern size was also seen in control fibroblasts patterned between 25- and 45-µm-diameter circles (Figure 7). As it has been mentioned in previous studies [6], Young’s modulus is a parameter that describes the elastic response of an object when deformed by an external force. However, cells are complex and heterogeneous materials that present elastic and viscous responses. According to that, apparent Young’s modulus parameter (which is the Young’s modulus determined from the approach curve) gathers both elastic and viscous contributions and it is not able to distinguish between them. To overcome this issue, there are few AFM strategies that allow describing cells’ mechanical properties separating both elastic and viscous contributions. In this work, we employed the so-called sweep frequency, already described in previous studies [29,30]. Briefly, after approaching the tip to the sample as in a regular force curve, a sinusoidal modulation with increasing frequency (1 Hz–1 kHz) is applied, while the tip is still in contact with the cell. When this step is finished, the tip is fully retracted out of contact (Supplementary Figures S2, S3). The cantilever is oscillated applying a low amplitude of 50 nm. To analyze the data, the power law structural damping model is used, and viscous drag of the cantilever has been corrected (Supplementary Figure S5). This model provides information about the elasticity and viscosity of the cells separately. Frequency dependence of the storage and loss modulus measured on the different fibroblasts in all circular patterns can be seen in Supplementary Figure S4. Both moduli displayed a similar trend up to 10 Hz; however, the loss modulus showed increased frequency dependence at higher frequencies. We observed that control fibroblasts displayed a decrease in the loss tangent at 1 Hz with increasing pattern diameter, whereas Dupuytren and scar fibroblasts did not show major changes (Dupuytren: 0.24 in all cases; scar: 0.36, 0.27, and 0.32 from 25- to 45-µm-diameter circles) (Figure 8). Statistical analysis suggests a significant difference between control fibroblasts patterned on 25- and 45-µm-diameter circles and a medium size effect between Dupuytren fibroblasts patterned on 25 µm and the other two bigger circular patterns, as well as a medium size effect between control fibroblasts on 25 µm versus 35 µm and 35- versus 45-µm-diameter circles. Finally, a large size effect is observed between control fibroblasts patterned on 25- and 45-µm-diameter circle. Therefore, in the case of control fibroblasts, we saw that an increase in the Young’s modulus with increasing the pattern diameter comes together with a decrease in loss tangent, which can be related with an increase in the elastic over the viscous properties, corresponding to a more solid-like behavior. The power law exponent is associated with cell’s dynamic structural elements at the mesoscale and present similar values for all cases, presenting values around 0.15 and 0.2 for Dupuytren and scar fibroblasts, respectively, except for control fibroblasts, which decreases with increasing pattern diameter (going from 0.23 to 0.13, from 25 to 45 µm diameter) (Figure 8). Statistical analysis for power-law exponent results displays same significant differences and size effect as the loss tangent. E0, which is the scale factor of storage and loss modulus, varies depending on the cell type and pattern diameter. Dupuytren and scar fibroblasts seem to be independent on the pattern diameter (Dupuytren: 1,500 to 1,400 Pa, from 25 μm to 45 µm diameter; and scar: 900–1,000 Pa, from 25 μm to 45 µm diameter). Nevertheless, control fibroblasts show an increase going from 500 to 2,300 Pa (Supplementary Figure S6). The statistical analysis showed significant differences between control fibroblasts patterned on 25- and 45-µm-diameter circles; Cohen’s d size effect displayed a medium size effect between control fibroblasts on 25 µm and the bigger circles; also, all patterned scar fibroblasts within each other and Dupuytren fibroblasts patterned on the 45-µm-diameter circle and the two smaller circles. The Newtonian viscous term (μ) is rather small and constant for Dupuytren and scar fibroblasts regardless of the pattern diameter (10 Pa
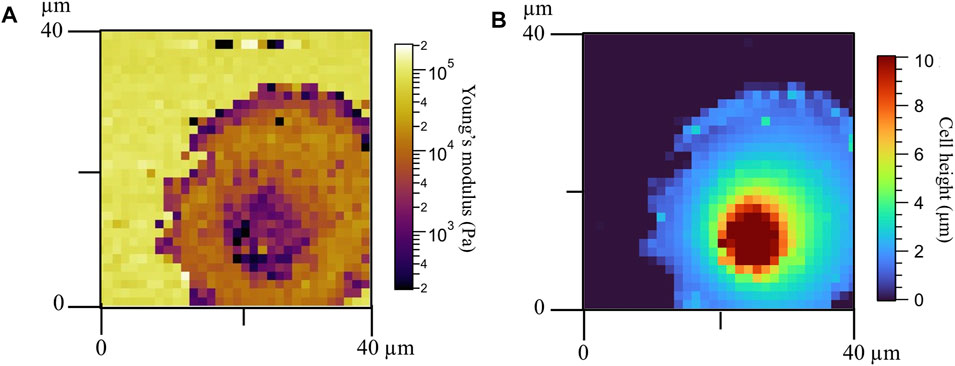
FIGURE 6. (A) Apparent Young’s modulus of a Dupuytren fibroblast patterned in a 35-µm-diameter circle and (B) cell height.
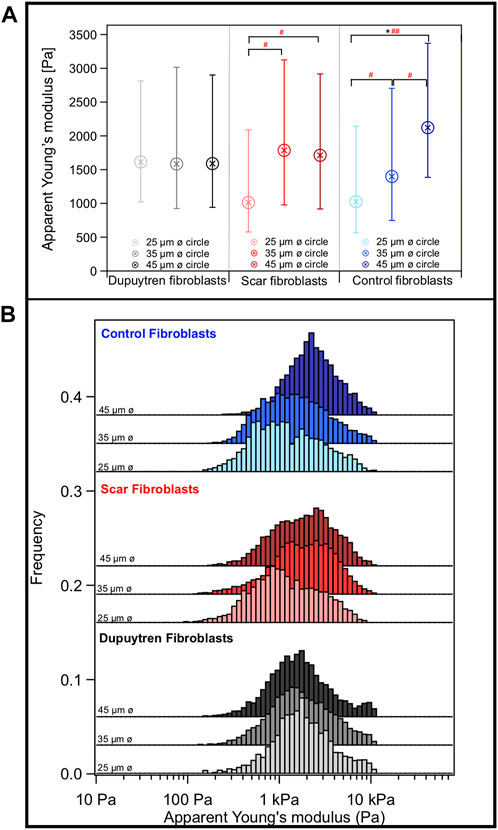
FIGURE 7. (A) Box plot of the apparent Young’s modulus with the median and the 25/75 percentiles and (B) histogram distribution. Data shows information about different cells. Each color represents one type of fibroblast, Dupuytren, scar, and control were labeled in black, red, and blue, respectively. In addition, within each group, the color gradient shows the cells patterned in each circular size, from the lightest to the darkest, goes from 25 to 45 µm ø circular sizes, respectively. Statistical analysis: Wilcoxon signed-rank test significant difference: * indicating p < 0.01 and Cohen’s d test with # indicating an effect size of 0.2 < d < 0.5 and ## indicating d > 0.5. ø = diameter (N = 15).
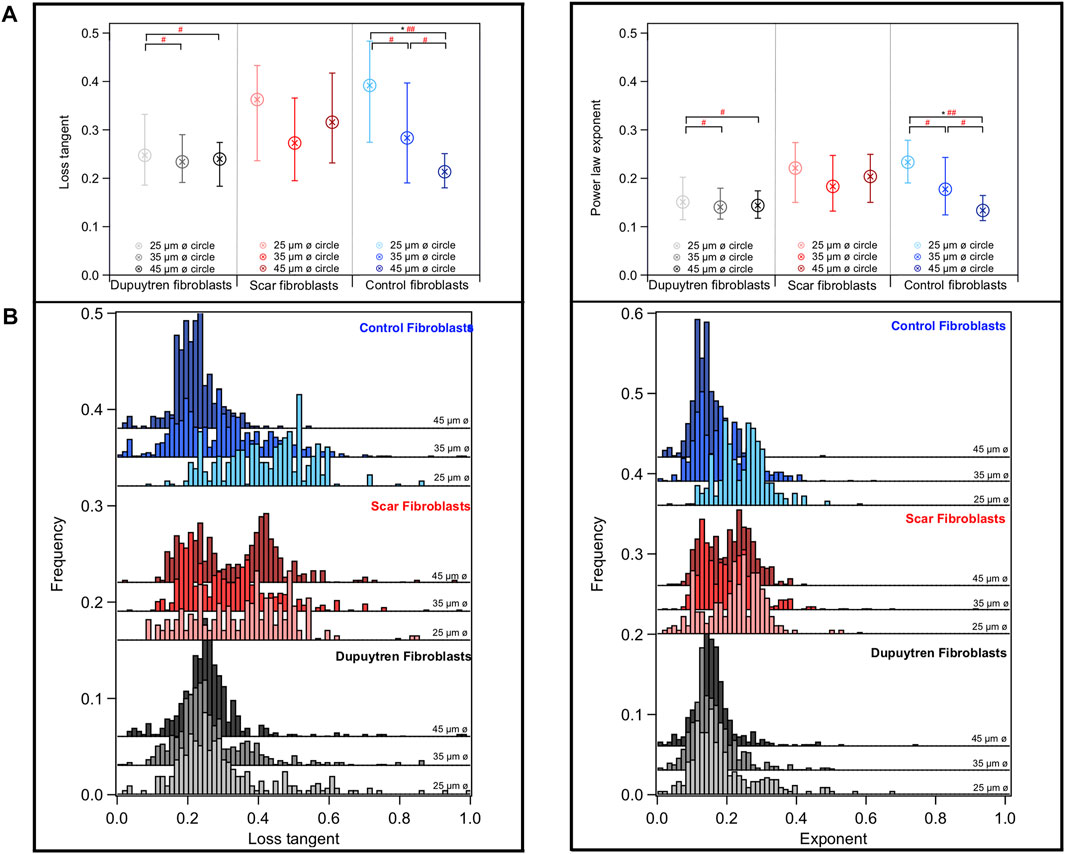
FIGURE 8. (A) Box blot with the median and the 25/75 percentiles and (B) histogram distribution of the loss tangent at 1 Hz and power law exponent for each fibroblast, left and right graphs, respectively. Data shows information about different cells. Each color represents one type of fibroblast, Dupuytren, scar, and control in black, red, and blue, respectively. In addition, within each group, the color gradient shows the cells patterned in each circular size, from the lightest to the darkest, goes from the 25 to the 45 µm ø circular sizes, respectively (E0, µ, and storage and loss moduli graphs are given in Supplementary Figures S6–S8) (N = 15).
In this study, we plated fibroblasts in circular-shaped patterns of different diameters. Fibronectin and collagen I used for surface coating differently affect the efficiency of cell patterning. Both proteins are commonly used to ameliorate cell adhesion in cell culture dishes, and they are both abundant in the fibroblast environment; however, the suitability of one over the other may vary on the cell type ([31,32]). Fibroblasts are a cell type that synthesizes ECM and collagen; therefore, it would have been expected to have a better affinity to collagen coating. In addition, collagen deposition by fibroblasts takes place with the help of fibronectin. Fibronectin was also observed to be associated with the deposition of new collagen fibrils. Therefore, it appears that fibronectin promotes cell attachment to collagen filaments, supporting the idea that fibroblasts have a higher affinity for fibronectin than for collagen coatings. Accordingly, if we compare the pattern efficiency between both proteins, fibroblasts presented better predilection to adhere to fibronectin than collagen. Another possible explanation could be that animal origin of the proteins may also influence cell attachment. We used bovine fibronectin and rat collagen I; therefore, the animal origin of the proteins may decant and influence the adherence of the fibroblasts, in our case preferring bovine fibronectin to collagen. Mechanical and rheological properties of cells under the different conditions were correlated with fluorescent images, in which actin fibers, vimentin, and nucleus were stained. Control fibroblasts displayed an increase in elasticity with increasing circle diameter. This behavior was linked to an increase in actin filament formation and a change in organization, since they presented better-developed actin filaments at the maximum circle diameter (45 µm) (Figure 2). It is visible how actin filaments accumulate in the outer circle that is the fibronectin-coated area, which seems to stimulate actin fiber formation. Interestingly, control fibroblasts showed a branching actin meshwork, randomly distributed alongside the cell body without any orientation at the smallest circular-shaped pattern. Nevertheless, actin filaments in both radial and concentric directions started to appear at the intermediate and larger patterns (35 and 45 µm in diameter). These filaments mimic the circumference of the pattern, and radial filaments connect the cell periphery with the cell body cytoskeleton. Song et al. reported similar results in mesenchymal stem cells (MSCs), suggesting that cell spreading is a significant parameter in cytoskeleton development and therefore in a cell mechanical state [33,34]. Variations in mechanical properties and cytoskeleton organization and distribution were followed with changes in cell height. We observed a decrease in cell height with increasing pattern diameter. In flat cell culture dishes, control fibroblasts were seen to be smaller in spreading than pathological fibroblasts; therefore, the decrease in height with the increase in the circle diameter may suggest an attempt to cover the entire area but sacrificing cell thickness. This behavior of control fibroblasts might simulate a transition toward a myofibroblast phenotype, similar to the wound closure process. Cell spreading increases cytoskeletal contractility that may activate fibroblast to myofibroblast differentiation due to the changes in force/tension in the cell interior. Additionally, the crowding of thicker actin filaments at the edge is a phenomenon that occurs when cells are maximizing their spreading. Myofibroblasts are differentiated fibroblasts that help in wound closure. When a wound appears, fibroblasts from the vicinity move to the affected area and acquire bundles of microfilaments formed by β- and γ-cytoplasmic actin; these cells are named proto-myofibroblasts. The latter evolve into α-smooth muscle actin (SMA)-positive fibroblasts called differentiated myofibroblasts that are responsible for wound contraction. The activation of the myofibroblast phenotype is diverse, but one of the most common mechanisms is through the activation of latent transforming growth factor (TGF) β-1. The force exerted by this extra actin fibers can be transmitted to the ECM via integrins that activates TGFβ-1 leading to an ECM straining that produces a feedback mechanism, preserving cell–ECM contraction [35,36]. We suggest that a similar mechanism may be occurring to control fibroblasts when decreasing cell constraint. Fibroblasts try to adapt their shape to the geometric size, developing extra cytoskeletal fibers to reach the new spreading area, leading to an increasing cell contraction. Control fibroblasts may feel a similar situation to that in wound closure. There is a gap that they need to fill and close—increased circle dimensions—thus they might need to ameliorate their cytoskeleton, increasing cell contraction. Hence, not only biochemical changes regulate cell fate, but also physical changes modulate cell behavior. Similar results were found in MSC patterned on different circular-shaped patterns. An increase in the spreading area—circle diameter—favored osteogenic differentiation due to an increase in cytoskeletal contractility [37]. Scar and Dupuytren cells did not experience the same behavior as control fibroblasts when increasing the pattern diameter. Dupuytren fibroblasts did not change either their stiffness or height, which may denote that they are less affected by physical changes in the surrounding environment than control counterparts. They expressed a bunch of thick actin fibers regardless of the circular-shaped constraints, showing an accumulation of actin filaments at the lowest spreading area that they dispersed, reorganized, and even developed at a higher circle diameter. Scar fibroblasts presented an intermediate behavior between the other two cell types. Low accumulation and organization of actin filaments can be seen in the cell body when plated in the smallest circular pattern (25 µm in diameter), which is close in relation to control fibroblast behavior. These observations bring together values of apparent Young’s modulus similar to control fibroblasts seeded in 25-µm circles. Scar fibroblasts are an interesting cell type having intermediate characteristics between control and pathological fibroblasts and can be a key point to understand fibroblast-to-myofibroblast transition and Dupuytren’s disorder. However, as the pattern diameter increases, scar fibroblast behavior leans toward more pathological phenotype, displaying constant mechanical properties at the intermediate and big circle pattern. A huge bunch of actin filaments fills cell body, accumulating more fibers in the lamellipodia and increasing cytoskeleton fiber organization as the spreading area increases. We have seen that control fibroblasts reduce their height with increasing pattern diameter; however, scar and Dupuytren fibroblasts conserve their height regardless of the circle diameter. From the xz projection images, we estimated a relative number for cell volume, leading to an increase in cell volume with increasing circle diameter regardless of the cell type (Supplementary Figure S13). The volume increase in scar and Dupuytren fibroblasts could be understood as maintaining the height with increasing spreading area, and this could lead to an increase in cell volume. Nevertheless, control fibroblasts also experienced an increase in volume. We attribute these findings to a more homogeneous cell covering of the pattern, also reaching constant height overall pattern (Supplementary Figure S14). An increase in cell volume with an increase in the spreading area may be linked to migration and invasion processes. Similar results were found in single monitored glioma cells, in which changes in cell volume were connected to invasiveness and migration properties [38]. Rheological properties of the cells were extracted from the sweep frequency data, and the power law structural damping model was used to analyze it. We measured the complex elastic modulus using AFM over three frequency decades (1 Hz–1 kHz); however, the data were analyzed until 130 Hz due to piezo limitation of our instrument. The cell culture medium exhibits a pure viscous behavior; therefore, the hydrodynamic viscous drag force on the cantilever overestimates the loss modulus. For that reason, viscous drag was corrected calculating the b factor at a distance zero (b (0)) from the sample. The estimation of b (0) was performed following the [24] procedure. The cantilever was oscillated at low amplitude (50 nm) at different frequencies (1 Hz–1 kHz) and at different tip-sample distances (0–5 µm). Frequency dependence of storage and loss moduli showed an increase in the storage modulus over frequency in all cases (Supplementary Figure S4); the loss modulus also increased over frequency, even after viscous drag correction; nonetheless, it increases with a more marked frequency dependence at higher frequencies. This loss modulus increase over frequency may be linked with micro- and macromolecule friction differences with cell’s cytosol. The exponent and loss tangent are related parameters; therefore, similar values and distribution are expected. The decrease in the exponent and loss tangent with increasing pattern diameter in control fibroblasts is understood in terms of cytoskeleton development, which provides the cell with more elastic components (actin filaments), which is known as an increase in the solid-like behavior. Experiments exposing cells upon cytoskeleton disruption, like lantrunculin-A and blebbistatin, showed an increase in the exponent and loss tangent, together with a decrease in the storage modulus and increase in the loss modulus, corroborating the cytoskeleton contribution to cell elasticity [39]. The exponent values of Dupuytren and scar fibroblasts (0.15 and 0.2, respectively) are in agreement with previous studies on human alveolar and bronchial epithelial cells, as well as 3T3 fibroblasts [25,39]. Similar experiments using oscillatory modulation schemes have reported the appearance of two power law exponents instead of one. Those experiments used a higher frequency range than that in our experimental setup, ranging from 1 Hz to 100 kHz. Thanks to this frequency widening, data suggested the existence of two regimes: one at low frequencies with a weak power law and the second at high frequencies with stronger power laws. This methodology may provide extra information about cell’s dynamics and single filament dynamics; however, we were limited by our piezo response and cantilever resonance frequency, reaching frequencies up to 100 Hz. In addition, there are many others models, instead of the structural damping model, to analyze viscoelastic behavior of samples. Those models consist of a combination of springs and dashpots in such a way to describe real viscoelastic behavior. A viscoelastic liquid can be represented by Maxwell model, which consists of a spring and dashpot connected in series. This model predicts that storage and loss moduli vary with frequency and at higher frequencies the storage modulus is larger than the loss modulus; therefore, solid-like behavior predominates, while at lower frequencies the situation is opposite. This model does not fit our data; therefore, it is not a suitable model to describe our samples. The Kelvin–Voigt model, suggested for viscoelastic solids, is a combination of a spring and dashpot but connected in parallel. In this case, the storage modulus is frequency-independent and constant, and the loss modulus increases linearly with frequency. None of these statements are followed in our samples, in which both storage and loss moduli are frequency-dependent and the loss modulus does not increase linearly with frequency. Single power law fit to storage and loss moduli was used to validate structural damping model employment (Supplementary Figure S15). We obtained one different exponent for each modulus (storage exponent: 0.115 and loss exponent: 0.224); nevertheless, it is clearly visible that the loss modulus does not follow a single power law; in any case, multiple power law fits may better describe loss modulus behavior over frequency. However, we have seen that the structural damping model fits our data appropriately and suggests a storage modulus that increases for all frequencies according to a power law exponent and a loss modulus that includes a component of the storage modulus (loss tangent) and scale with the same power law ([23,40]). Another interesting model used to describe viscoelastic behavior is the Burgers model, which is basically a Maxwell and Kelvin–Voigt model connected in series. This model provides a viscoelastic spectrum for an entangled polymer system over a wide frequency range, but in some cases, it is not possible to observe a part of the spectrum depending on the instrumentation limitations. In our case, again AFM piezo and cantilever response limit the employment of this model ([26,41,42]).
Previous studies, in which circular-shaped patterns were utilized, all circle interior was covered with some adherent protein favoring cell attachment [33]. In our work, we discussed circular patterns; however, a better description would be a ring-shaped pattern because only a ring profile is filled with fibronectin and the center of the circle is coated with the antifouling PLL-PEG. Thanks to this shape, we have seen that cells tended to touch only the fibronectin area, leading to an interesting actin filament distribution and organization. In particular, in cells patterned in the 35- and 45-µm-diameter circles, concentric and radial actin filaments are visible mimicking the ring-shaped, otherwise the cell body seemed to be detached or not interacting with the centric area, leading to a weak distribution of actin filaments with no specific orientation and organization. Accordingly, pattern coating with an optimal selection of an ECM protein appears to be indispensable for optimizing cell patterning as well as for driving cell cytoskeleton organization and thus cell mechanical properties.
In this work, fibroblasts from the Dupuytren’s disorder were confined in circular-shaped patterns of three different sizes (25, 35 and 45 µm diameter). We compared mechanical properties of control fibroblasts, scar fibroblasts from a wounded area and pathological fibroblasts, and Dupuytren fibroblasts, using the AFM. PFQNM cantilevers probed the cells over the nucleus area, and the apparent Young’s modulus from the approach curve showed that control fibroblasts stiffen when increasing the pattern diameter. This behavior may simulate a fibroblast transition toward the myofibroblast phenotype, owing to an increase in cortical tension inside the cell body. Rheological properties, represented as the loss tangent and power law exponent parameters, corroborated an increase in solid-like behavior as the pattern dimension increases. Scar and Dupuytren fibroblasts maintain their stiffness regardless of the pattern diameter, suggesting that they appear to be less affected in cell rheological properties by changes in adhesive contact areas in the environment, adapting their body to the patterns’ geometry. The fibronectin-coated area supported cell adhesion to the substrate and cytoskeleton formation; however, the central area of the circle, which was covered with PLL-PEG, forbade cell attachment and cytoskeleton development. These experiments suggest that micropatterning is a valuable approach to study cell mechanics, as it diminishes cell morphology variability and limits cells’ free spreading as well as allows combination with other methodologies, such as AFM measurements.
The original contributions presented in the study are included in the article/Supplementary Material; further inquiries can be directed to the corresponding author.
The studies involving human participants were reviewed and approved by the Local Ethics Committee (Ärztekammer Bremen, #336/2012) and was conducted in accordance with the Declaration of Helsinki. Patient was informed pre-operatively and had given its informed consent to anonymous tissue donation.
SP-D designed the research and performed AFM experiments, pattern preparation, confocal experiments, data analysis, and manuscript preparation. EW performed confocal experiments and contributed to manuscript preparation. VD performed pattern preparation and contributed to manuscript preparation. MLM, SJ, and FL contributed to the preparation of the manuscript. MR designed the experimental setting and contributed to data analysis and preparation of the manuscript.
This project was funded by the H2020 European Research and Innovation Programme under the Marie Skłodowska-Curie grant agreement “Phys2BioMed” contract no. 812772.
The authors thank Prof. Dr. Ursula Mirastschijski for kindly providing tissue samples and Prof. Dr. Gazanfer Belge for establishing cell lines from primary cells. The authors thank the members of the Institute Pasteur Lille for making their facilities available and for their help and support during the visit. The authors thank Dr. Lorena Redondo, Dr. Fabio Perissinotto, and Javier Lopez-Alonso for their help and support. The authors acknowledge the support of the European Union's Horizon 2020 Research and Innovation Programme under the Marie Sklodowska-Curie grant agreement no. 812772, Project Phys2BioMed.
The authors declare that the research was conducted in the absence of any commercial or financial relationships that could be construed as a potential conflict of interest.
All claims expressed in this article are solely those of the authors and do not necessarily represent those of their affiliated organizations, or those of the publisher, the editors, and the reviewers. Any product that may be evaluated in this article, or claim that may be made by its manufacturer, is not guaranteed or endorsed by the publisher.
The Supplementary Material for this article can be found online at: https://www.frontiersin.org/articles/10.3389/fphy.2022.1052203/full#supplementary-material
Supplementary Figure S13 | Estimation of relative cells volume from the xz projections from the fluorescent images. The dots represent the mean with the standard deviation (N = 4). The circles next to each mean value correspond to the individual measurements.
Supplementary Video S1 | Control fibroblast on a 25-μm-diameter circle.
Supplementary Video S2 | Control fibroblast on a 35-μm-diameter circle.
Supplementary Video S3 | Control fibroblast on a 45-μm-diameter circle.
Supplementary Video S4 | Scar fibroblast on a 25-μm-diameter circle.
Supplementary Video S5 | Scar fibroblast on a 35-μm-diameter circle.
Supplementary Video S6 | Scar fibroblast on a 45-μm-diameter circle.
Supplementary Video S7 | Dupuytren fibroblast on a 25-μm-diameter circle.
Supplementary Video S8 | Dupuytren fibroblast on a 35-μm-diameter circle.
Supplementary Video S9 | Dupuytren fibroblast on a 45-μm-diameter circle.
1. Deng L, Trepat X, Butler JP, Millet E, Morgan KG, Weitz DA, et al. Fast and slow dynamics of the cytoskeleton. Nat Mater (2006) 5:636–40. doi:10.1038/nmat1685
2. Yamaguchi H, Condeelis J. Regulation of the actin cytoskeleton in cancer cell migration and invasion. Biochim Biophys Acta (2007) 1773:64252. doi:10.1016/j.bbamcr.2006.07.001
3. Fletcher DA, Mullins RD. Cell mechanics and the cytoskeleton. Nature (2010) 463:485–92. doi:10.1038/nature08908
4. Radmacher M. Measuring the elastic properties of biological samples with the AFM. IEEE Eng Med Biol Mag (1997) 16:47–57. doi:10.1109/51.582176
5. Lekka M, Laidler P, Gil D, Lekki J, Stachura Z, Hrynkiewicz AZ. Elasticity of normal and cancerous human bladder cells studied by scanning force microscopy. Eur Biophys J (1999) 28:312–6. doi:10.1007/s002490050213
6. Rianna C, Radmacher M. Comparison of viscoelastic properties of cancer and normal thyroid cells on different stiffness substrates. Eur Biophys J (2016) 46:309–24. doi:10.1007/s00249-016-1168-4
7. McKenzie AJ, Hicks SR, Svec KV, Naughton H, Edmunds ZL, Howe AK. The mechanical microenvironment regulates ovarian cancer cell morphology, migration, and spheroid disaggregation. Sci Rep (2018) 8:7228. doi:10.1038/s41598-018-25589-0
8. Bohnet S, Ananthakrishnan R, Mogilner A, Meister JJ, Verkhovsky AB. Weak force stalls protrusion at the leading edge of the lamellipodium. Biophys J (2006) 90:1810–20. doi:10.1529/biophysj.105.064600
9. Rigato A, Rico F, Eghiaian F, Piel M, Scheuring S. Atomic force microscopy mechanical mapping of micropatterned cells shows adhesion geometry-dependent mechanical response on local and global scales. ACS Nano (2015) 9(6):5846–56. doi:10.1021/acsnano.5b00430
10. Mi Y, Chan Y, Trau D, Huang P, Chen E. Micromolding of pdms scaffolds and microwells for tissue culture and cell patterning: A new method of microfabrication by the self-assembled micropatterns of diblock copolymer micelles. Polymer (2006) 47:5124–30. doi:10.1016/j.polymer.2006.04.063
11. Rianna C, Radmacher M, Kumar S. Direct evidence that tumor cells soften when navigating confined spaces. MBoC (2020) 31:1726–34. doi:10.1091/mbc.E19-10-0588
12. James J, Goluch ED, Hu H, Liu C, Mrksich M. Subcellular curvature at the perimeter of micropatterned cells influences lamellipodial distribution and cell polarity. Cell Motil Cytoskeleton (2008) 65:841–52. doi:10.1002/cm.20305
13. Théry M, Pepin A, Dressaire E, Chen Y, Bornens M. Cell distribution of stress fibres in response to the geometry of the adhesive environment. Cel Motil Cytoskeleton (2006) 63:341–55. doi:10.1002/cm.20126
14. Parker KK, Brock AL, Brangwynne C, Mannix RJ, Wang N, Ostuni E, et al. Directional control of lamellipodia extension by constraining cell shape and orienting cell tractional forces. FASEB J (2002) 16:1195–204. doi:10.1096/fj.02-0038com
15. Brock A, Chang E, Ho CC, LeDuc P, Jiang X, Whitesides GM, et al. Geometric determinants of directional cell motility revealed using microcontact printing. Langmuir (2003) 19:1611–7. doi:10.1021/la026394k
16. Liu Y, Mu L, Liu B, Kong J. Controlled switchable surface. Chem Eur J (2005) 11:2622–31. doi:10.1002/chem.200400931
17. Nakanishi J, Takarada T, Yamaguchi K, Maeda M. Recent advances in cell micropatterning techniques for bioanalytical and biomedical sciences. Anal Sci (2008) 24:67–72. doi:10.2116/analsci.24.67
18. Jiang X., Bruzewicz D. A., Wong A. P., Piel M., Whitesides G. M. Directing cell migration with asymmetric micropatterns. Proc. Natl. Acad. Sci. (2005) 102:975–8. doi:10.1073/pnas.0408954102
19. Azioune A., Carpi N., Tseng Q., Théry M., Piel M. Protein micropatterns. A direct printing protocol using deep UVs. Methods Cel Biol (2010) 97:133–46. doi:10.1016/S0091-679X(10)97008-8
20. Hecht FM, Rheinlaender J, Schierbaum N, Goldmann WH, Fabry B, Schaffer TE. Imaging viscoelastic properties of live cells by AFM: Power-law rheology on the nanoscale. Soft Matter (2015) 11:4584–91. doi:10.1039/c4sm02718c
21. Hertz H. Ueber die Berührung fester elastischer Körper. J. Reine Angew. Mathematik (1882) 92:156–71. doi:10.1515/crll.1882.92.156
22. Hildebrandt J. Comparison of mathematical models for cat lung and viscoelastic balloon derived by Laplace transform methods from pressure-volume data. Bull Math Biophys (1969) 31:651–67. doi:10.1007/BF02477779
23. Fabry B, Maksym GN, Butler JP, Glogauer M, Navajas D, Fredberg JJ. Scaling the microrheology of living cells. Phys Rev Lett (2001) 87:148102. doi:10.1103/PhysRevLett.87.148102
24. Alcaraz J, Buscemi L, Puig-de-Morales M, Colchero J, Baro A, Navajas D. Correction of microrheological measurements of soft samples with atomic force microscopy for the hydrodynamic drag on the cantilever. Langmuir (2002) 18:716–21. doi:10.1021/la0110850
25. Alcaraz J, Buscemi L, Grabulosa M, Trepat X, Fabry B, Farre R, et al. Microrheology of human lung epithelial cells measured by atomic force microscopy. Biophys J (2003) 84:2071–9. doi:10.1016/S0006-3495(03)75014-0
26. Malverns Instruments. Rheology and viscosity: A basic introduction to rheology (2016). Whitepaper (Spectris plc) Available at: https://cdn.technologynetworks.com/TN/Resources/PDF/WP160620BasicIntroRheology.pdf.
27. Sayadi LR, Alhunayan D, Sarantopoulos N, Kong C, Condamoor S, Sayadi J, et al. The molecular pathogenesis of dupuytren disease. Ann Plast Surg (2019) 83:594–600. doi:10.1097/SAP.0000000000001918
28. Viji Babu PK, Rianna C, Belge G, Mirastschijski U, Radmacher M. Mechanical and migratory properties of normal, scar, and Dupuytren’s fibroblasts. J Mol Recognit (2018) 31:e2719. doi:10.1002/jmr.2719
29. Hiratsuka S, Mizutani Y, Tsuchiya M, Kawahara K, Tokumoto H, Okajima T. The number distribution of complex shear modulus of single cells measured by atomic force microscopy. Ultramicroscopy (2009) 109:937–41. doi:10.1016/j.ultramic.2009.03.008
30. Rother J, Noding H, Mey I, Janshoff A. Atomic force microscopy-based microrheology reveals significant differences in the viscoelastic response between malign and benign cell lines. Open Biol (2014) 4:140046. doi:10.1098/rsob.140046
31. Lacouture ME, Schaffer JL, Klickstein LB. A comparison of type I collagen, fibronectin, and vitronectin in supporting adhesion of mechanically strained osteoblasts. J Bone Miner Res (2009) 17:481–92. doi:10.1359/jbmr.2002.17.3.481
32. Colombo E, Calcaterra F, Cappelletti M, Mavilio D, Della Bella S. Comparison of fibronectin and collagen in supporting the isolation and expansion of endothelial progenitor cells from human adult peripheral blood. PLOS ONE (2013) 8:e66734. doi:10.1371/journal.pone.0066734
33. Song W, Lu H, Kawazoe N, Chen G. Adipogenic differentiation of individual mesenchymal stem cell on different geometric micropatterns. Langmuir (2011) 27:6155–62. doi:10.1021/la200487w
34. Wang X, Nakamoto T, Dulinska-Molak I, Kawazoe N, Chen G. Regulating the stemness of mesenchymal stem cells by tuning micropattern features. J Mater Chem B (2016) 4:37–45. doi:10.1039/c5tb02215k
35. Hinz B. The myofibroblast: Paradigm for a mechanically active cell. J Biomech (2010) 43:146–55. doi:10.1016/j.jbiomech.2009.09.020
36. Bochaton-Piallat ML, Gabbiani G, Hinz B. The myofibroblast in wound healing and fibrosis: Answered and unanswered questions. F1000Res (2016) 5:752. doi:10.12688/f1000research.8190.1
37. Song W., Kawazoe N., Chen G. Dependence of spreading and differentiation of mesenchymal stem cells on micropatterned surface area. J Nanomater (2011) 2011:1–9. doi:10.1155/2011/265251
38. Watkins S, Sontheimer H. Hydrodynamic cellular volume changes enable glioma cell invasion. J Neurosci (2011) 31(47):17250–9. doi:10.1523/JNEUROSCI.3938-11.2011
39. Rigato A, Miyagi A, Scheuring S, Rico F. High-frequency microrheology reveals cytoskeleton dynamics in living cells. Nat Phys (2017) 13:771–5. doi:10.1038/nphys4104
40. Fabry B, Maksym GN, Butler JP, Glogauer M, Navajas D, Taback NA, et al. Time scale and other invariants of integrative mechanical behavior in living cells. Phys Rev E (2003) 68:041914. doi:10.1103/PhysRevE.68.041914
41. Pajic-Lijakovic I, Milivojevic M. Jamming state transition and collective cell migration. J Biol Eng (2019) 13:73. doi:10.1186/s13036-019-0201-4
Keywords: AFM, Dupuytren’s disease, micropatterning, viscoelasticity, fibroblast
Citation: Pérez-Domínguez S, Werkmeister E, Marini ML, Dupres V, Janel S, Lafont F and Radmacher M (2022) Rheological comparison between control and Dupuytren fibroblasts when plated in circular micropatterns using atomic force microscopy. Front. Phys. 10:1052203. doi: 10.3389/fphy.2022.1052203
Received: 23 September 2022; Accepted: 04 November 2022;
Published: 22 November 2022.
Edited by:
Ivana Dusan Pajic-Lijakovic, University of Belgrade, SerbiaReviewed by:
Johannes Rheinlaender, University of Tübingen, GermanyCopyright © 2022 Pérez-Domínguez, Werkmeister, Marini, Dupres, Janel, Lafont and Radmacher. This is an open-access article distributed under the terms of the Creative Commons Attribution License (CC BY). The use, distribution or reproduction in other forums is permitted, provided the original author(s) and the copyright owner(s) are credited and that the original publication in this journal is cited, in accordance with accepted academic practice. No use, distribution or reproduction is permitted which does not comply with these terms.
*Correspondence: Manfred Radmacher, cmFkbWFjaGVyQHVuaS1icmVtZW4uZGU=
Disclaimer: All claims expressed in this article are solely those of the authors and do not necessarily represent those of their affiliated organizations, or those of the publisher, the editors and the reviewers. Any product that may be evaluated in this article or claim that may be made by its manufacturer is not guaranteed or endorsed by the publisher.
Research integrity at Frontiers
Learn more about the work of our research integrity team to safeguard the quality of each article we publish.