- 1Changchun Institute of Optics, Fine Mechanics and Physics, Chinese Academy of Sciences (CAS), Changchun, China
- 2School of Optoelectronic Engineering, Xidian University, Xi'an, China
An algorithm to calculate the flat-field coefficient based on the series of rotated images captured by the solar X-ray and Extreme Ultraviolet Imager (X-EUVI) onboard the Fengyun-3E satellite is proposed in this article. The method includes determination of the solar disk centers and radiuses, calculation of the rotation angles, coordinate transformation to expand the solar disk into rectangles, and derivation of the flat matrix using the KLL algorithm. The accuracy of determination of the solar disk center and radius tested by the Hough gradient method and the least-squares method is at sub-pixel, and the precision of the calculated rotation angle based on the log-polar transform is less than 0.025°. Since the X-EUVI rotates relative to the Sun in real time, multiple rotating images can be obtained and used for flat-field calibration at any time, and the tested accuracy is estimated at 0.79–3.42%. This flat-field method will provide reference and support for solar image processing and research.
1 Introduction
The solar X-ray and Extreme Ultraviolet Imager (X-EUVI) are the first space solar observation equipment working in EUV and X-ray bands in China, which are loaded on the FY-3E satellite and rotating relative to the sun [1–4]. This article will expound how to use the solar rotation images observed by X-EUVI to calculate the flat field.
The flat field is the characterization of the non-uniformity of the response of the optical system to the incident light. The uneven responses may come from the inconsistency of the digital semiconductor detector pixels such as the charge-coupled device (CCD) and complementary metal-oxide semiconductor (CMOS), filters, reflector, and the mechanical structure. The observed images need to correct the non-uniformity of the detector response using the flat-field matrix to obtain the real observation image. Generally, the flat-field correction coefficient can be obtained by fitting the images observed under a uniform light source or stable light source with different exposure times.
However, sometimes both the uniform light source and the stable light source are difficult to obtain. In 1991, Kuhn et al proposed a method (KLL algorithm) to obtain a flat field by using relatively stable and non-uniform images [5]. On this basis, Chae improved the algorithm by liberalizing parameters such as solar images, light intensity change, and the flat field in 2004 [6]. The KLL algorithm calculates the flat field using the solar images obtained at different positions on the detector. This method uses the observed solar image as the light source, by changing the direction of the telescope to obtain multiple solar images at different positions on the CCD or CMOS, and then calculates the flat field using the iterative method. Many instruments adopt the KLL method to derive the flat field, like the ground-based solar telescopes, such as the optical and near-infrared solar telescope (ONSET) [7], the Hα solar telescope of the Great Bear Lake Solar Observatory [8], and space-based solar observation equipment, like the Atmospheric Imaging Assembly (AIA) and the Helioseismic and Magnetic Imager (HMI) carried by the Solar Dynamics Observatory (SDO) [9–11]. Moreover, the solar telescopes with the local field of view also adopt the KLL method, such as the solar interface layer spectrometer (IRIS) and the magnetic field observation on the Great Bear Lake Solar Observatory [12, 13].
The FY-3E satellite was launched successfully in July 2021; due to the characteristics of the orbit, the solar images taken by X-EUVI rotate in real time. Combined with the characteristics of the rotated image and the requirements of the KLL algorithm, this article presents a flat-field calculation method based on the rotating image. The algorithm mainly includes determination of the solar disk center, calculation of the rotation angles, coordinate transformation to expand the solar disk into a rectangle, and derivation of the flat matrix using the KLL algorithm.
The article is arranged as follows: the data source and the general information of X-EUVI are introduced in Section 2. In Section 3, the calculation processes of the flat-field method are focused on, and finally, the conclusion, discussion of the results, and the source of error of the algorithm are presented in Section 4.
2 Data sets
Onboard the FY-3E satellite, the X-EUVI was launched in July 2021 successfully. So far, X-EUVI has observed and accumulated a large number of solar X-ray and EUV images. The FY-3E satellite operates in a polar-orbiting sun-synchronous dawn-dusk orbit at an altitude of ∼840 km with ∼99° inclination and with orbital periods near 102 min. X-EUVI tracks and images the sun in real time with the X-ray bands at 0.6–8.0 nm (X1 channel), 0.6–6.0 nm (X2 channel), 0.6–5.0 nm (X3 channel), 0.6–2.0 nm (X4 channel), 0.6–1.6 nm (X5 channel), and 0.6–1.2 nm (X6 channel), and the EUV bands at 19.5 nm. Due to the characteristics of the FY-3E orbit, the satellite rotates at a uniform rate relative to the Sun; therefore, the X-EUVI rotates relative to the Sun in real time; multiple rotating images can be used for flat-field calibration at any time, so that the high-quality solar X-ray and EUV images can be obtained.
3 Methods
The method to calculate the flat field can be divided into four steps, which include determination of the solar disk center, calculation of the rotation angles, coordinate transformation to expand the solar disk into a rectangle, and derivation of the flat matrix using the KLL algorithm. These calculation processes are described in detail.
3.1 Solar disk center
In this section, the Hough gradient method is used to detect the disk circle in the EUV solar image, and then the preliminary coordinates of the disk center and radius are obtained [14]. The optimal disk circle is selected by comparing the coefficient of the radius unit length of each circle. Also, in order to improve the accuracy of the center coordinates and radius, the least-squares method is finally used to realize the accurate fitting at the sub-pixel level. According to the input parameter threshold, the center and radius of the detection circle are screened with the Hough gradient method, and finally, the circle that initially meets the threshold conditions is obtained. The specific steps are as follows:
(1) The disk circle center (a, b) is detected in the solar image
a) The original solar image is processed using CANNY edge detection to get the binary image.
b) The Sobel operator is performed once on the original image to calculate the neighborhood gradient values of all pixels.
c) All disk center accumulators N (a, b) = 0 are initialized.
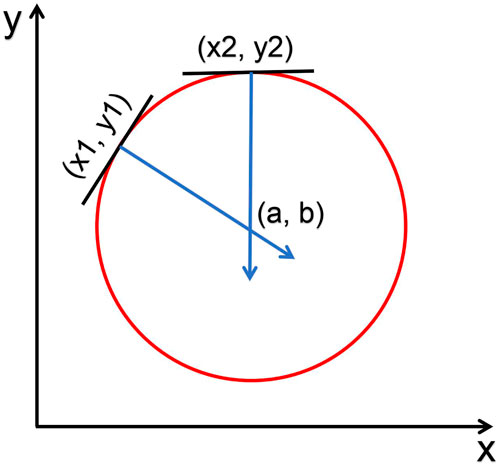
d) All non-zero pixels in the CANNY edge binary graph are tested, as shown in Figure 1. Lines are drawn along the gradient direction of the pixel edge (the vertical direction of the tangent line), and 1 is added to the accumulator of all pixel coordinates (a, b) that the line passes through, that is, N (a, b) = N (a, b) + 1.
e) The N (a, b) are statistically sorted to obtain the possible disk circle center. The greater the N (a, b), the more likely the corresponding pixel (a, b) is to be the center of the circle. If N (a, b) is greater than the threshold T1, then the corresponding pixel (a, b) is determined to be the center of the circle.
(2) For each detected circle center (a, b), the corresponding radius r is calculated.
a) The distance L between all non-zero points and the center (a, b) in the CANNY graph is calculated.
b) The radius accumulator N (L) = 0 is initialized.
c) The non-zero points in the CANNY graph are tested. If the distance from the point to the center is L, then N (L) = N (L) + 1. According to the input radius thresholds Rmin and Rmax, if L is between Rmin and Rmax, then L will be selected as the possible radius r.
d) The accumulator N (R) of all possible radius r is counted to obtain the radius that meets the requirements of the threshold T2. The greater the accumulator N (R), the more likely r is to be the real radius value. According to the definition of the threshold, if N (R) is greater than the threshold, then the R will be determined as the radius of the circle.
Threshold T1 is the high threshold of CANNY edge detection, and the low threshold is automatically set to half of the high threshold. Threshold T2 is the judgment threshold of whether a point on the accumulation plane is the center of the circle. The higher the T2, the closer the detected circle is to the circle. Rmin is the minimum value of the circle, and Rmax is the maximum value of the circle. During the operation of the algorithm, if the distance between the centers of two circles is less than 1, the two circles will be regarded as the same circle.
The unit radius coefficients K = N (r)/r of each circle tested by the Hough gradient method are calculated. The larger the coefficient K value, the more the image edge points in the circle will be contained within the unit radius. Therefore, it is determined that the circle with the largest K value is the best circle in the image. Since the accuracy of the solar disk center tested by the Hough gradient method is ± 1 pixel, the least-squares method to fit the center and radius will be used to further optimize the circle and improve the accuracy of the center and radius to sub-pixel. The least-squares circle fitting method is mainly based on statistics [15]. Even if the edge of the circular target in the image is missing due to the uneven illumination intensity, it will not affect the positioning of the center of the circle and the determination of the radius. Since the edge pixels on the optimal circle are known, the least-squares method can find the best function matching this group of pixels by minimizing the sum of squares of errors and fitting the final sub-pixel radius and circle center. The tested results of this method are shown in Figure 2. This solar EUV image was captured by X-EUVI at 00:02:05 UTC on 5 November 2021, and the red circle was the final determination of the solar disk edge on the CANNY graph.

FIGURE 2. Tested solar image sample. (A) is the original image, (B) is CANNY edge detection, and the red curve in (C) is the optimal circle in the CANNY edge graph.
3.2 Rotation angle
After the location of the image centroid is determined, the rotation angles between the sequence images need to be calculated. The method to calculate the rotation angle is developed from the log-polar transform. The image function in the plane rectangular coordinate system is represented as f (x, y) and it can be represented as f ' (r, θ) after the log-polar transformation. Through the transformation, the rotation transformation in the original image can be expressed as the circular translation along the θ axis direction in the polar coordinate system. The scale transformation in the original image can be expressed as the translation along the r-axis direction in the polar coordinate system. The log-polar transformation is often used to extract the rotation angle and the scale features in image matching. The processes are divided into three steps including extracting rays from the center of the image, calculating the sum of the gray values along the ray to obtain the polar gray curve, and determining the rotation angle between the sequence images based on two curves using the correlation algorithm [16, 17].
In Figure 3, the solar images were captured by X-EUVI on 5 November 2021: the time of 3a is 00:00:03 UTC, the time of 3b is 00:02:05 UTC, and the time of 3c is 00:04:06 UTC. Due to the instrument rotating around the earth with the satellite, there are rotation angles which exist between these three images. The gray curves of Figure 3 are given in Figure 4. The black curve corresponds to Figure 3A, the blue curve corresponds to Figure 3B, and the red curve corresponds to Figure 3C. The rotation angles calculated by the relevant algorithm are 7.200° between 3a and 3b and 7.200° between 3b and 3c. It is assumed that the sun is basically stable in the exposure time, and this assumption is reasonable because the time interval between two successive images is actually ∼10s.
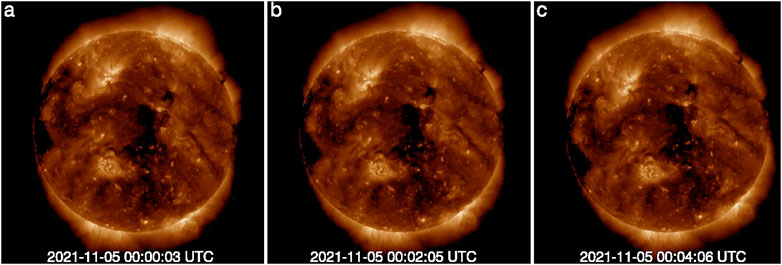
FIGURE 3. Solar images in 19.5 nm observed by X-EUVI on 5 November 2021. The time of 3a is 00:00:03 UTC, the time of 3b is 00:02:05 UTC, and the time of 3c is 00:04:06 UTC.
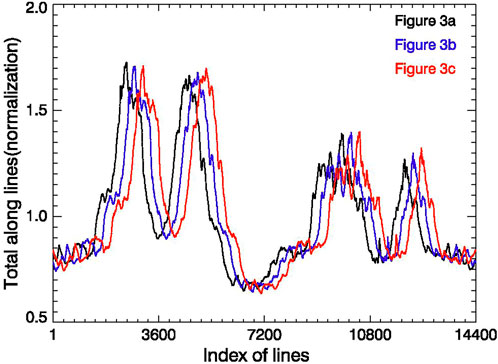
FIGURE 4. Gray curves of Figure 3. The black curve corresponds to Figure 3A, the blue curve corresponds to Figure 3B, and the red curve corresponds to Figure 3C. The abscissa represents the serial number of the line, and the ordinate represents the sum of gray values along the line.
The experimental results show that the extraction accuracy of the algorithm is related to the number of lines from the image center. The higher the extraction accuracy, the more lines are set. In this article, the number of lines is selected as 14,400, and it can ensure that the error of the calculated rotation angle is less than 0.025°.
3.3 Coordinate transformation and the KLL algorithm
After the solar image centers are determined, the Cartesian coordinate system is established with the center as the origin, and then, the solar images are expanded into rectangular shapes, as shown in Figure 5. The rotation angles of the images are converted into the translations in the X-direction in the rectangular images, and the displacements in the Y-direction are zero. Then, a series of expanded rectangular solar images and the corresponding rotation angles can be used to calculate the flat-field matrix.
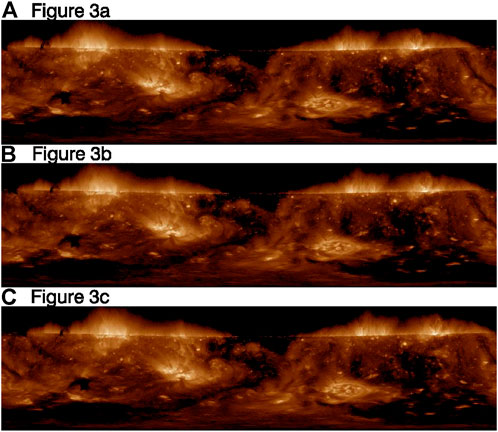
FIGURE 5. Solar images are in rectangular shape and, the original images are in Figure 3A, Figure 3B, and Figure 3C.
The KLL algorithm is used to calibrate the spatial nonuniformity of an image-array based on a series of offset images, and the algorithm is robust and efficiently uses information from multiple data frames to determine pixel gain variations. Space-based solar observation instruments usually utilize the KLL algorithm to carry out flat-field calibration in orbit. The KLL algorithm does not rely on experimental equipment and directly uses the offset images to calculate the flat-field matrix of the imagers, which is widely used in SDO/AIA, SOHO/EIT, and other instruments.
It is assumed that the image-array detector can be calculated as a system, whose response is independent of the input intensity of the object, while depending on the optical sensitivity differences of each pixel element.
Here, r and o are the actual inhomogeneous response and intensity of the object, respectively. F is the gain at an appointed position x.
We can also assume that the intensity of the object is stable and invariant when we take a series of shifted image samples. Let R(x) = ln (r(x)) and F(x) = ln (f(x)). The relationship between the gray value and response of each pixel in two images is given as formula (2), where displacements are described by ai and aj.
We can calculate a least-squares solution for the distribution of the gain if we build an oversampled, over-determined linear equation set about r(x).
Differentiating Eq. 3 with F(x) and setting the initial solution F0(x) = 0, we arrived at an iterative solution:
where
This is the form of a solution to Poisson’s equation. n(x) counts the number that contributes to the sum. This model is useful where other models fail, especially when we cannot offer a proper uniform target in a short wavelength. Yet, the limitation is that the accuracy of the edge is too low to be accepted because of the internal vignetting and the boundary extraction process. That is why we proposed our method. The approximate optimal solution of this least-squares method is not unique. In order to avoid contingency and to improve credibility, the calibration result takes the average of multiple sets of data.
The FY-3E satellite rotates relative to the Sun, and the solar images taken by X-EUVI are also rotated relative to the center of the field of view. Also, since the temporal resolution of X-EUVI is less than 10 s, it is reasonable to assume that the morphological features of the two adjacent solar images remain unchanged during the calculation; thus, only translation and rotation exist. Because of the characteristics of FY-3E satellite orbit, the solar images observed by X-EUVI are continually rotating, and the imager’s flat-field matrix can be acquired at any time when the instrument is working. The flat-field matrix, the original solar image, and the corrected image using the flat-field matrix are shown in Figure 6. Figure 7 shows the flat-field coefficients’ variation and the comparison of the gray values before and after flat.
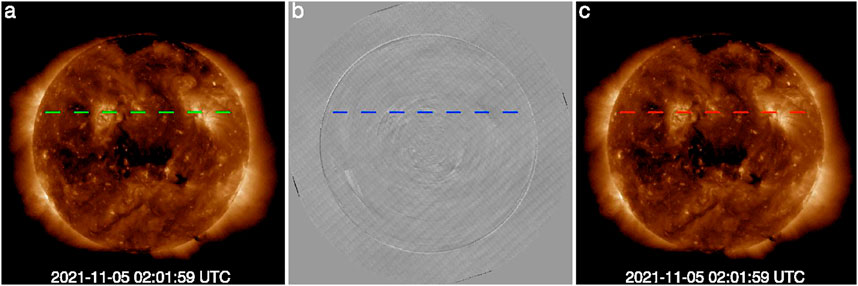
FIGURE 6. Original solar image (A), flat-field matrix (B), and the corrected image (C). The solar image was captured by X-EUVI at 02: 01 on 05 November 2021.
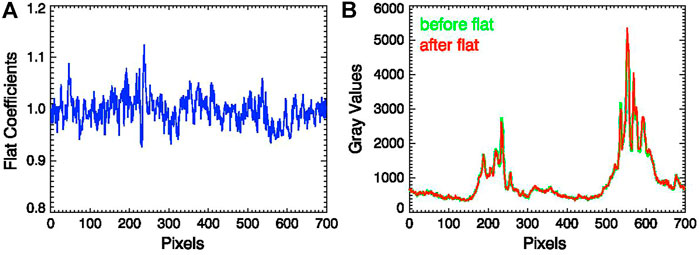
FIGURE 7. (A) is the flat-field coefficient along the blue line in Figure 6B. (B) is the comparison of the gray values along the green line in Figure 6A and the red line in Figure 6C.
4 Conclusion and discussion
The algorithm proposed in this article is used to calculate the flat field using the rotated solar EUV images from FY-3E/X-EUVI. The algorithm includes determination of the solar disk centers and radiuses, calculation of the rotation angles, coordinate transformation to expand the solar disk into rectangles, and derivation of the flat matrix using the KLL algorithm. The accuracy of the determination of the solar disk center tested by the Hough gradient method and the least-squares method is at sub-pixel, and the precision of the calculated rotation angle based on the log-polar transform is less than 0.025°. Since the X-EUVI rotates relative to the Sun in real time, multiple rotation images can be obtained and used for flat-field calibration at any time. Using this method, five flat fields were calculated to estimate the accuracy. The five flats were calculated using 61 rotated solar images that were obtained on September 23, September 29, October 2, October 4, and October 8 in 2021. The accuracy is (0.79–3.42) % estimated by the following method.
(1) Calculate the mean values and standard deviations of each pixel (five flats).
(2) Divide the standard deviation by the mean values to obtain a matrix (A).
(3) Calculate the mean value (B) and standard deviation (C) of matrix A.
(4) The accuracy of the flat can be estimated to be (B ± C) %.
The Sun is assumed to be stable in the calculation process of using a series of rotated images, but the solar radiation in the extreme ultraviolet band changes rapidly, so this assumption will introduce some errors. The calculated solar center still introduces errors to the final result since it is still difficult to determine the disk and the center of the EUV solar image due to the influence of the solar atmosphere. Moreover, the calculation of the rotation angle and the error of the KLL algorithm itself can introduce error in the final flat field.
Data availability statement
Publicly available datasets were analyzed in this study. These data can be found here: http://data.nsmc.org.cn/portalsite/default.aspx.
Author contributions
GD and LH contributed to the idea, method, and calculation of the flat-field method. GD and KW wrote the manuscript. BC contributed to the design of the X-EUVI and its observation and modified the writing. FL checked the algorithm program.
Funding
This work was supported by the National Science Foundation of China (Grant No. 42104166).
Acknowledgments
The authors would like to thank the X-ray and EUV optical technology laboratory in the Changchun Institute of Optics, Fine Mechanics and Physics (CIOMP) for supporting this research. Meanwhile, we would like to thank the ground application system at the National Satellite Meteorological Center, China Meteorological Administration (NSMC, CMA) for providing the X-EUVI raw data.
Conflict of interest
The authors declare that the research was conducted in the absence of any commercial or financial relationships that could be construed as a potential conflict of interest.
Publisher’s note
All claims expressed in this article are solely those of the authors and do not necessarily represent those of their affiliated organizations, or those of the publisher, the editors, and the reviewers. Any product that may be evaluated in this article, or claim that may be made by its manufacturer, is not guaranteed or endorsed by the publisher.
References
1. Chen B, Ding GX, He LP. Solar X-ray and extreme ultraviolet imager(X-EUVI) loaded onto China’s fengyun-3E satellite. Light: Sci Appl (2022) 11:29. doi:10.1038/s41377-022-00711-0
2. Zhang P, Hu XQ, Lu QF, Zhu AJ, Lin MY, Sun L, et al. FY-3E: The first operational meteorological satellite mission in an early morning orbit. Adv Atmos Sci (2022) 39(1):8. doi:10.1007/s00376-021-1304-7
3. Chen B, Chen SY, Gong Y. Design of a complex space soft X-ray and EUV telescope. Opt Tech (2004) 30(2):242–4. doi:10.3321/j.issn:1002-1582.2004.02.023
4. Chen B, Liu Z, Yang L, Gao L, He F, Wang XG, et al. Space solar telescope in soft X-ray and EUV band. Sci China Ser G Phys Mech Astron (2009) 52:1806–9. doi:10.1007/s11433-009-0250-7
5. Kuhn KR, Lin H, Loranz D. Gain Calibrating nonuniform image-array data using only the image data. Publications Astronomical Soc Pac (1991) 103:1097–108. doi:10.1086/132932
6. Chae J. Flat-Fielding of Solar Hα Observations using relativity shifted images. Solar Phys (2004) 221(1):1–14. doi:10.1023/B:SOLA.0000033357.72303.89
7. Fang C, Chen PF, Li Z, Ding MD, Dai Y, Zhang XY, et al. A new multi-wavelength solar telescope: Optical and near-infrared solar eruption tracer (ONSET). Res Astron. Astrophys. (2013) 13. doi:10.1088/1674-4527/13/12/011
8. Denker C, Johannesson A, Marquette W, Goode PR, Wang H, Zirin H. Synoptic Hα full-disk observations of the sun from big bear solar observatory – I. Instrumentation, image processing, data products, and first results. Solar Phys (1999) 184(1):87–102. doi:10.1023/A:1005047906097
9. Boerner P, Edwards C, Lemen J, Rausch A, Schrijver C, Shine R, et al. Initial calibration of the atmospheric imaging assembly (AIA) on the solar Dynamics observatory (SDO). Solar Phys (2012) 275(1):41–66. doi:10.1007/s11207-011-9804-8
10. Lemen JR, Title AM, Akin DJ, Boerner PF, Chou C, Drake JF, et al. The atmospheric imaging assembly (AIA) on the solar Dynamics observatory. Solar Phys (2012) 275:17. doi:10.1007/s11207-011-9776-8
11. Schou J, Scherrer PH, Bush RI, Wachter R, Couvidat S, Rabello-Soares MC, et al. Design and ground calibration of the helioseismic and magnetic imager (HMI) instrument on the solar Dynamics observatory (SDO). Solar Phys (2012) 275:229. doi:10.1007/s11207-011-9842-2
12. De Pontieu B, Title AM, Lemen JR, Kushner GD, Akin DJ, Allard B, et al. The interface region imaging spectrograph (IRIS). Solar Phys (2014) 289:2733. doi:10.1007/s11207-014-0485-y
13. Chae J. Flat-fielding of solar magnetograph observations using relatively shifted images. Solar Phys (2004) 221(1):15–21. doi:10.1023/B:SOLA.0000033359.96272
14. Djekoune AO, Messaoudi K, Amara K. Incremental circle hough transform: An improved method for circle detection. Optik - Int J Light Electron Opt (2017) 133:17–31. doi:10.1016/j.ijleo.2016.12.064
15. Liu D, Wang YT, Tang Z, Lu XQ. A robust circle detection algorithm based on top-down least-square fitting analysis. Comput Electr Eng (2014) 40(4):1415–28. doi:10.1016/j.compeleceng.2014.03.011
16. Qiao SD, Sampaolo A, Patimisco P, Spagnolo V, Ma YF. Ultra-highly sensitive HCl-LITES sensor based on a low-frequency quartz tuning fork and a fiber-coupled multi-pass cell. Photoacoustics (2022) 27:100381.
Keywords: flat field, solar image, Hough gradient, KLL algorithm, canny operator
Citation: Ding G, Wu K, He L, Chen B and Liu F (2022) The flat-field method based on rotated images for FY-3E/X-EUVI. Front. Phys. 10:1048835. doi: 10.3389/fphy.2022.1048835
Received: 20 September 2022; Accepted: 03 October 2022;
Published: 19 October 2022.
Edited by:
Yufei Ma, Harbin Institute of Technology, ChinaCopyright © 2022 Ding, Wu, He, Chen and Liu. This is an open-access article distributed under the terms of the Creative Commons Attribution License (CC BY). The use, distribution or reproduction in other forums is permitted, provided the original author(s) and the copyright owner(s) are credited and that the original publication in this journal is cited, in accordance with accepted academic practice. No use, distribution or reproduction is permitted which does not comply with these terms.
*Correspondence: Bo Chen, Y2hlbmJAY2lvbXAuYWMuY24=
 Guangxing Ding
 Kun Wu1