- 1Centro Universitario—SENAI CIMATEC, Salvador, Brazil
- 2Nucleo de Pesquisa Aplicada e Inovacao—NPAI, UNEB/SENAI CIMATEC, Salvador, Brazil
- 3Departmento de Ciência da Computação, Instituto Federal da Bahia, Jacobina, Brazil
- 4VALORIZA—Research Center for Endogenous Resources—Valorization, Portalegre, Portugal
- 5Instituto Politécnico de Portalegre, Portalegre, Portugal
- 6CEFAGE-UE, IIFA, Universidade de Évora, Évora, Portugal
- 7Universidade Do Estado Da Bahia, Salvador, Brazil
Fossil fuels as a primary source have affected the environmental balance, with the effects being more intense in poor regions of the world. The good news is that the 21st century has witnessed intensified efforts to use clean energy sources capable of competing with fossil fuels. An additional concern is to combine energy sustainability and socioeconomic well-being. The intensified use of renewable energy in poor regions may create scenarios of expanding and democratizing the use of electricity and enhancing new businesses and services. Biomass, solar energy, and wind energy are examples of renewable sources in countries such as Brazil. This research aims to characterize the features of the energy matrix suitable for different regions of Brazil and match optimal points for the implementation of micro-electric power plants for generation, distribution, and storage from renewable energy sources. This is an opportunity to contribute to a cycle of regional economic growth from a sustainable perspective.
1 Introduction
Traditional energy security based on the use of fossil fuels has been the subject of discussion on climate decarbonization. According to the report of the Intergovernmental Panel on Climate Change (IPCC), it is urgent to reduce carbon emissions in the atmosphere, especially CO2 (carbon dioxide). This is considered the largest contributor to intensification of the greenhouse effect (GHG) in the atmosphere, from the use of fossil fuels, especially for electricity and heat generation (30%), transport (15%), manufacturing and consumption (12%), and agriculture (11.8%). On the other hand, renewable energy sources seem to be the best option to provide persistent energy security based on new energy generation by expanding the use of technologies from renewable energy sources. This panorama has led to important discussions, including the configuration of an energy matrix integrated into a country’s regional characteristics. In contrast, the world is expected to make choices and strategic decisions that contribute to sustainable development in the field of energy.
Energy vulnerability has been a growing concern in many regions of the planet [1]. The indiscriminate use of natural resources, for example, as approximately 3 billion people depend on biomass mainly energy extracted from firewood to meet their life-sustaining needs [2]. Increasingly, there are initiatives to socialize the use of energy for socioeconomic well-being, as well as pressure on public management at different levels of government. This, combined with regional economics (studying climate-resilient territories) and state planning (of sustainable development) of the economy and other spheres of scientific knowledge, can reduce energy vulnerability [3, 4]. Thus, places where renewable energy sources are available should benefit from appropriate technologies if these have potential health, education, social, and economic benefits for people living in energy vulnerability [5].
To build sustainable strategies in favor of energy security, it is necessary to understand the different dynamics of energy generation and consumption in distinct spatial and temporal dimensions. More specifically, we discuss and understand how the energy security process takes place based on intraregional and interregional cooperation, identifying which forms of low-carbon electricity generation can contribute to promoting sustainable regional economic activities. In addition to energy security, this proposal is in line with the [6] and the Sustainable Development Goals (SDGs), among which are affordable and clean energy (SDG7), sustainable cities and communities (SDG11), and action against climate change (SDG13).
In addition, the IPCC report signaled worrisome socioeconomic impact, especially in the poorest regions. On the other hand, new technologies have created business opportunities, especially for regions of the world with the potential to use sustainable energy sources. Here, Brazil could benefit from its tradition of using energy from renewable sources. Another favorable element is the micro- and mini-generation of electricity, which has gained prominence in expanding the low-carbon electricity supply in the country’s transition process [7].
Bahia is the fourth largest state in Brazil in terms of population, with approximately 15 million inhabitants. It has an area of 567, 295 km2 and is divided into 27 territories, which in turn divided into 417 municipalities. The capital of the State of Bahia is Salvador (12° 58 S, 38° 29 W). The state covers a larger area than the French mainland (543, 965 km2), Yemen (527, 968 km2), Thailand (513, 120 km2), and Spain (504, 030 km2). This has been used in several studies, such as fractal behaviors [8, 9], nonlinearity [10], transport correlations between cities [11], and the spread and distribution of epidemic cases [12, 13].
In general, understanding behaviors in certain sets of variables may not be a simple task, especially when we are dealing with real events. By bringing together indicators of socioeconomic inequality, human development, social vulnerability, and the feasibility of low-carbon energy generation, we are facing a set of variables, with different dimensions and scales that interact in a nonlinear way, which characterizes the profile of this research.
The literature contains studies exploring features of local solar energy development and concerns about solar energy [14–18]. In this paper, the centroid method approach, based on the graph theory, is used to explore the arrangement of cities in Bahia to identify places to install micro- and mini-generation electricity plants. We believe this study may inspire and support private or public decision-makers in promoting a low-carbon economy, reducing regional energy vulnerability, and contributing to Brazilian energy security and regional social well-being.
2 Methodology
The methodological process (Figure 1) has two steps. The first step is the capture and processing of raw data (data acquisition), and the second step demonstrates the application of the method for grouping cities (K-means method).

FIGURE 1. Description of the methodological path to identify poor regions and the micro- and mini-renewable energy generation in the State of Bahia.
In the State of Bahia, three economic and social data indexes were verified. The Gini coefficient, created by the Italian statistician, demographer, and sociologist Corrado Gini, is a measure of statistical dispersion intended to represent the wealth inequality in each municipality in Bahia. The human development index (HDI), created by the United Nations (UN), evaluates the level of human development within a perspective sustained by the tripod: income, education, and health. In addition, the social vulnerability index (SVI), developed by the Government of Brazil through the Foundation Institute for Applied Economic Research (IPEA), measures social exclusion and vulnerability in the Brazilian territory, complementing the HDI Instituto de Pesquisa Econômica Aplicada (IPEA) (2022).
2.1 Data acquisition
In this study, the entire methodological course was based on open data from the [19], the [20], and the [21], which were the main sources of data. Bahia represents the State of Bahia with 417 cities (municipalities).
At ANEEL, we collected data corresponding to the micro- and mini-generation of energy produced, made available on 1 July 2022. At IBGE and IPEA, consolidated statistical data on the socioeconomic situation of the State of Bahia were used.
For the limits established, considering the data provided by the IBGE, a territorial structure was formed with all the elements of the study through the latitude and longitude coordinates of each of the 417 municipalities. When considering the number of municipalities, aiming to reduce this number without disregarding any element of the dataset for the dialog between the mathematical models used, territorial resizing was carried out through groupings to establish a scenario capable of reducing the municipalities to a set of groupings.
2.2 K-means method
To generate clusters of municipalities, the K-means method proposed by [22] was used for a cluster set that would cover the whole set, but with an identification process directed no longer to the municipality but to the cluster to which it belongs.
The K-means algorithm is an unsupervised method that is usually used in data mining and pattern recognition. Aiming at minimizing the cluster performance index, square-error and error criteria are the foundations of this algorithm. To seek the optimizing outcome, this algorithm tries to find K divisions to satisfy a certain criterion. First, we choose some dots to represent the initial cluster focal points. Second, we gather the remaining sample dots to their focal points in accordance with the criterion of minimum distance. Then, we obtain the initial classification, and if the classification is unreasonable, we modify it and iterate repetitively until we obtain a reasonable classification [23, 24].
In addition, K-means algorithm based on dividing is a kind of cluster algorithm and has the advantages of briefness, efficiency, and celerity [24]. The K-means conception is presented as follows:
2.2.1 Euclidean distance
Suppose that X and Z are two samples of pattern vectors,
The smaller the D is, the more similar the X and Z are (D is the distance between X and Z in an n-dimensional space)
2.2.2 Cluster criterion function
The sample pattern congregation is X = X1, X2, … , Xn, and we classify it into C classes, which are S1, S2, … , Sc. Mj and Sj are mean vectors. So,
where Nj and Sj are the numbers of samples. Then, we define the cluster criterion function as
where J represents the quadratic sum of the inaccuracy of all kinds of classes of samples and their mean value. We can also call it the sum of the distances of samples and their mean value.
From the data presented on the state’s energy potential, through the dataset used for each cluster, it was possible to establish choices about the criteria for energy production, highlighting the largest production of photovoltaic plants, directing to this model of energy production, and determining the flow for the item “energy.”
Based on these data, considering the indices of social vulnerability over the cluster and not just for each municipality, the fragility of the cluster of each region was observed, considering the set’s impact on the whole as a function of its proximity, in this case determining the flow for the item economy.
The classification of the positional proximity of the municipalities to construct the groups used in the K-means method considers, from the specification of a set of clusters, a model that allows the identification of centers, or centroids, that are randomly repositioned on the plane. Based on the Cartesian coordinates identified in the composition of the latitude and longitude pair of each municipality, repositioning is carried out until the iteration process no longer identifies changes in proximity between the centroid and the cluster to which it belongs. This defines, in the set of groups used, an optimal point identified by the centroid in each group of municipalities. This algorithm was proposed by [22] and corresponds to a standard parameter of the K-means library of the R programming language.
The socioeconomic database used on the groups was established through a nonhierarchical process using the median on the grouped municipalities and brought as a location reference to identify each group, calculated from the sum of the Euclidean distances obtained. With the proposed algorithm, through its respective centroid, group identification based on the municipality located in the centroid is found. Thus, when referring to the centroid municipality, this identification is extended to the entire set of municipalities belonging to the cluster. This methodology has already been adopted in the creation of models implemented in the State of Bahia, such as identity territories, and based on methods widely used in the literature to obtain the optimal number of centroids [25, 26].
To identify an optimal value for the total number of clusters, a model already established in the state with its 27 identity territories (ITs) by the Secretary of Culture of the State of Bahia [27] was used as a parameter. This optimal number of IT groupings does not have its characteristics consolidated only in a positional character but in a set of characteristics outside the scope of this study. Therefore, considering the quantitative but not the determined grouping model, it was necessary, through the positional element determined by municipalities’ latitude and longitude coordinates, to restructure the cluster considering a new set of municipalities through a model established with Euclidean distances over the centroid elements generated through the K-means method.
Based on the data obtained and applied to the geometric grid of the State of Bahia, two steps characterize the study. The first establishes a relationship between the potential of distributed and renewable energy generation in the region. This can identify the most different potentialities about the most prominent resources on the quantity of installed electric energy generation ventures of micro- or mini-generation. This enables us to evaluate the region’s production load on the spaces concerning its geographical distribution. A second step was to identify, on this generational chain, the spaces of the greater potential of the energy resources that affect this generational representation.
From the data compiled on the region’s economic indicators, the socioeconomic weakness in the municipalities was mapped. For this purpose, the medians of their socioeconomic indicators were used in their respective groups, comparing the production chain and the potential of existing resources.
The data obtained were classified according to the modality of generation. Installed power no greater than 75 kW (kilowatt) is named micro-generation, and installed power greater than 75 kW and no greater than 5 MW (megawatt) is named mini-generation. Modalities of energy generation are enabled, and a network model based on the graph theory is used, having as vertices the groups of municipalities represented by their centroid. From now on, we will just call these the centroid and modality (Table 1).

TABLE 1. Abbreviation of the modalities of energy generation. Source: Agência Nacional de Energia Elétrica (ANEEL) [19].
The generation chain data produced by ANEEL referring to the type of consolidated generation for micro- or mini-generation highlight predominance in the production of photovoltaic solar energy-generating plants (Figure 2A). This production is spread throughout Bahia but with an emphasis on a particular region. It is worth noting that the impact on this amount is not represented by its energy production capacity but by the total number of micro- and mini-generation projects installed.
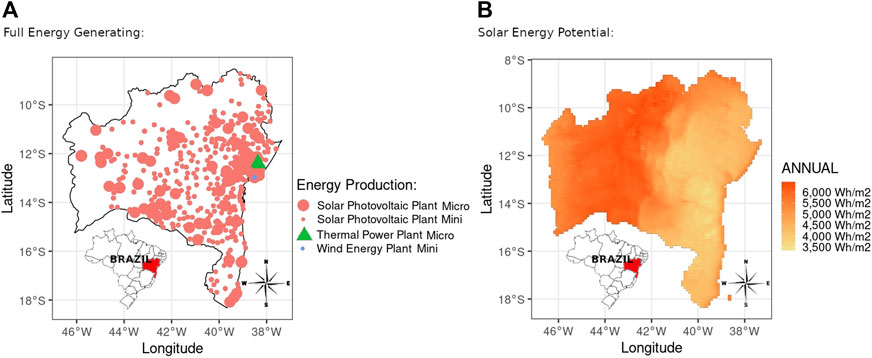
FIGURE 2. Representation of the type of energy generation in the State of Bahia by installed projects.
On the other hand, in the outstanding generational representation of the photovoltaic solar energy model produced by the National Space Research - INPE [28], the greatest energy potential is located in another region of the map (Figure 2B), and the energy production capacity diverges from the use of the entire generational chain, causing the spaces of greater energy production not to be used concerning the region’s productive potential.
The composition of the grouping, considering the guidelines highlighted in the methodology, which resulted in a total of 27 groups (Figure 3), was consolidated on the sum of the squares of the Euclidean distances of each object with its respective centroid equal to 90.05243, characterizing a model similar to the previously mentioned IT but highlighting some changes in the set of municipalities compared to the IT.
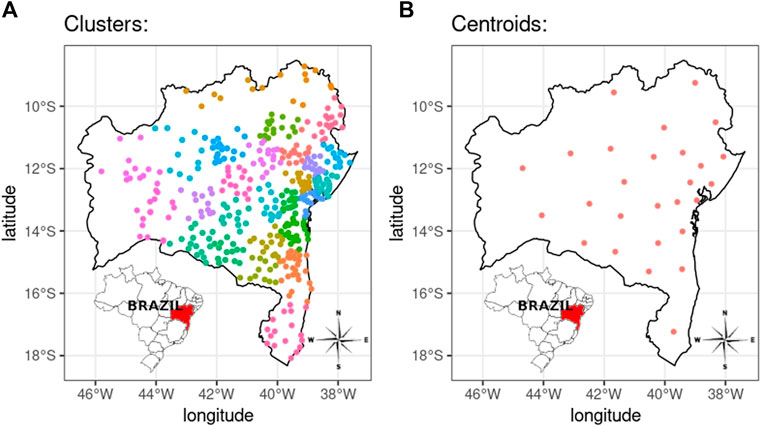
FIGURE 3. Grouping of municipalities in the 27 clusters identified in the map of the State of Bahia.
The clustering process generated a grouping of centroids (municipalities) that served as the basis to identify each group from the longitude and latitude coordinates as a way to identify the set of objects (municipalities) contained in the clusters. Therefore, when referring to a particular centroid, its representation is the set of municipalities in the respective cluster. From the median calculated of the 27 clusters identified, it is possible to delimit the regions that present high vulnerability according to socioeconomic indexes (Figure 4).
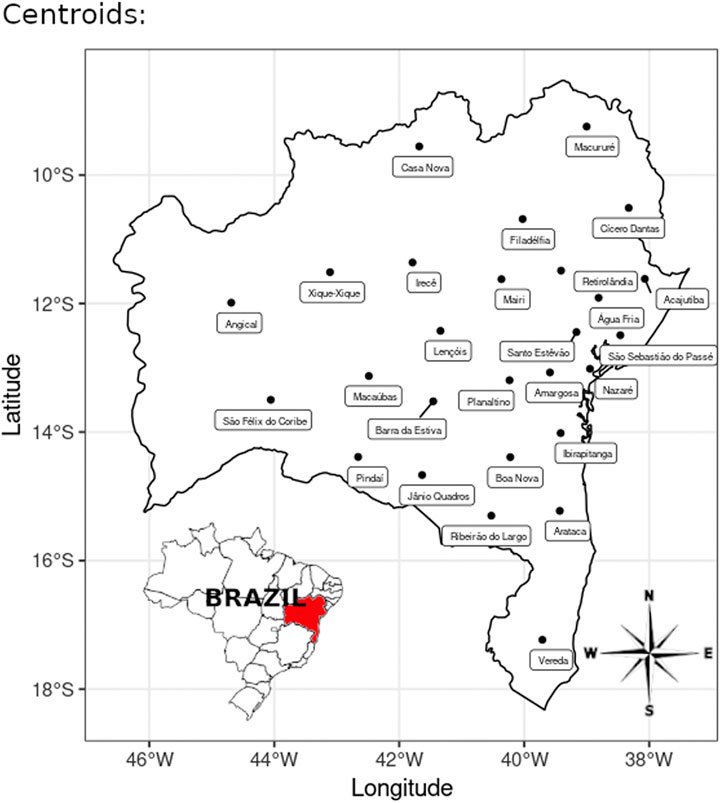
FIGURE 4. Median of the 27 clusters identified in the map of the State of Bahia, for the GINI—distant assessment of the degree of income concentration, the HDI—international index of the human development level, and the SVI—index of social exclusion and vulnerability in the Brazilian territory.
By incorporating the location of each group considering the economic and social indicators arising from the composition of the median of the groups carried out on the production chain of installed electric energy generation of micro- or mini-generation on the potential of existing resources in the state, a reading is obtained on the interference of economic and social aspects acting on the existing advances in energy production in certain groups in the region.
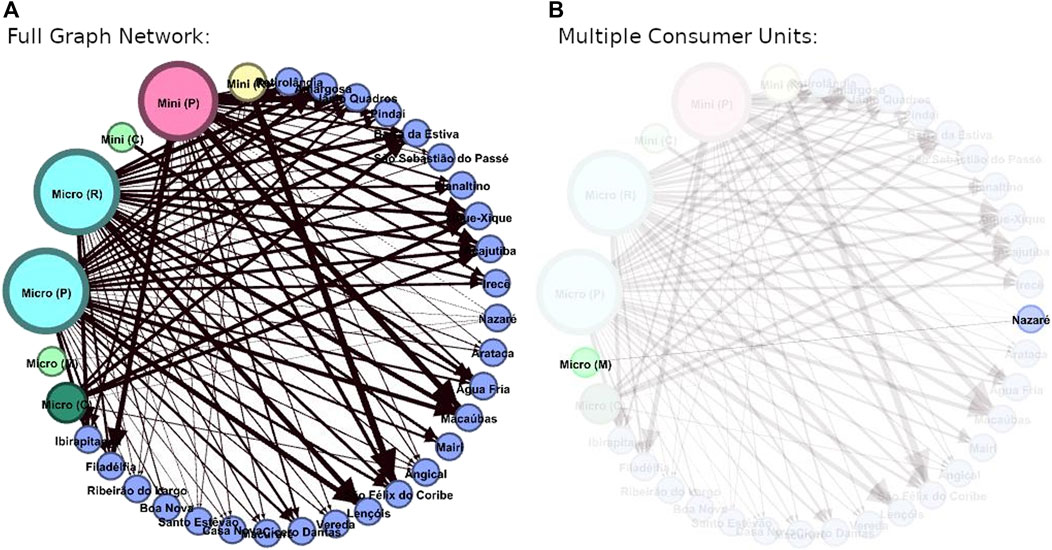
In the graph, the vertices are divided into two sets: modalities of projects enabled for micro- and mini-energy generation in the State of Bahia and centroids. These two sets of vertices—modality and centroid—establish a network construction model corresponding to a bipartite graph, since there is only a relationship between the vertices of distinct sets, thus characterizing the absence of cycles.
The edges or relations of the graph are defined by the existence of the modality in the centroid, characterized through a directional flow originating in the vertices of the modality, identifying only the existence of an exit degree for the modalities and with a destination in the centroids and identifying only the degree of entry for the centroids (Figure 6, Figure 7). The weight of these relationships is per 1,000 of the total number of enterprises over the total number of inhabitants of the respective centroid.
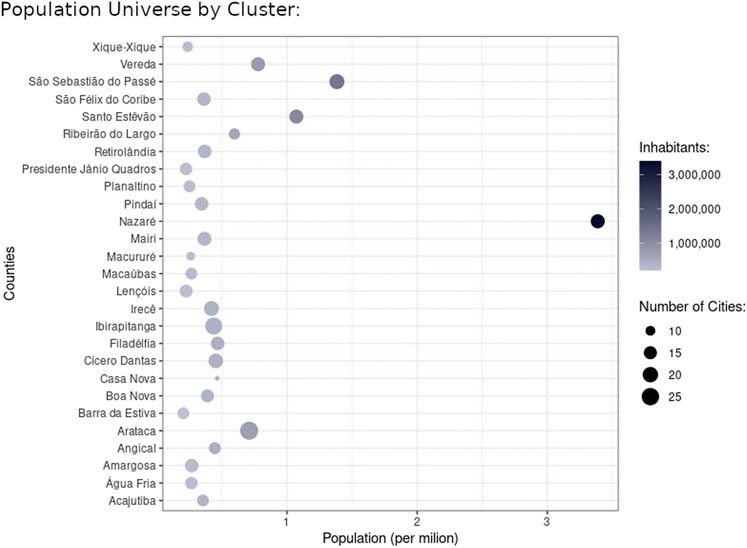
FIGURE 6. Graph of the relationship between the type of generation and the groupings, highlighting the development of multiple consumer units (CU).
These two sets of vertices—centroid and modality—establish a network construction model corresponding to a bipartite graph, since there is no relationship between the vertices of these two sets, thus characterizing the absence of cycles.
By highlighting the numbers observed in the composition of the economic and social indices, it is noticed, for example, that the São Sebastião do Passé e centroid has a high HDI and a low IVS in the others and is located in a region with great generational demand, but with little energy potential concerning the others. However, the Xique–Xique centroid has an HDI well below and an SVI well above the São Sebastião do Passé e centroid, but it is located in a region with little generational demand but great energy potential in relation to the others.
Within a population universe, considering the number of municipalities included in each cluster (Figure 5), there is an overload in the municipalities that are close to large metropolitan centers such as the capital, Salvador, highlighted in the centroids of Nazaré, São Sebastião Passé e, and Santo Estevão, triangulating over the region with the greatest energy production capacity. On the other hand, the Casa Nova centroid, despite the strong solar incidence in the region, is not considered with this production capacity.
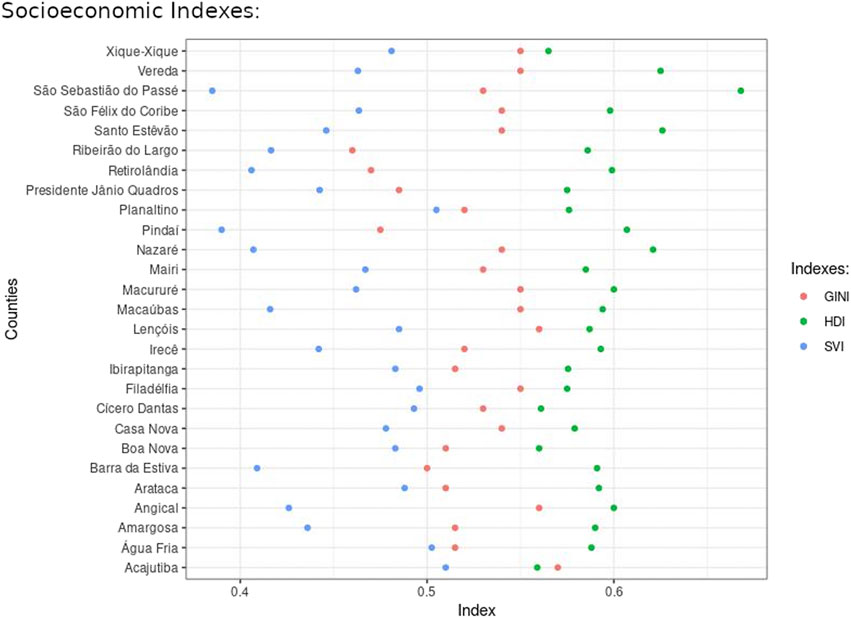
FIGURE 5. Population universe of clusters identifying the total number of municipalities in each cluster.
From the network construction (Figure 6A), acting on the concatenated elements of size and modality on the groupings of municipalities extracted from the clustering process, a scenario is obtained that corroborates the need to expand a model based on multiple consumer units to enhance the use of photovoltaic units in the regions of Bahia, considering that only the Nazaré centroid (Figure 6B) has this model.
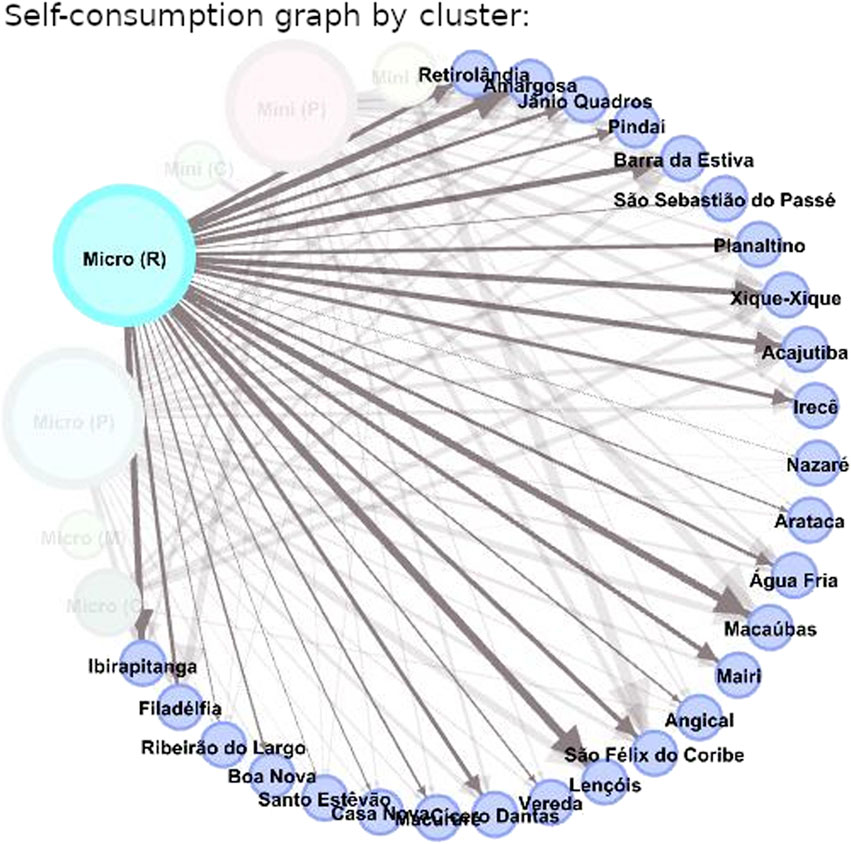
In contrast to the consumption model of the development of multiple consumer units (CU), which needs to be established on a need within the same concession area and may also be through a consortium or a cooperative, the remote self-consumption modality allows installation of the photovoltaic solar energy-generating system in locations other than the place where this energy will be consumed, using ownership as a link. This practice is observed in all the groups represented by directing the larger circle (Micro – R) to the smaller circles (clusters) (Figure 7), considering production for micro-generation.
3 Discussion
The K-means method used to obtain the set of municipalities of the State of Bahia provides a process of dimensionality reduction on the total set of municipalities (Figure 8). Thus, through the grouping performed, positional similarities allow us to suggest energy arrangement centers between municipalities.
The general framework presented by the Federal Government of Brazil [29] aimed to meet the Sustainable Development Goals (SDGs) presented by the United Nations (UN) by 2030. Considering the last update performed on 8 May 2022, on the indicators presented (Figure 9), there is still a lack of actions to achieve the goals proposed by the UN.
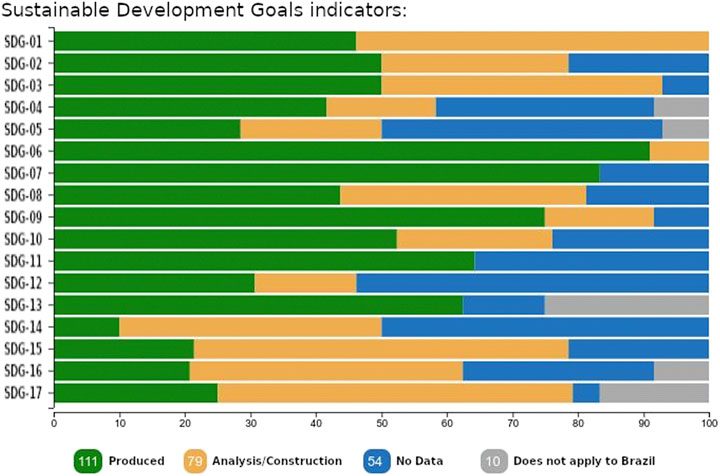
FIGURE 9. Summary of the production of global indicators by objective (%) [29].
By establishing a relationship between SDG1 and SDG7, respectively, “Eradication of Poverty” and “Clean and Affordable Energy,” it is possible to present an interconnected relationship between these two objectives, but according to the distance explained on the presented indicators, this has not been consolidated yet.
When evaluating the difference between the CU consumption model and remote self-consumption presented, considering the representation of photovoltaic panels over other production models in the State of Bahia by installed enterprises, a portion of the population is favored if installation costs are considered.
Brazil uses a model based on tariff flags that apparently do not contribute to the economic development of socially fragile regions and increases the impoverishment of part of the population. It may not be able to bear the costs of implementing photovoltaic energy, considering the increases in energy tariffs resulting from the activation of tariff flags by ANEEL 2015–2022 (Figure 10).
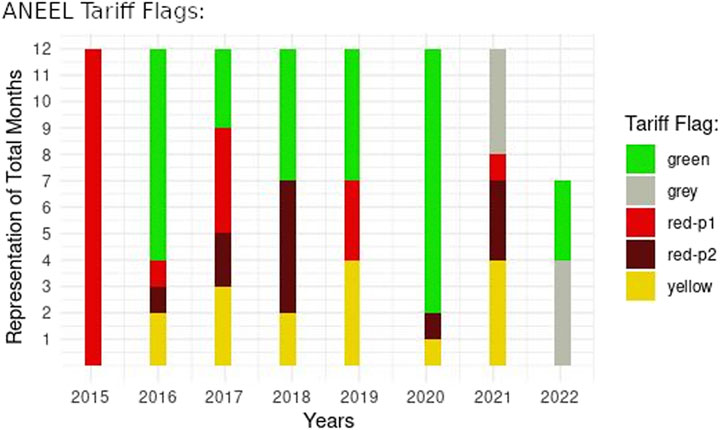
FIGURE 10. Quantitative representation in months of the activation of tariff flags in the period from January 2015 to July 2022 (ANEEL).
The representation of the costs on the tariff flags presented by ANEEL (Agência Nacional de Energia Elétrica (ANEEL) (2022b)) (Table 2) establishes ranges that vary according to the criticality of the existing energy security in the country. These values have already undergone several changes, either in the construction of the indicator trigger or by the values practiced in its activation and which can be explored in the actuation report presented by ANEEL. This represents the need for public policies aimed at building models to implement renewable energy sources that dialog with economic indicators in the poorest regions of Brazil. This aims to improve the quality of life of people living in these spaces of energy production [30,31].

TABLE 2. Values of tariff flags for the period from July 2022 to June 2023 [32].
Through an approach based on the graph theory, we tried to approach the so-called complex studies, a field of application of many different disciplines, which produces a multiplicity of points of view [33, 34]. Therefore, the idea here was to unite simple components, linking them together, so that the complexity of this interweaving of mutual influences would not be apparent. It is expected that the emergent behavior observable in the centroids will affect the micro- and mini-generation, expanding its low-carbon energy production in the State of Bahia.
We also think that the adaptation to the process of micro- and mini-generation of energy in Bahia may go beyond a circumstantial change. In fact, it would be a change in behavior, in which the stakeholders see the positive externalities [35] of the micro- and mini-generation model through the observable result of the mutual influences of the interconnected variables, increasing the participation of the low-carbon matrix in the National Energy Systems of Brazil.
4 Conclusion
With the expansion of the energy matrix proposed in this work, an increase in the supply of energy is expected, followed by a reduction in its cost, enhancing new business models and services associated with the new sharing economy. The term “sharing economy” is used to describe the model of consumption of goods and services based on sharing among individuals (peer-to-peer), usually connected through an online platform. The shared production and consumption of renewable sources can promote significant changes in the relationship between economic agents.
Providing subsidies for better use of renewable energy sources or low carbon emissions from the micro- and mini-generation network can contribute to local growth. The economy can be improved with local investments, integrating production and generation into the National Energy System, contributing to the country’s energy security, and generating local employment and income.
The innovation potential of this research lies in the proposal of a model to map the potential of micro- and mini-energy generation in the grid. This will provide important information to enable cooperation projects in renewable generation networks for micro- and mini-generation. A model based on centers will allow the construction of technological resources that can be incorporated into technological models to reduce energy vulnerability in future locations with low financial value.
Regarding the residuals produced by the proposed system, it is known that the panels can become a source of hazardous loads, although there are great solar benefits to generate socio-economic growth. The good news is the progress of studies that lead to the collection process, recovery of the material used in this system, and the policies that require its destination [36, 37]. While the technology from these studies is not commercially available yet, this project also suggests the reuse of photovoltaic panels for the construction of shade areas in the centroid regions to reduce direct exposure to solar radiation in urban and rural areas. This will contribute to the inclusion of new sources of income, such as livestock and poultry, thus benefiting the families involved.
Data availability statement
Publicly available datasets were analyzed in this study. These data can be found at: https://www.ibge.gov.br/acesso-informacao/dados-abertos.html http://ivs.ipea.gov.br/index.php/pt/planilha http://labren.ccst.inpe.br/atlas_2017.html https://odsbrasil.gov.br/relatorio/sintese http://labren.ccst.inpe.br/atlas_2017.html http://www.cultura.ba.gov.br/modules/conteudo/conteudo.php?conteudo=314.
Author contributions
All authors listed have made a substantial, direct, and intellectual contribution to the work and approved it for publication.
Conflict of interest
The authors declare that the research was conducted in the absence of any commercial or financial relationships that could be construed as a potential conflict of interest.
Publisher’s note
All claims expressed in this article are solely those of the authors and do not necessarily represent those of their affiliated organizations, or those of the publisher, the editors, and the reviewers. Any product that may be evaluated in this article, or claim that may be made by its manufacturer, is not guaranteed or endorsed by the publisher.
References
1. Gower A. Energy justice in apartment buildings and the spatial scale of energy sustainable design regulations in Australia and the UK. Front Sustain Cities (2021) 3:644418. doi:10.3389/frsc.2021.644418
2. Scheid A, Hafner JM, Hoffmann H, Kächele H, Uckert G, Sieber S, et al. Adapting to fuelwood scarcity: The farmers’ perspective. Front Sustain Food Syst (2019) 3:28. doi:10.3389/fsufs.2019.00028
3. Teron L, Ekoh SS. Energy democracy and the city: Evaluating the practice and potential of municipal sustainability planning. Front Commun (Lausanne) (2018) 3:8. doi:10.3389/fcomm.2018.00008
4. Popkova EG, Shi XR. Economics of climate change: Global trends, country specifics and digital perspectives of climate action. Front Env Econ (2022) 2022. doi:10.3389/frevc.2022.935368
5. Zahnd A, Kimber HM. Benefits from a renewable energy village electrification system. Renew Energ (2009) 34:362–8. doi:10.1016/j.renene.2008.05.011
6.[Dataset] United Nations Development Programme (UNDP). What are the sustainable development goals? (2015). Available from: https://www.undp.org/sustainable-development-goals?utm_source=EN&utm_medium=GSR&utm_content=US_UNDP_PaidSearch_Brand_English&utm_campaign=CENTRAL&c_src=CENTRAL&c_src2=GSR&gclid=CjwKCAjwmJeYBhAwEiwAXlg0ATc0_cnywNzLNffUM5Ha_9elXNY8-NkEBPQrpuJq3zyuf7egWsyWmRoC5XsQAvD_BwE (Accessed August 10, 2022).
7.[Dataset] Brasil, E. d. P. E., Ministério de Minas e Energia. Plano nacional de energia 2050 (pne) (2022). Available from: https://www.epe.gov.br/pt/publicacoes-dados-abertos/publicacoes/Plano-Nacional-de-Energia-2050.
8. Nascimento Filho A, Araújo M, Miranda J, Murari T, Saba H, Moret M. Self-affinity and self-organized criticality applied to the relationship between the economic arrangements and the dengue fever spread in bahia. Physica A: Stat Mech its Appl (2018) 502:619–28. doi:10.1016/j.physa.2018.03.024
9. Azevedo S, Saba H, Miranda J, Filho AN, Moret M. Self-affinity in the dengue fever time series. Int J Mod Phys C (2016) 27:1650143. doi:10.1142/s0129183116501436
10. Murari TB, Ferreira P, Saba H, Moret MA. A spatio-temporal analysis of dengue spread in a brazilian dry climate region. Sci Rep (2021) 11:11892–8. doi:10.1038/s41598-021-91306-z
11. Saba H, Moret MA, Barreto FR, Araújo MLV, Jorge EMF, Nascimento Filho AS, et al. Relevance of transportation to correlations among criticality, physical means of propagation, and distribution of dengue fever cases in the state of bahia. Sci Total Environ (2018) 618:971–6. doi:10.1016/j.scitotenv.2017.09.047
12. Araujo ML, Miranda JG, Vasconcelos RN, Cambui EC, Rosário RS, Macedo MC, et al. A critical analysis of the Covid-19 hospitalization network in countries with limited resources. Int J Environ Res Public Health (2022) 19:3872. doi:10.3390/ijerph19073872
13. Saba H, Nascimento Filho A, Miranda JG, Rosário RS, Murari TB, Jorge EM, et al. Synchronized spread of Covid-19 in the cities of bahia, Brazil. Epidemics (2022) 2022:100587. doi:10.1016/j.epidem.2022.100587
14. Guan Q, An H, Li H, Hao X. The rapid bi-level exploration on the evolution of regional solar energy development. Physica A: Stat Mech its Appl (2017) 465:49–61. doi:10.1016/j.physa.2016.08.007
15. Paiva ASS, Rivera-Castro MA, Andrade RFS. Dcca analysis of renewable and conventional energy prices. Physica A: Stat Mech its Appl (2018) 490:1408–14. doi:10.1016/j.physa.2017.08.052
16. Kwan CL. Influence of local environmental, social, economic and political variables on the spatial distribution of residential solar pv arrays across the united states. Energy Policy (2012) 47:332–44. doi:10.1016/j.enpol.2012.04.074
17. Soto EA, Bosman LB, Wollega E, Leon-Salas WD. Peer-to-peer energy trading: A review of the literature. Appl Energ (2021) 283:116268. doi:10.1016/j.apenergy.2020.116268
18. Zhang K, Li J, He Z, Yan W. Microgrid energy dispatching for industrial zones with renewable generations and electric vehicles via stochastic optimization and learning. Physica A: Stat Mech its Appl (2018) 501:356–69. doi:10.1016/j.physa.2018.02.196
19.[Dataset] Agência Nacional de Energia Elétrica (ANEEL). Relação de empreendimentos de geração distribuída (2022). Available from: https://dadosabertos.aneel.gov.br/dataset/relacao-de-empreendimentos-de-geracao-distribuida (Accessed July 01, 2022).
20.[Dataset] Instituto Brasileiro de Geografia e Estatística (IBGE). Dados abertos (2022). Available from: https://www.ibge.gov.br/acesso-informacao/dados-abertos.html (Accessed July 01, 2022).
21.[Dataset] Instituto de Pesquisa Econômica Aplicada (IPEA). Atlas da vulnerabilidade social dos municípios (2022). Available from: http://ivs.ipea.gov.br/index.php/pt/planilha (Accessed July 20, 2022).
22. Hartigan JA, Wong MA. Algorithm as 136: A k-means clustering algorithm. Appl Stat (1979) 28:100–8. doi:10.2307/2346830
23. Likas A, Vlassis N, Verbeek JJ. The global k-means clustering algorithm. Pattern recognition (2003) 36:451–61. doi:10.1016/s0031-3203(02)00060-2
24. Li Y, Wu H. A clustering method based on k-means algorithm. Phys Proced (2012) 25:1104–9. doi:10.1016/j.phpro.2012.03.206
25. Zhang C, Lu X, Ren G, Chen S, Hu C, Kong Z, et al. Optimal allocation of onshore wind power in China based on cluster analysis. Appl Energ (2021) 285:116482. doi:10.1016/j.apenergy.2021.116482
26. Zhou HB, Gao JT. Automatic method for determining cluster number based on silhouette coefficient. Adv Mat Res (2014) 951:227–30. doi:10.4028/www.scientific.net/amr.951.227
27.[Dataset] Secretaria de Cultura do Estado da Bahia (SecultBA). Divisão territorial da bahia (2022). Available from: http://www.cultura.ba.gov.br/modules/conteudo/conteudo.php?conteudo=314 (Accessed July 20, 2022).
28.[Dataset] Instituto Nacional de Pesquisas Espaciais (INPE). Atlas brasileiro de energia solar (2017). Available from: http://labren.ccst.inpe.br/atlas_2017.html (Accessed July 25, 2022).
29.[Dataset] Governo Federal do Brasil. Relatório dos indicadores para os objetivos de desenvolvimento sustentável (2022). Available from: https://odsbrasil.gov.br/relatorio/sintese (Accessed August 10, 2022).
30. Nascimento Filho AS, Saba H, dos Santos RG, Calmon JGA, Araújo ML, Jorge EM, et al. Analysis of hydrous ethanol price competitiveness after the implementation of the fossil fuel import price parity policy in Brazil. Sustainability (2021) 13:9899. doi:10.3390/su13179899
31. Nascimento Filho AS, dos Santos RG, Calmon JGA, Lobato PA, Moret MA, Murari TB, et al. Induction of a consumption pattern for ethanol and gasoline in Brazil. Sustainability (2022) 14:9047. doi:10.3390/su14159047
32.[Dataset] Agência Nacional de Energia Elétrica (ANEEL). Bandeira tarifária (2022). Available from: https://app.powerbi.com/view?r=eyJrIjoiOWZiMjk2NzUtOWNiYi00OWUyLTljNTktNmRjZmRkNjcwYTM5IiwidCI6IjQwZDZmOWI4LWVjYTctNDZhMi05MmQ0LWVhNGU5YzAxNzBlMSIsImMiOjR9 (Accessed August 10, 2022).
36. Chowdhury MS, Rahman KS, Chowdhury T, Nuthammachot N, Techato K, Akhtaruzzaman M, et al. An overview of solar photovoltaic panels’ end-of-life material recycling. Energ Strategy Rev (2020) 27:100431. doi:10.1016/j.esr.2019.100431
Keywords: centroid, mini-generation, socioeconomic well-being, solar energy, cluster network
Citation: Filho ASN, Borges T, Salvador H, Ferreira P and Saba H (2022) Renewable sources to promote well-being in poor regions of Brazil. Front. Phys. 10:1048721. doi: 10.3389/fphy.2022.1048721
Received: 19 September 2022; Accepted: 07 November 2022;
Published: 01 December 2022.
Edited by:
Tathiane Mayumi Anazawa, Autonomous University of Barcelona, SpainReviewed by:
Kazuya Hayata, Sapporo Gakuin University, JapanLucia Calderon Pacheco, Centro Nacional de Monitoramento e Alertas de Desastres Naturais (CEMADEN), Brazil
Copyright © 2022 Filho, Borges, Salvador, Ferreira and Saba. This is an open-access article distributed under the terms of the Creative Commons Attribution License (CC BY). The use, distribution or reproduction in other forums is permitted, provided the original author(s) and the copyright owner(s) are credited and that the original publication in this journal is cited, in accordance with accepted academic practice. No use, distribution or reproduction is permitted which does not comply with these terms.
*Correspondence: Hugo Saba, aHVnb3NhYmFAZ21haWwuY29t
 Aloısio S. Nascimento Filho1,2
 Paulo Ferreira
 Hugo Saba