- 1School of Mechanical and Power Engineering, Henan Polytechnic University, Jiaozuo, Henan, China
- 2Laboratory of Modern Facility Agriculture Technology and Equipment Engineering of Jiangsu Province, College of Engineering, Nanjing Agricultural University, Nanjing, Jiangsu, China
- 3Department of Electrical and Communications Engineering, School of Engineering and Built Environment, Masinde Muliro University of Science and Technology, Kakamega, Kenya
- 4Department of Science and Environmental Policy, University of Milan, Milan, Italy
Respiratory rate is an indicator of a broilers’ stress and health status, thus, it is essential to detect respiratory rate contactless and stress-freely. This study proposed an estimation method of broiler respiratory rate by deep learning and machine vision. Experiments were performed at New Hope (Shandong Province, P. R. China) and Wen’s group (Guangdong Province, P. R. China), and a total of 300 min of video data were collected. By separating video frames, a data set of 3,000 images was made, and two semantic segmentation models were trained. The single-channel Euler video magnification algorithm was used to amplify the belly fluctuation of the broiler, which saved 55% operation time compared with the traditional Eulerian video magnification algorithm. The contour features significantly related to respiration were used to obtain the signals that could estimate broilers’ respiratory rate. Detrending and band-pass filtering eliminated the influence of broiler posture conversion and motion on the signal. The mean absolute error, root mean square error, average accuracy of the proposed respiratory rate estimation technique for broilers were 3.72%, 16.92%, and 92.19%, respectively.
1 Introduction
According to the United Nations (UN) prediction, the global population will exceed nine billion by 2050, thus, food security has become a challenging factor [1,2]. Alexandratos and Bruinsma [3] estimated that the demand for animal-derived food could increase by 70% between 2005 and 2050 and that poultry meat production is crucial. Additionally, meat consumption is notably dominant, especially in countries with significant Gross Domestic Product (GDP) growth. Broilers are an essential source of protein, and according to the prediction, the demand for broilers will further increase in the next decade [4].
Regarding animal welfare and productivity (economics) in broilers production systems, some aspects still need attention. In particular, broilers’ respiratory rate (RR) is related to health and feeding environment [5]. The RR of broilers provides farmers with the basis for diagnosing respiratory-related diseases and stress [6]. In the current commercial broiler husbandry, farmers judge the disease and stress of broilers by manually observing the RR and listening to their abnormal respiratory sounds. However, this is laborious, objective, and has low accuracy. Therefore, an effective accurate and automatic estimation of broiler RR is of significant importance in reducing diseases and improving animal welfare.
Several studies have reported on the detection of RR in animals. Xie et al. [7] developed a method by computer vision to detect the RR of pigs. This method extracted the maximum curvature radius of the pig’s back contour in each frame and constructed the respiratory waveform according to the extracted curvature radius. The average relative error between the method and manual count results was 2.28%. Stewart et al. [8] reported on detecting cows RR by infrared thermal imaging technology. A thermal infrared camera was used to monitor the air temperature near the nostrils of cattle and detect breathing. Zhao et al. [9] applied the Horn-Schunck optical flow method to calculate the periodic change of optical flow direction of abdominal fluctuation of dairy cows, which obtained their RR at a detection accuracy of 95.68%. Song et al. [10] proposed a Lucas Kanade sparse optical flow algorithm to calculate the optical flow of cow plaque boundary. According to the change law of average optical flow of plaque boundary in video sequence frame, the detection of cow respiratory behavior was obtained, and the average accuracy was 98.58%. Presently, RR monitoring in animals focuses on those of larger size, such as pigs and dairy cows. Due to poultry, such as broilers, being smaller, contactless estimation of RR in poultry has not been studied.
Due to a large number of broilers in the broiler house, it is unfeasible to detect broiler RR using the equipment mentioned before, including radar and depth camera, for their high cost. In contrast, computer vision technology is contactless and stress-free for broilers. It is an ideal means to realize non-contact detection of broiler RR. At present, some scholars use machine vision and artificial intelligence to realize chicken disease early warning and recognition. Okinda et al. [11] used the feature variables which were extracted based on 2D posture shape descriptors (circle variance, elongation, convexity, complexity, and eccentricity) and mobility feature (walk speed) achieved the early diagnosis of Newcastle disease virus infection in broiler chickens. Wang et al. [12] realized the recognition and classification of abnormal feces by using deep learning and machine vision, so as to achieve the purpose of monitoring digestive diseases of broilers. However, presently, no research has reported on the use of computer vision technology to detect the RR of broilers.
In this context, this paper presents a novel approach to broiler RR estimation based on semantic segmentation, contour feature, and video magnification. The main objective of this study is to estimate the RR of broilers without contact and stress, and achieve the estimation with movement and multiple postures of broilers in actual farm environment. This introduced technique will significantly improve automation and could be considered a new tool in the field of precision livestock farming to improve animal welfare and production efficiency.
2 Materials and methods
2.1 Experiment design and data collection
Two experiments were conducted in this study. At New Hope broiler farm, Weifang, Shandong Province, P. R. China, in October 2019, and at Wen’s research farm, Yunfu, Guangdong Province, P. R. China in September 2021. A total of 30 15 to 35-day-old Arbor Acres broilers were used in the experiment. The farmer randomly selected the birds with average body shape and good health. The temperature, humidity, and light setting were kept up with the broiler production during the experiment. With the increase of broiler age, the internal temperature decreased from 28°C to 22°C, and the humidity decreased between 80% and 50%, gradually. The floor was litter (50% sphagnum and 50% wood shavings). The illumination was DC adjustable light in the breeding house, and the light intensity varied between 30 and 50lx.
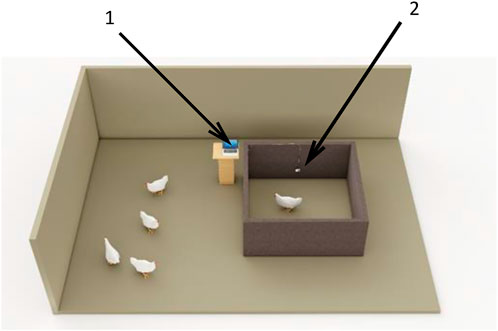
An experimental broiler pen of 1 m (length) by 1 m (width) by 0.5 m (height) was built with a carton board (the color was close to the fence in the broiler house), and the pen hosted one broiler at a time. The pens were set up in the broiler house (in the aisles of the broiler house) and in this way the experimental conditions were kept consistent with the production. Before the broilers were brought into the pen, a camera (SARGO A8, 1,920 × 1,080) was pre-installed in the front and center of the pen 0.2 m away from the ground shown in Figure 1. The camera was connected to an Intel Core i5-4,500 u CPU, 4 GHz, 16 GB physical memory Microsoft Windows 10 PC via USB port and the SARGO software. The data was stored to a 500 GB drive (SSD) installed in the PC for subsequent analysis.
The experimental broilers were placed in the chamber, one at a time. When the birds were quiet (no stress), the computer-controlled camera began to record the video for 10 min for every broiler. In total, 200 min of videos were captured in New Hope farm and 100 min in Wen’s research farm.
The proposed methods mainly include image segmentation, feature extraction, posture conversion and motion influence elimination, and RR estimation. To improve the algorithm’s accuracy, a method of video motion amplification before feature extraction was proposed.
2.2 Data labeling
An expert visual manual count was used as a gold standard for RR measurement. An experienced veterinarian manually labelled the captured videos and the broiler was considered breathed once as the belly fluctuated once. The respiratory times were recorded every 10 s, then multiplied by 6, the RR of broilers (times/minute). Each 1-min video had six values (RR).
2.3 Image preprocessing and semantic segmentation
The conditions during the data acquisition environment were consistent with the actual farm environment. However, the video background was complex and could not be processed directly. Therefore, it was necessary to preprocess the image to remove the background.
2.4 Image preprocessing
To obtain the image object, a variety of traditional image processing methods were tested, including the OTSU [13] algorithm, watershed algorithm [14], and edge detection algorithm [15]. However, they were not satisfactory enough to remove the background. Moreover, these methods had poor performance on the images due to the interferents such as light, broiler feathers, and dust in the broiler house, leading to wrong or missing segmentation.
2.5 Semantic segmentation
In this study, two semantic segmentation algorithms based on deep learning were used to locate and segment broiler individuals, i.e., the Mask R-CNN [16] and YOLAC [17].
2.5.1 Mask R-CNN
Mask R-CNN follows the framework of Fast R-CNN and adds a fully connected segmentation subnet after the primary feature network to realize the new function of segmentation in addition to classification and regression. It is a two-stage framework [16]. In the first stage, the suggestion box is scanned and generated, and in the second stage, the suggestion box is classified, and the boundary box and mask are formed [16]. Figure 2A shows the frame diagram of Mask R-CNN. The convolution layer down sampling is realized through the cross-layer connection of the residual network (RESNET) [16]. Combined with the feature pyramid network (FPN), the feature maps obtained from different sampling layers are fused and transmitted to the next operation [16].
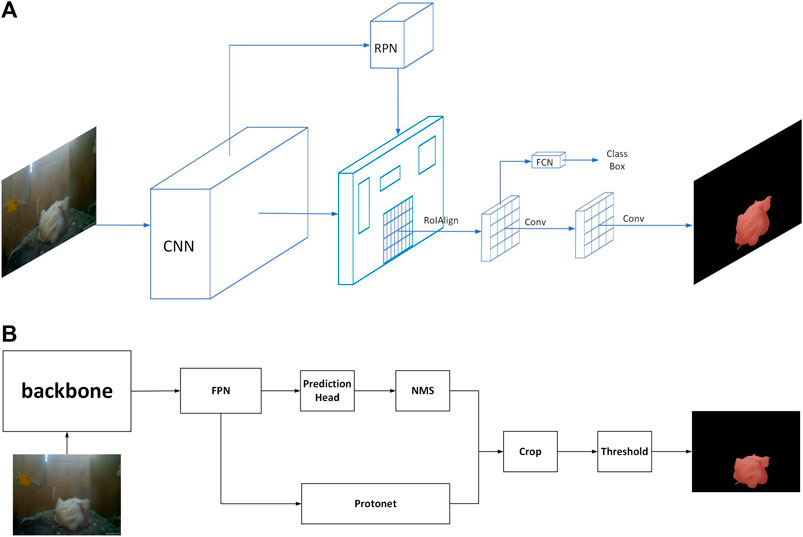
FIGURE 2. Semantic segmentation models structure. (A) Mask R-CNN framework diagram. (B) YOLACT framework diagram.
The regional recommendation network (RPN) obtains several anchor boxes and adjusts them to fit the target better. If multiple anchor boxes overlap, the optimal anchor box is selected for transmission according to the score for the prospect, and the ROI alignment improved by ROI pooling is given for pooling [16]. Finally, boundary box and mask prediction are realized through the fully connected network [16].
2.5.2 YOLACT
YOLACT is a one-stage instance segmentation method that adds mask branches to the target detection network. However, unlike the standard serial way, this method abandons the step of feature location. It divides the instance segmentation task into two parallel subtasks to improve efficiency: prototype mask and target detection. The former uses the network results of the complete convolutional network (FCN) to generate a series of prototype masks that can cover the whole image [17], while the latter predicts the masking coefficient based on the detection branch to obtain the coordinate position of the instance in the image and non-maximum suppression (NMS) screening [17]. The final prediction results are obtained by the linear combination of the two branches.
Figure 2B shows the frame diagram of YOACT. Similar to other networks, this method also performs feature extraction through the backbone network and FPN. One part of the multi-layer FPN is used to generate the prototype mask in the prototype mask branch, and the other part is used to calculate the information such as detection and positioning and mask coefficient through the prediction head network, and then screened through NMS [17]. The processing result is combined with the generated prototype mask, and the final result is obtained.
2.5.3 Semantic segmentation model development
The images were labeled by the open-source image annotation software Labelme. A data set containing 3,000 groups of data was obtained, in which the labeled data were randomly divided into the training set, verification set, and test set, according to 8:1:1.
In this study, Mask R-CNN used a resnet101 network structure. The learning rate of the first 20 epochs was 0.001, and that of the last 40 epochs was 0.0001. There were 1,000 iterations per epoch, 60,000 iterations in total.
YOACT used resnet50 network structure, trained 60,000 iterations, and the initial learning rate was 0.001. It was attenuated in the 20,000 and 40,000 iterations, respectively, and the attenuation was 10% of the current learning rate.
2.6 Video magnification algorithm
Because broilers are small, their belly fluctuates slightly during breathing. To improve the detection accuracy of broilers’ RR, a video magnification algorithm was used to amplify the micromotion of broilers. The Euler video magnification (EVM) algorithm was proposed by Wu et al. [18]. The EVM method mainly includes color space conversion, spatial decomposition, time-domain filtering, linear amplification, and video reconstruction. Spatial decomposition is a multi-spatial resolution image that decomposes the video sequence through the image pyramid. Time-domain filtering filters the images of different scales obtained by spatial decomposition in the frequency domain to obtain the frequency band of interest. Linear amplification linearly amplifies the bandpass filtered signal and adds it to the original signal. Video reconstruction is used to pyramid reconstruct the processed multi-scale image to obtain the enlarged image and then rebuild the video. For example, if a one-dimensional (1D) signal is in the following form[19] as in Eq. 1.
Where
If the first-order Taylor series expansion can express the signal, it can be approximately described as by Eq. 2.
When bandpass filtering is performed on all positions x in signal
Then the signal is amplified by α and added back to
Assuming that the amplified motion
Thus, the band of interest is extracted by a bandpass filter, multiplied by a specific magnification factor, and added back to the original signal to achieve motion amplification. The magnification factor α had a limiting condition (Eq. 7).
Where λ was the spatial wavelength of the signal.
The EVM algorithm is based on the YIQ color space of the image. Before processing, the video image should be converted from RGB space to YIQ space and then back to RGB space. In the process of magnification, however, the information of three-color channels is processed simultaneously, which is time-consuming.
It was found that the abdominal fluctuation of broilers in the video is mainly the change of pixel brightness value. Therefore, the RR estimate did not demand the image’s color information to improve the processing speed, so the image was transferred from RGB to grayscale. The conversion speed was considerably enhanced since the gray image was a single-channel image.
2.7 Contours feature extraction
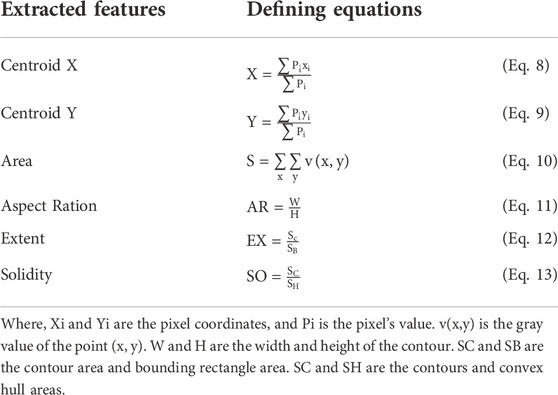
To associate the changes of broiler image with broiler respiration, it is necessary to extract the correlated features. Two 1-min videos were randomly selected, which the broiler images were extracted by the semantic segmentation algorithm. At the same time, we had manually checked the video frame by frame according to the time axis and judged that the frame was in the broiler inspiratory or expiratory state according to the fluctuation state of the broiler belly. By recording these states as the parameter “Breath,” the inspiratory process was set as “1” and the expiratory as “0.” A total of 3,000 frames were obtained, so the parameter “Breath” obtains a total of 3,000 data. Some image contour features were extracted for the segmented broiler images, shown in Table 1.
Using the software SPSS, the Pearson correlation analysis was carried out between each feature and “Breath.”
2.8 Estimation of respiratory rate based on signal power spectral density
The feature which significantly correlated with “Breath” was regard as a time-dependent signal. Then, the signal was transformed into a frequency domain by fast Fourier transform (FFT) [20], and its power spectral density (PSD) [21] was analyzed. After PSD analysis, the frequency with the maximum power density results being the RR estimated by the feature signal.
2.9 Evaluation methods
When evaluating the performance of the semantic segmentation algorithm, the accuracy P and intersection over union (IoU) were used (Eq. 14 and Eq. 15).
Where TP is the total number of correctly segmented pixels, the total number of incorrectly segmented pixels, and the total number of missed pixels.
We used three indicators, mean absolute error (RRme), root mean squared error (RMSE), average accuracy (RRacc), to evaluate the effects of the broiler RR estimation models (Eqs 16–18).
Where RRD is the RR detected by RR-D and RR-D-EVM, RRm is the RR observed manually. N is the number of tested videos.
3 Results and discussions
3.1 Semantic segmentation algorithm
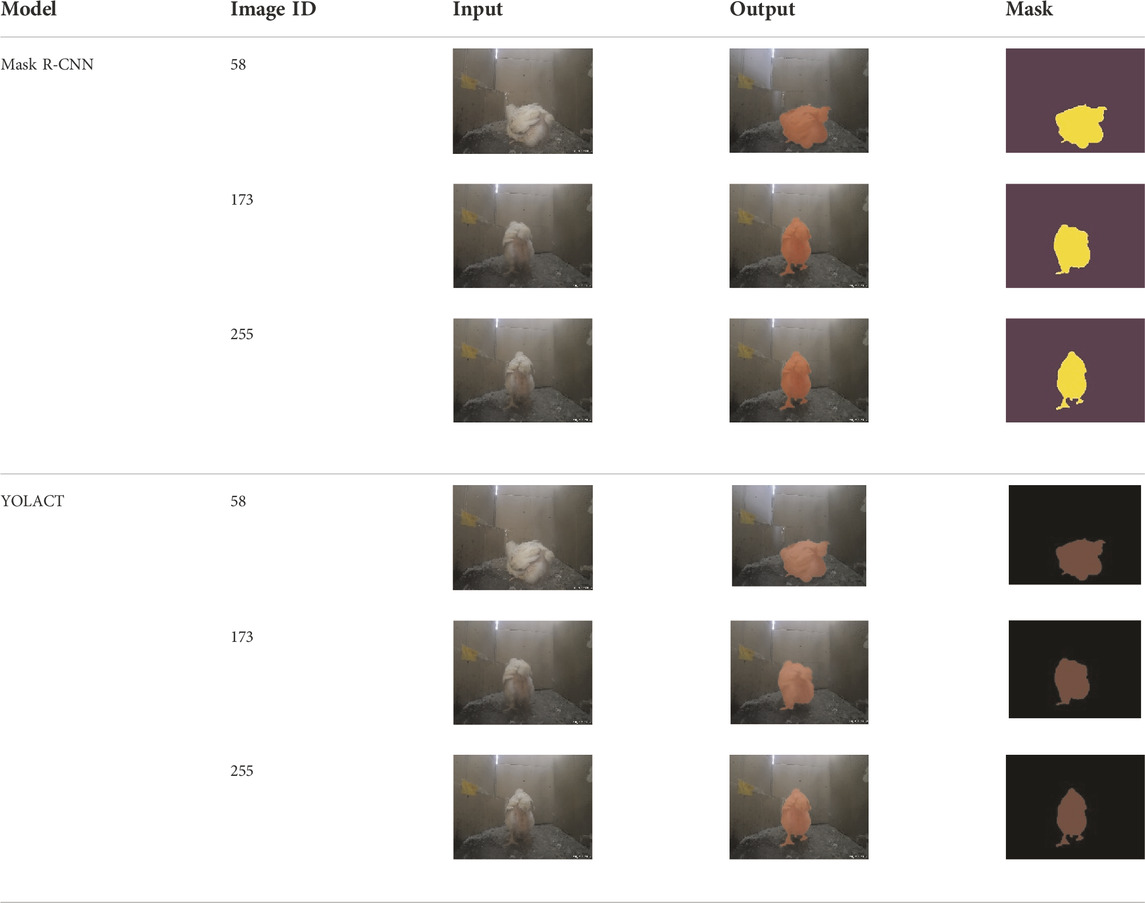
The two semantic segmentation models have been evaluated with the test dataset. Table 2 shows the segmentation results of Mask R-CNN and YOACT models in this study. The average accuracy of the YOLACT results is 95%, and the average IoU is 94%; the average accuracy of Mask R-CNN is 95%, and the average IoU is 90%.
3.2 Feature acquisition
The results of Pearson correlation analysis between contours features and “Breath” are shown in Table 3. It can be found that the feature “Centroid Y” is significantly correlated with “Breath” (p > 0.4), while “Centroid X” is weakly correlated (0.1 < |P| < 0.2) and the feature “Area,” “Aspect Ratio,” “Extent,” “Solidity” is not significantly correlated (|P| < 0.1). Therefore, this study applied “Centroid Y” as the feature for RR estimation.
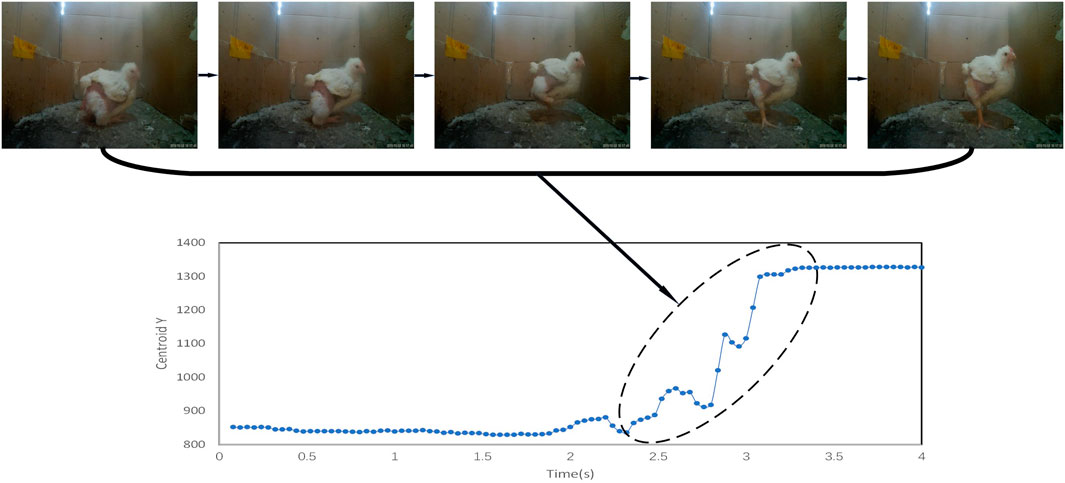
According to Eq. 9, the “Centroid Y” is affected by the height of the broiler contour in the image and the different postures influenced the height of the broiler contour, thus, it is necessary to eliminate the impact of these different poses. Based on manual observation and ethograms by [22,23], the broiler postures were divided as standing, lying, and hanging their heads.
During the posture transformation of broilers, the “Centroid Y” changes considerably. As shown in Figure 3, “Centroid Y” suddenly increases due to the changes of broilers from lying to standing posture. Considering that this study regarded the “Centroid Y” as a time-dependent signal, then the broilers’ posture changes will influence the signal trend. Because the signal is assumed to be stable in power spectral density (PSD), hence, it is necessary to eliminate the signal trend caused by posture changes.
The smoot priors approach (SPA) by Tarvainen et al. [24] is an effective nonlinear signal detrending method and is often used to process human ECG signals. The SPA algorithm was used to detrend the “Centroid Y” signal. Figure 4 shows the “Centroid Y” signal obtained from a 10-s video. Due to the changes in broiler posture from standing to lying, the “Centroid Y” signal has an apparent trend change. After the processing with the detrend algorithm, the signal trend caused by posture change was eliminated, as shown in Figure 4.
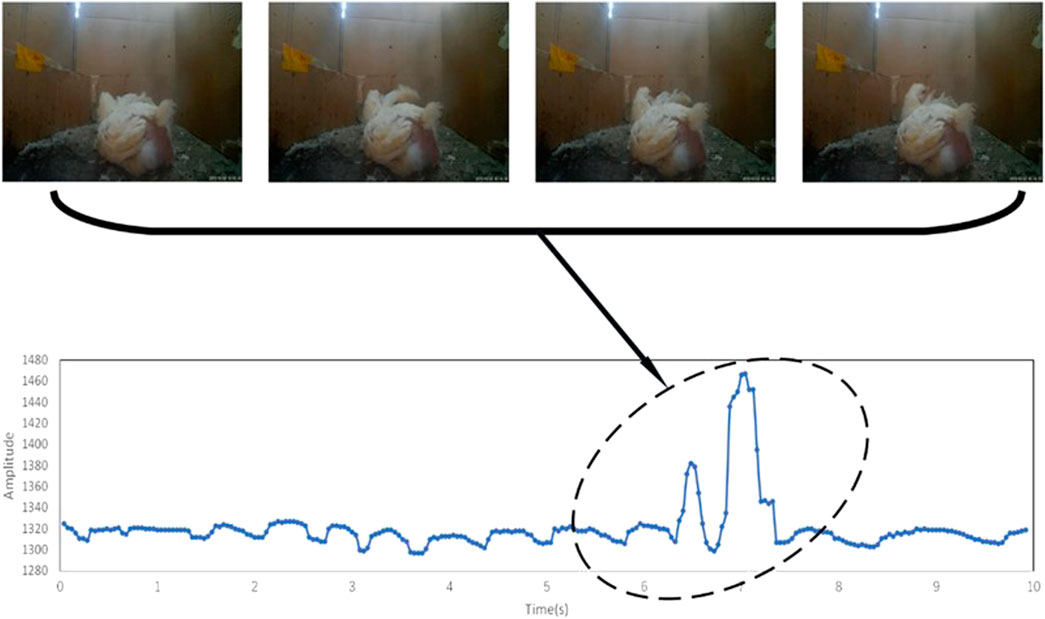
It was also observed that the broilers frequently movements, i.e., flipping of wings and walking. These movements lead to the change in the “Centroid Y,” as shown in Figure 5, where the broiler flipping of wings caused the signal to change.
A band-pass filter was used to filter the noise caused by the movement of broilers. As shown in Figure 6, the signal fluctuated due to the wing shaking of the broiler. After band-pass filtering, the processed signal filter the noise and eliminate the influence of wing shaking.
3.3 Respiratory rate estimation
According to “Broiler production,” the RR of broilers are different at different ages [25]. The RR of young broilers is higher, reaching up to 65 times per minute on average. After 21 days of age, the RR of broilers decreases to about 45 times per minute. Besides, stress influences the RR significantly. RR reaches 130 times per minute or even more when the broiler suffers from thermal stress. Therefore, considering the influence of age and stress on RR, the range of broiler RR was set as 25–150.
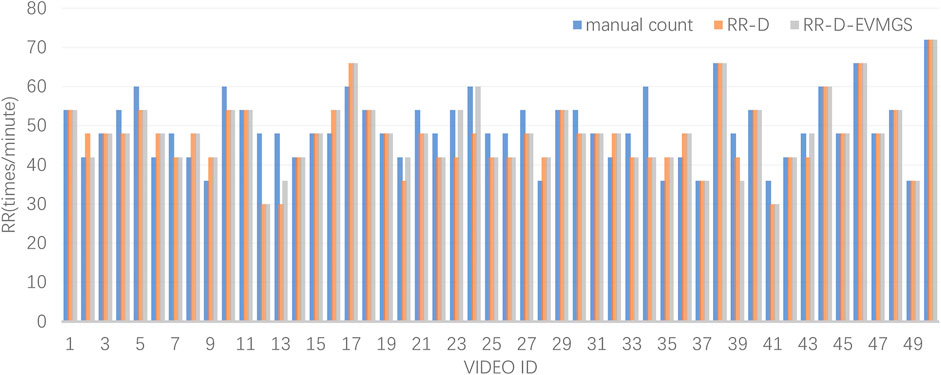
In this study, two RR estimation techniques were explored, i.e., without video magnification algorithm (RR-D), and with video magnification algorithm (RR-D-EVMGS). Fifty 10-s videos were randomly selected from the dataset to test the two methods’ performance. The test result is shown in Figure 7.
The evaluation results of the two models are shown in Table 4.
3.4 Euler video magnification based on grayscale
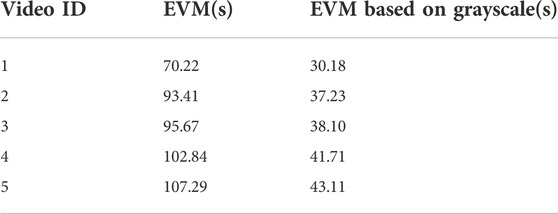
The speed of the EVM algorithm based on grayscale had been improved. Table 5 shows the time consumed by two algorithms for processing the same five videos on the same computer (CPU 4500 u, 4 GHZ). In this study, the speed of EVM based on grayscale was improved by more than 55% compared with EVM.
3.5 Performance evaluation
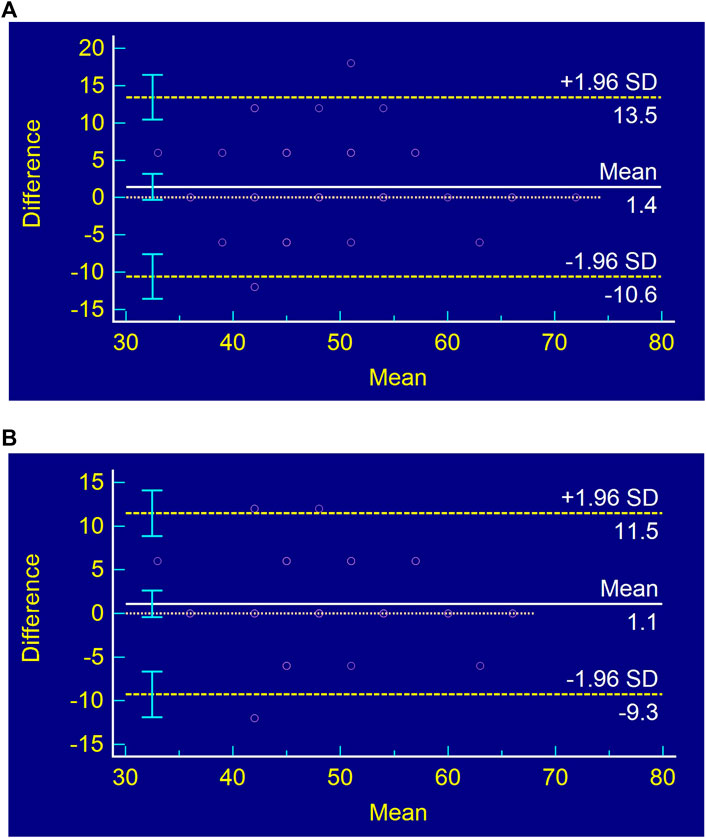
To test the non-contact broiler RR estimation method proposed in this paper, it is necessary to compare the results obtained by this method and the reference standard (expert visual manual count). To keep the consistency between the proposed method and the reference standard, the Bland-Altman way [26] was used to evaluate the consistency between the results of RR-D, RR-D-EVMGS, and expert visual manual count.
As shown in Figure 8, the x-axis is the mean of the RR estimated by RR-D, RR-D-EVMGS, and expert visual manual count, and the y-axis is the difference between them. The 95% consistency interval for RR-D and RR-D-EVMGS between expert visual manual count is (−10.57, 13.45) and (−9.27, 11.48), respectively. It can be observed that most of the RR data measured by the two methods are within the confidence interval, indicating that the consistency between RR-D, RR-D-EVMGS, and the expert visual manual count is good.
3.6 Influence of factors that affects the estimation of respiratory rate
Due to the broiler farming environment being complex and dynamic, in addition to the broiler moving frequently, there is numerous interferences affecting the performance of the broiler RR estimation. Therefore, these interference factors were analyzed to verify the effectiveness of the proposed method.
3.6.1 Effects of the angles between broiler and camera on the estimation of respiratory rate
Because the camera was fixed and the broiler would move freely, there were different angles between the broiler and the camera. According to the angle of Broiler in the video, we divided the data into three kinds: frontal, lateral, and back. Five 1-min videos were selected from each of the three kinds and tested with RR-D-EVMGS. The results are shown in Table 6. It can be seen that the estimation of frontal performance is worst. We suspect that this is because the bird’s head is stable, so when the front of the broiler faces the camera, the respiratory body movement is less evident than that of the back and lateral.
3.6.2 Influence of breathing rate perturbation on the estimation of respiratory rate
Because the RR of broilers is affected by age, health, and environment, the RR varies greatly. Since our data were obtained when the broiler were calm and no stress, their RR was stable. To verify the estimation effect of the proposed method in the case of fluctuation of RR, we randomly selected ten 1-min videos, twice accelerated the first and last 250 frames, and kept the other frames unchanged, to simulate the fluctuation of broiler RR, and then estimated it with the method we proposed. The RR estimation results are shown in Table 7. It can be seen from the table that the method proposed in this paper performed well on the accelerated video; accuracy was reduced by less than 1%. We deem that is because we extract each frame of the video, the sampling frequency is much greater than twice the upper limit of RR, which meets Shannon’s sampling theorem. Therefore, the method proposed in this paper can be used to estimate the RR of broiler under special conditions, such as heat stress.
3.6.3 Analysis on the causes of poor estimation effect
According to the test result, Figure 7, it could be found that the estimation results of videos 12 and 13 were the worst, and the error reached 37.5%. By checking the original video, it was found that the broiler was too close to the camera, resulting in the broiler’s body occupying almost the whole image. RR-D and RR-D-EVMGS had poor performance on video 33, with an error of 30%. Checking the original video, it emerged that part of the body walked out of the camera due to the movement of the broiler, and the complete image of the broiler could not be extracted. Therefore, the main factors affecting the estimation accuracy of the two methods were the distance between the broiler and the camera and whether the complete body contour of the broiler could be extracted. The method proposed in this study realizes the estimation of RR of broilers without contact and stress. It can be used to remotely diagnose respiratory-related diseases and monitor the stress of broiler (such as heat stress). The method used in this study is portable and can be extended to different objects, such as ducks, geese, etc. And we will also try to verify the performance of this method on other objects in the future.
4 Conclusion
A non-stressful, contactless approach of RR estimate for broilers is presented in this research. Compared to the animal respiration rate detection methods proposed by Xie et al. [7] and Stewart et al. [8] and others, this study was aimed at a smaller subject with more complex applying environment, which means it was much more challenging to achieve respiration rate estimation. This results in a lack of contact-free RR estimate techniques for tiny birds like broilers. Using the semantic segmentation technique, the broiler pictures could be successfully retrieved from the complicated backdrop, with an extraction accuracy of 95%. We came to the conclusion that “Centroid Y” would be the ideal way to estimate broiler respiration and presented the RR-D-EVMGS and RR-D approaches. The performance of the two methods was compared in 50 videos, and in RRme, RMSE, and RRacc, RR-D-EVMGS performed better than RR-D. Through the Consistency evaluation with the manual measures, the results of the two methods were consistent with the manually measured results. The method proposed in this study can be applied to farming robots, such as the poultry health monitoring robot developed by Nanjing Agricultural University. And the method proposed in this study can be generalised to other small-sized birds for contactless RR estimation, such as ducks and geese. Because this study was still preliminary, there were some problems that needed to be further solved. For example, although this study used a single-channel Euler video magnification algorithm to improve the computing speed, it still took much longer time to achieve real-time detection. To address this matter, the algorithm requires further optimisation in the future. Although the results obtained are still preliminary, we believe that this contactless detection of broiler RR has a promising prospect. It can provide technical support for broilers’ respiratory diseases and heat stress monitoring.
Data availability statement
The datasets presented in this article are not readily available because this study is part of some ongoing projects, the datasets generated and/or analysed in the study are not publicly available at this time. Requests to access the datasets should be directed to 2018212012@njau.edu.cn.
Ethics statement
The animal study was reviewed and approved by the Biosafety Committee of Nanjing Agricultural University.
Author contributions
Conceptualization, JW; Methodology, JW, MS, CO, LL, and ML; Software, JW, CO, and LL; Formal analysis, JW, DL, CO, and MG; Investigation, LL; Writing—original draft preparation, JW and CO; Writing—review and editing, JW, DL, MG, and CO; Supervision, MS, ML, and MG. All authors have read and agreed to the published version of the manuscript.
Conflict of interest
The authors declare that the research was conducted in the absence of any commercial or financial relationships that could be construed as a potential conflict of interest.
Publisher’s note
All claims expressed in this article are solely those of the authors and do not necessarily represent those of their affiliated organizations, or those of the publisher, the editors and the reviewers. Any product that may be evaluated in this article, or claim that may be made by its manufacturer, is not guaranteed or endorsed by the publisher.
References
1. Fao . Food and Agriculture Organization of the United Nations. The future of food and agriculture—alternative pathways to 2050. Rome: Fao (2018).
3. Alexandratos N, Bruinsma J. World agriculture towards 2030/2050: The 2012 revision. Rome: FAO (2012).
4. Henchion M, Mccarthy M, Resconi VC, Troy D. Meat consumption: Trends and quality matters. Meat Sci (2014) 98(3):561–8. doi:10.1016/j.meatsci.2014.06.007
5. Nascimento ST, Silva IJOD, Mourão GB, Castro ACD. Bands of respiratory rate and cloacal temperature for different broiler chicken strains. R Bras Zootec (2012) 41:1318–24. doi:10.1590/s1516-35982012000500033
6. El HH, Sykes AH. Thermal panting and respiratory alkalosis in the laying hen. Br Poult Sci (1982) 23(1):49–57. doi:10.1080/00071688208447928
7. Xie H, Ji B, Hu H, Yang P, Shen Y. A waveform model based on curvature radius for swine's abdominal breathing. J Suzhou Univ Sci Technology (Natural Sci Edition) (2016) 33 (3): 66–70. doi:10.3969/j.issn.1672-0687.2016.03.013
8. Stewart M, Wilson MT, Schaefer AL, Huddart F, Sutherland MA. The use of infrared thermography and accelerometers for remote monitoring of dairy cow health and welfare. J Dairy Sci (2017) 100(5):3893–901. doi:10.3168/jds.2016-12055
9. Zhao K, He D, Wang E. Detection of breathing rate and abnormity of dairy cattle based on video analysis. Nongye Jixie Xuebao= Trans Chin Soc Agric Machinery (2014) 45(10):258–63. doi:10.6041/j.issn.1000-1298.2014.10.040
10. Song HB, Wu DH, Yin XQ, Jiang B, He DJ. Respiratory behavior detection of cow based on Lucas-Kanade sparse optical flow algorithm. Trans Chin Soc Agric Eng (2019) 35(17):215–24. doi:10.11975/j.issn.1002-6819.2019.17.026
11. Okinda C, Lu M, Liu L, Nyalala I, Muneri C, Wang J, et al. A machine vision system for early detection and prediction of sick birds: A broiler chicken model. Biosyst Eng (2019) 188:229–42. doi:10.1016/j.biosystemseng.2019.09.015
12. Wang J, Shen M, Liu L, Xu Y, Okinda C. Recognition and classification of broiler droppings based on deep convolutional neural network. J Sensors (2019) 2019:1–10. doi:10.1155/2019/3823515
13. Otsu N. A threshold selection method from gray-level histograms. IEEE Trans Syst Man Cybern (1979) 9(1):62–6. doi:10.1109/tsmc.1979.4310076
14. Beucher S., Meyer F. Segmentation: The watershed transformation. Mathematical morphology in image processing. Opt Eng (1993) 34:433–81. doi:10.1007/978-94-011-1040-2_10
15. Canny J. A computational approach to edge detection. Ieee Trans Pattern Anal Machine Intelligence (1986) 6:679–98. doi:10.1109/TPAMI.1986.4767851
16. He K, Gkioxari G, Dollar P, Girshick R. Mask R-CNN. IEEE Trans Pattern Anal Mach Intell (2020) 42(2):386–97. doi:10.1109/TPAMI.2018.2844175
17. Bolya D, Zhou C, Xiao F, & Lee YJ. Yolact: Real-time instance segmentation. In: Proceedings of the 2019 IEEE/CVF International Conference on Computer Vision (ICCV); October 2019; Seoul, Korea (South) (2019). p. 9157–66.
18. Wu H, Rubinstein M, Shih E, Guttag J, Durand F, Freeman W. Eulerian video magnification for revealing subtle changes in the world. ACM Trans Graph (2012) 31(4):1–8. doi:10.1145/2185520.2185561
19. Lucas BD, Kanade T. An iterative image registration technique with an application to stereo vision. In: Proceedings of the 7th international joint conference on Artificial intelligence; August 1987; Vancouver Canada (1981). p. 674–9.
20. Cooley JW, Tukey JW. An algorithm for the machine calculation of complex Fourier series. Mathematics Comput (1965) 19(90):297–301.
21. Howard RM. Principles of random signal analysis and low noise design: The power spectral density and its applications. Hoboken, NY, USA: John Wiley & Sons (2004).
22. Pereira DF, Miyamoto BC, Maia GD, Sales GT, Magalhães MM, Gates RS. Machine vision to identify broiler breeder behavior. Comput Electronics Agric (2013) 99:194–9. doi:10.1016/j.compag.2013.09.012
23. Kristensen HH, Prescott NB, Perry GC, Ladewig J, Ersbøll AK, Overvad KC, et al. The behaviour of broiler chickens in different light sources and illuminances. Appl Anim Behav Sci (2007) 103(1-2):75–89. doi:10.1016/j.applanim.2006.04.017
24. Tarvainen MP, Ranta-Aho PO, Karjalainen PA. An advanced detrending method with application to HRV analysis. IEEE Trans Biomed Eng (2002) 49(2):172–5. doi:10.1109/10.979357
Keywords: broiler, respiration rate, computer vision, semantic segmentation, Euler video magnification
Citation: Wang J, Liu L, Lu M, Okinda C, Lovarelli D, Guarino M and Shen M (2022) The estimation of broiler respiration rate based on the semantic segmentation and video amplification. Front. Phys. 10:1047077. doi: 10.3389/fphy.2022.1047077
Received: 17 September 2022; Accepted: 11 November 2022;
Published: 21 December 2022.
Edited by:
Leizi Jiao, Beijing Academy of Agriculture and Forestry Sciences, ChinaReviewed by:
Shen Weizheng, Northeast Agricultural University, ChinaDeqin Xiao, South China Agricultural University, China
Copyright © 2022 Wang, Liu, Lu, Okinda, Lovarelli, Guarino and Shen. This is an open-access article distributed under the terms of the Creative Commons Attribution License (CC BY). The use, distribution or reproduction in other forums is permitted, provided the original author(s) and the copyright owner(s) are credited and that the original publication in this journal is cited, in accordance with accepted academic practice. No use, distribution or reproduction is permitted which does not comply with these terms.
*Correspondence: Mingxia Shen, bWluZ3hpYUBuamF1LmVkdS5jbg==
 Jintao Wang
 Longshen Liu2
 Mingzhou Lu
 Daniela Lovarelli
 Marcella Guarino