
95% of researchers rate our articles as excellent or good
Learn more about the work of our research integrity team to safeguard the quality of each article we publish.
Find out more
ORIGINAL RESEARCH article
Front. Phys. , 12 January 2023
Sec. Social Physics
Volume 10 - 2022 | https://doi.org/10.3389/fphy.2022.1044049
This article is part of the Research Topic Tipping Points in Societies View all 7 articles
 Setsuya Kurahashi1*
 Taisei Mukai2
 Yukari Sekine3
 Keisuke Nakajima3
 Keiko Otake3
 Junichi Sugiyama3
 Takeshi Takizawa3
 Yasushi Kakizawa3
COVID-19 infection has been reported to be caused by droplet and contact infection. This paper proposes a model that visualizes the risk of contact infection to family members when viruses spread to various items at home. Behavior data after returning home are extracted from a questionnaire-based survey of home behavior to design the agent-based model. The data tables of contact behavior are created, including the room-to-room transfer probability table, the conditional probability table, and the contact probability table. The material transfer efficiency table is also created by measuring the virus transmission rate after contact with droplets in a virus experiment laboratory. In the experiment, the synthetic agent created from the acquired data probabilistically performs movement and contact behavior after returning home and reproduces the state in which the virus attached to the hand or belongings, when going out, propagates to objects at home. Next, we examine the risk of a second family member returning home. As a result, virus-attached contacts within around 30 minutes after returning home are widely confirmed around the entrance and kitchen, suggesting the effectiveness of early hand-washing behavior. And the experiment shows that even if the first person returning home disinfects their hands inside the entrance, the virus remains in a part of the entrance, and the virus is spread inside the room by the second person returning home.
A series of new coronavirus variants have increased the infectivity of the virus, and its rapid spread has continued to stress the limits of the domestic healthcare system. New coronavirus (COVID-19) infection has been reported to be caused by two factors. The first is droplet infection, which occurs when droplets that have drifted into the air through conversation are inhaled. The second is contact infection, in which droplets on desks and personal belongings are transmitted to the mouth via the hands and other parts of the body. In droplet infection, droplets containing viruses emitted from the exhaled breath of an infected person become micro-droplets and float in the air, increasing the risk of infection for those who inhale them. For such droplet infection, it has been found that masks, exhaust ventilation, and window openings are effective in preventing infection. On the other hand, contact infection occurs when viruses on tables, dishes, handrails, and portable items are transferred to the hands of those who touch them, ultimately through the mucous membranes of the mouth and other parts of the body. Thus, contact infection cannot be prevented by measures such as exhaust ventilation and masks.
Other factors that contribute to the spread of infection include bringing the virus from outside sources, such as schools and workplaces, and the increased risk of infection in the home from family members who are forced to receive isolated care at home after infection due to medical tightness.
Therefore, in this study, we focus on the latter type of contact infection and construct a model that reproduces the spread of viruses from hands and personal belongings to various places in the home when going out. Data such as location, behavior, and contacted objects are extracted from a questionnaire-based survey of post-return home behavior, and the probability table of flow line, the distribution table of number of contacts, the probability table of initial action and the probability table of contact behavior transmission are created. The automatic layout creation function sets up multiple floor plans, and agents acting based on the created probability tables repeatedly carry out contact behavior in the home and visualize the risk of virus contact to family members based on the number of viruses adhered.
Many COVID-19 infection simulation models have been constructed and have produced results. Kissler et al. [1] published a paper that considered the seasonality of coronaviruses and cross-immunity, and suggested that long and intermittent social distance would be necessary to maintain the healthcare system. The paper also suggested that surveillance should be maintained because the infection may repeatedly recur even when it appears to have disappeared. The method used was a combination of a statistical regression model based on previous coronavirus infection data and a mathematical simulation model.
The analysis of COVID-19 infections in Germany reported by the Max Planck Institute showed that the timing of official interventions implemented by the government and the point of change in the spread of infection can be detected from the number of infected persons and intervention data. The model then showed that the exponential increase in infection resumes as soon as the intervention is lifted, such as curfew restrictions or store closures. The model used in the analysis was a combination of an epidemiological simulation model and statistical Bayesian estimation. The analysis of [2] also proposed an individual-based model that integrated infection data and information models, using the results of a close examination of data on infected individuals in the United Kingdom and a detailed analysis of the effects of social distance, follow-up surveys, PCR testing, and other measures.
On the other hand, these studies have focused on infection phenomena at the urban population level and have not been able to examine individual infection prevention measures at the workplace or in the home.
Jaramillo et al. [3] constructed an agent-based model for contact transmission of Staphylococcus aureus MRSA, which causes nosocomial infections, and estimated the rate of MRSA transmission and other factors. It has been suggested that common routes of transmission are the hands of medical staff, medical equipment, and personal belongings, and the transmission may take place via interactions between patients and the healthcare organization. The model consists of passive environmental objects and active medical staff agents to simulate nosocomial infections. Experimental results showed that the number of patient arrivals and hand-washing rates influenced the number of infections. However, the study is relatively abstract, as it is based within a healthcare organization, and the basis for setting movement and contact rates within the healthcare organization is not provided.
Peleg et al. [4] also developed a model of microbial survival by disinfectants such as chlorinated water and theoretically estimated microbial inactivation using a differential equation model. The Weibull distribution function was used as the probability distribution, and the required concentration of disinfectant was determined by deriving a survival curve depending on the concentration of disinfectant. The model theoretically demonstrates the effectiveness of disinfectants but does not refer to the spread of viruses through domestic behavior.
Mokhtari et al. [5] developed an agent-based model of microbial persistence and spread in food facilities, simulating a spatially dynamic system representing the hygiene behavior of food handlers and their interactions between the facility environment and food products. Experimental results showed that areas not in direct contact with food (loading docks and toilets) could act as contamination sites and recontaminate regions in direct contact with food. However, the data used as cases are based on assumptions and do not reproduce existing facilities or behavior.
Mori et al. [6] examined the effect of hand-washing on virus removal and measured the effect of washing with water and firmer washing with soapy water on reducing the number of viruses, using viruses of the same family as noroviruses, Caliciviridae. Murata [7] and Yasugi [8] also conducted experiments on the inactivation effect of ozonated water on resistant bacteria using virus solutions.
Katsumi et al. [9] performed a statistical analysis of the SARS-CoV-2 virus copy number and virus titer in positive samples and estimated that 1TCID50 (50% Tissue Culture Infectious Dose), which represents the concentration of virus when half of the host cells are infected with the virus, is approximately 944 copies/µL.
Kurahashi et al. [10] constructed an agent-based model and an SEIR model of infection in a suburban area and estimated the effect of infection prevention measures called for in an emergency declaration. The results showed that the number of friends for dinner together in restaurants and the frequency of meetings affected the control of the spread of infection. However, this study used a fixed probability for infection in the home and did not take into account differences in behavior after returning home. In addition, the study targets droplet infection, in which the distance from the infected person and the duration of conversation are used as risk indicators, and does not address the risk of contact infection, in which the virus is transmitted through the fingers and other parts of the body.
Madewell et.al [11]. and Yang et.al [12]. synthesized the available evidence on household studies of SARS-CoV-2. The combined household and family secondary attack rate was 16.6% (95% CI, 14.0%–19.3%). This point estimate is higher than previously observed secondary attack rates for SARS-CoV and MERS-CoV. Household and family contacts are at higher risk than other types of close contacts. Dutta et.al [13]. estimated the household transmission of COVID-19 and assess the factors affecting transmission. It found mild negative correlation between rooms per person. Maestre et.al; [14]. investigated the distribution and persistence of SARS-CoV-2 in a home with COVID-19 positive occupants, samples were collected from a household with two confirmed COVID-19 cases (one adult and one child). Of the 24 surfaces sampled, 46% were SARS-CoV-2 positive at the time of sampling. Ciunkiewicz et.al [15]. proposed an agent-based simulation, which uses an agent-based epidemiological model to simulate the spread of COVID-19 within an elderly care facility. Results generated by this proof of concept model were focused on the 16 possible mask and vaccine combinations defined, and the model quantified this risk to provide actionable insights to manage occupant capacity and spatial organization such as seating arrangements. Although these studies focus on infections in homes and institutions, they focus primarily on droplet transmission. Therefore, they do not consider the risk of contact transmission due to viruses on the body or belongings brought in from outside. In addition, behavioral observations of residents in the home or facility were not conducted.
As described above, almost all the previous studies have investigated droplet infection. The studies of contact infection have also focused on the effect of hand-washing with running water and soapy water, and the effect of ozone water on reducing bacterial resistance in medical institutions. There are a small number of studies based on actual surveys on contact infection risk at home. It is an issue in COVID-19 infection studies. In this study, we conducted a survey of residents’ behavioral history in their own homes, used the survey results to construct a household contact infection model and conducted a simulation experiment.
In order to visualize virus spread associated with contact behavior after going out and returning home, we reproduce the state in which viruses adhering to hands when going out are tranfered to various items at home by the behavior of people returning home. For this purpose, we constructed an agent-based model to estimate the risk of contact transmission and the effects of hand-washing behavior, etc.
We extracted data on location, behavior, and contact items from approximately 1,100 surveys of people’s behavior after returning home conducted by the University of Tsukuba and Lion Corporation. In this survey, 1,105 valid responses (600 males, 502 females, and three non-responses by gender) were asked to fill in their behavior for 30 min from the time they returned home. By extracting data on location, behavior, and contact objects, we analyzed the relative frequency of visits to each room (Blue bars in Figure 2), frequency of contacts (Blue bars in Figure 3), time spent, and final arrival location.
From those data, we created the room-to-room transfer probability table, the conditional probability table P(C|A, B), which are the probability of moving from point A to point C via point B, and the contact probability table (Table 1; Table 2; Table 3). We also created a material transfer efficiency table that measured the virus distributed between the model skin and each material through laboratory contact experiments using influenza viruses as a proxy for novel coronaviruses (Table 4).
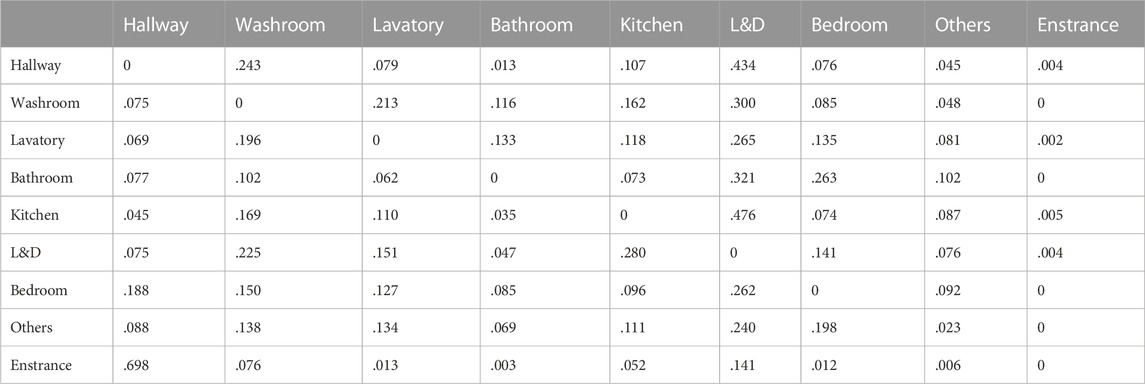
TABLE 1. The room-to-room transfer probability table.
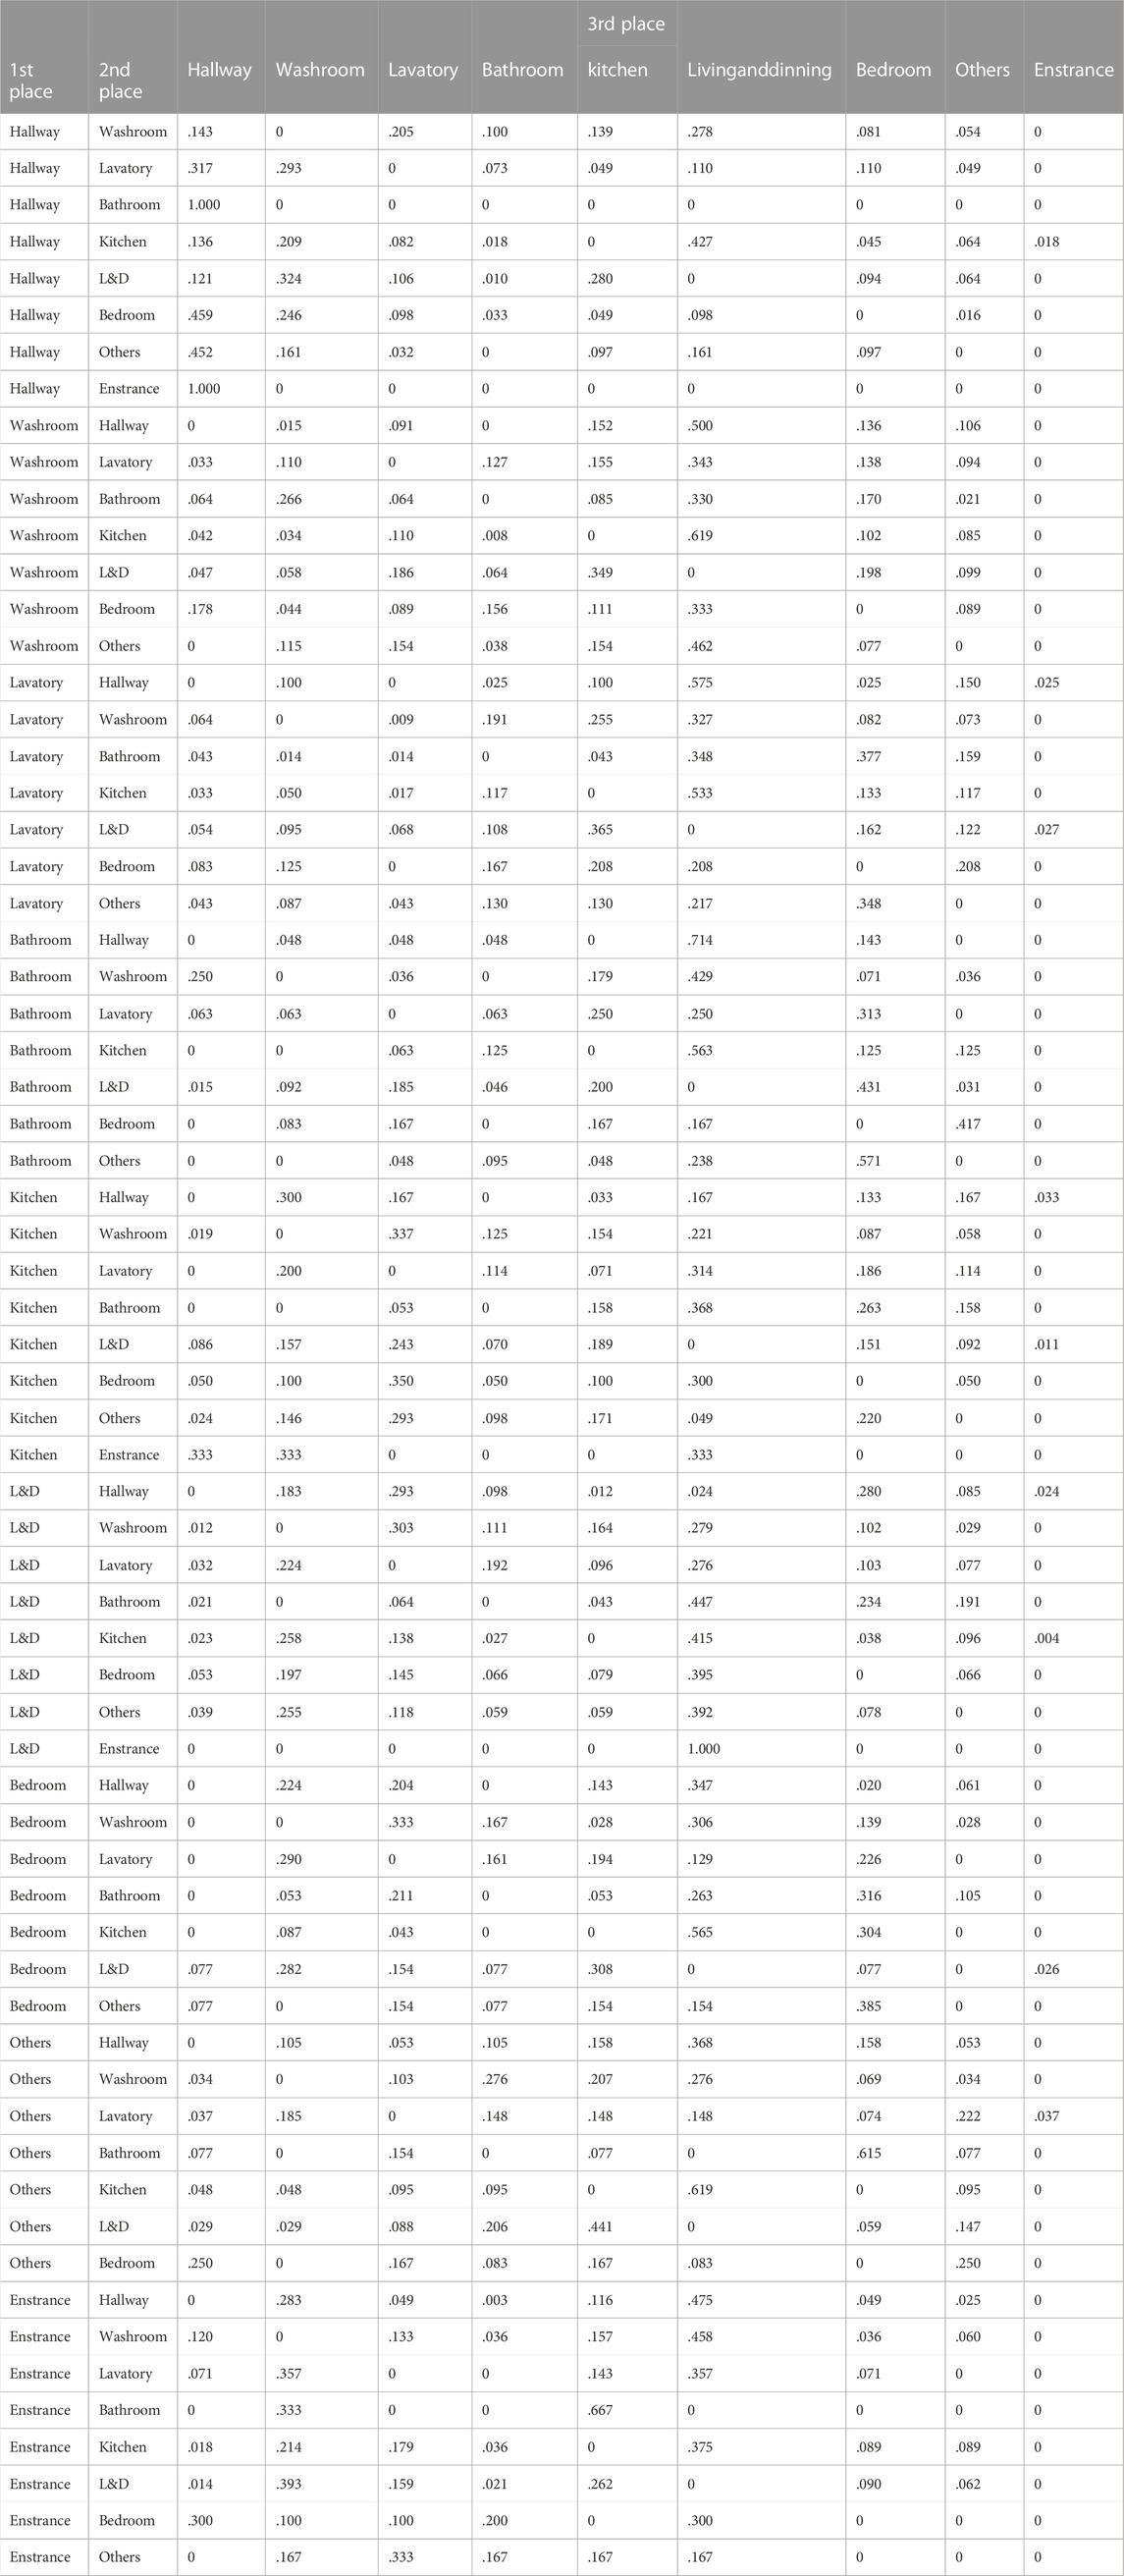
TABLE 2. The room-to-room transfer conditional probability table.
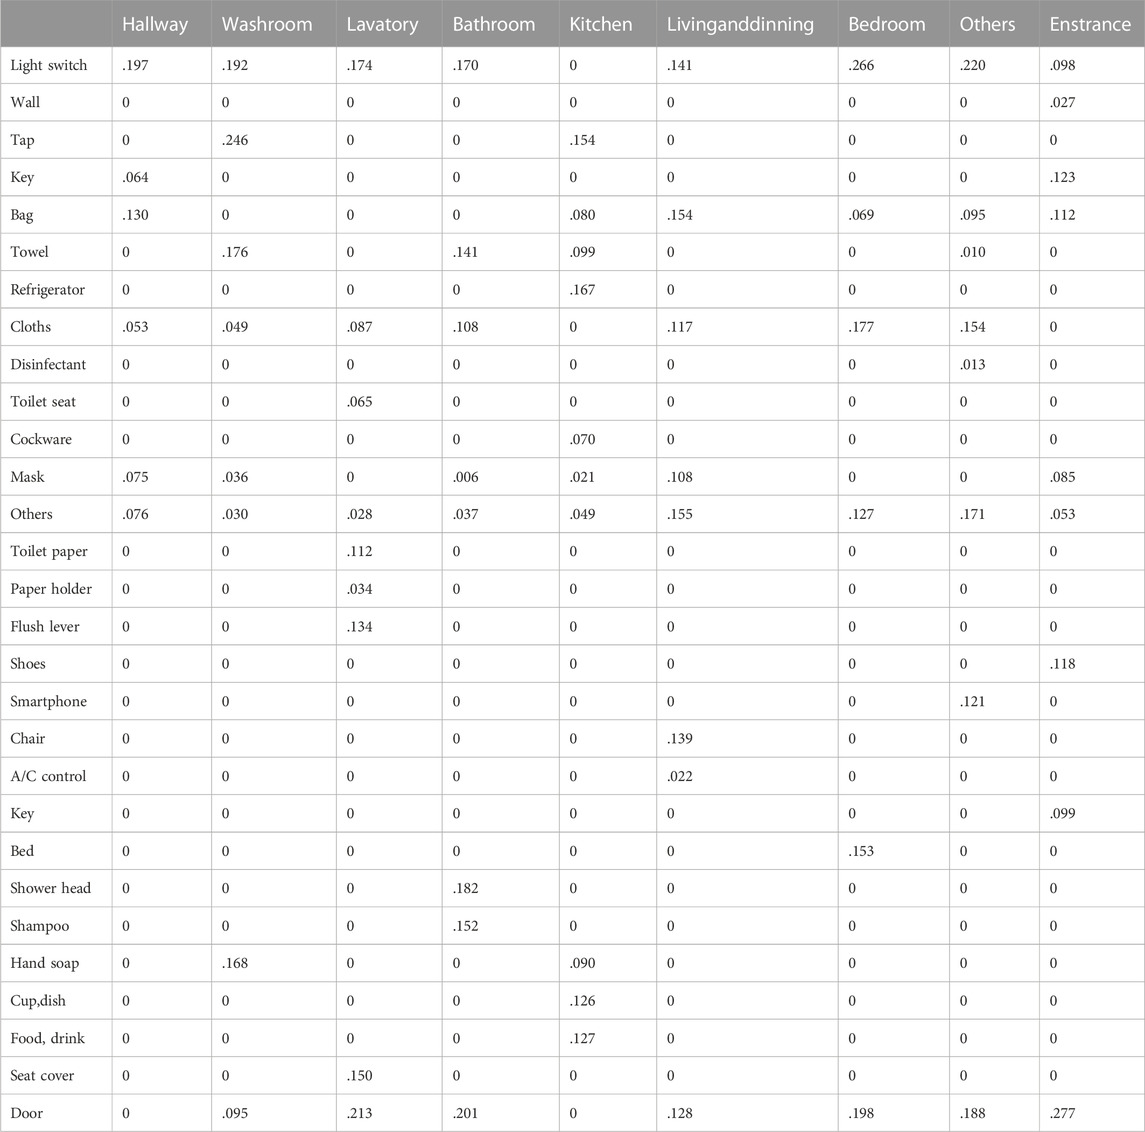
TABLE 3. The contact probability table.
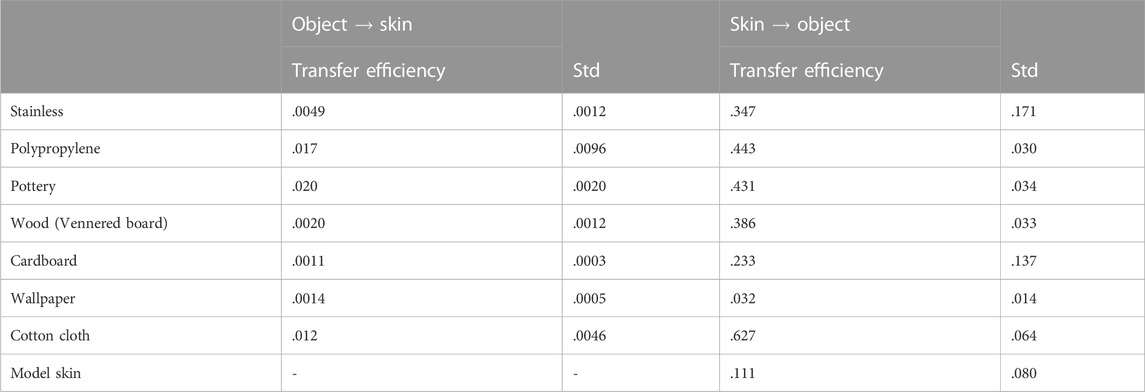
TABLE 4. Viral transfer efficiency (Dry state).
The skin model was made of protein leather, which has a tactile feel similar to human skin and is also used for cosmetic application tests. Distribution tests of the dried virus were conducted as follows. Virus droplets were dropped onto various substrates and allowed to stand for 40 min under conditions of 40–60%RH to dry the droplets naturally. The droplets were then brought into contact with the substrate from above vertically for 5 seconds at a force of 10 g/m3, which is the load applied when a hand lightly touches the surface of the substrate. The virus transfer efficiency from each surface was calculated as follows.
We also realized that the transfer efficiency decreases as the number of contacts increases. It decreased to about .09 of the first contact at the 8th contact if the transfer efficiency of the first contact is set to 1. Therefore, we estimated an approximate expression (y = .88x−1.27, R2 = .79) for the decreasing effect of multiple contacts. We introduced it into the model and counted the number of contacts for each agent to correct for the reduction in virus transmission rate due to consecutive contacts.
Using the analysis, we constructed an agent-based model to visualize the risk of contact transmission in the home, which can be configured with various floor plans. In this model, an agent that acts based on various probability tables repeatedly moves between rooms in the home and contacts the virus. Therefore, it can estimate the risk of re-contacting the virus based on the number of viruses attached to the agent. An example of the flow line survey is shown in Figure 1. The most frequent behavior patterns after returning home are as follows: 1st step: 1) entrance → hallway → living-dining room, 2) entrance → hallway → bathroom, 3) entrance → hallway → kitchen, 2nd step: 1) living-dining room → bathroom, 2) living-dining room → kitchen, 3) living-dining room → bathroom, 3rd step: 1) kitchen → living-dining room 2) kitchen → washroom 3) kitchen → lavatory. Thus, there were a certain number of cases of moving indoors without washing hands at an early stage.
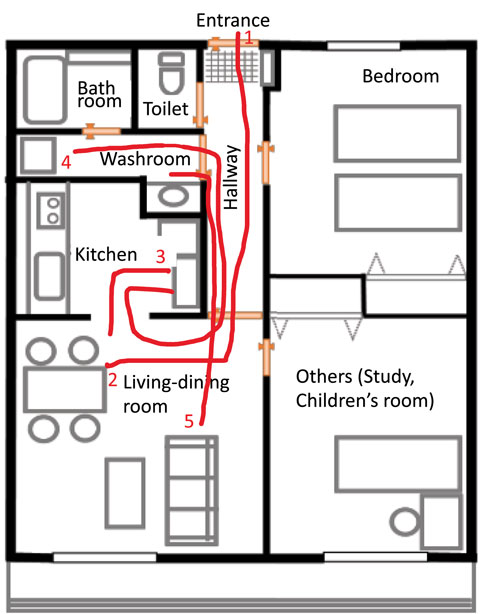
FIGURE 1. An example of the behavior survey.
In this model, there is no explicit decision maker. However, it consists of agents whose actions are based on each individual’s behavioral preferences determined probabilistically and viral distribution rates obtained from survey data. Each agent and each item in the room interacts with each other through viral contact, which also involves interaction with other agents. We also aim to estimate the effectiveness of infection prevention measures, such as agents’ hand-washing methods, the location and timing of disinfection, and we employed an agent-based model that allows for these measures.
Resident agents returning home move through the rooms in the home on this layout according to the probabilities of flow line analyzed from the behavioral survey after returning home. The probabilities of flow line were set from the From-To probability table for rooms and corridors and the conditional probability table for continuous movement between rooms. These were tuned to approximate the measured transition probabilities by adjusting them in conjunction with the stop condition of movement. The probabilities of contacts with furniture, light switches and doorknobs in each room were set from the contact order probability and contact frequency distribution and tuned to approximate the measured values in the same way.
Comparisons between the observed values and the average of 1,000 simulations are shown in (Figure 2; Figure 3), respectively. Each RMSE is .0029 (Normalized RMSE .06%) and .0042 (Normalized RMSE .02%), which are almost consistent values, confirming the validity of the resident agent movement and contact behaviors.
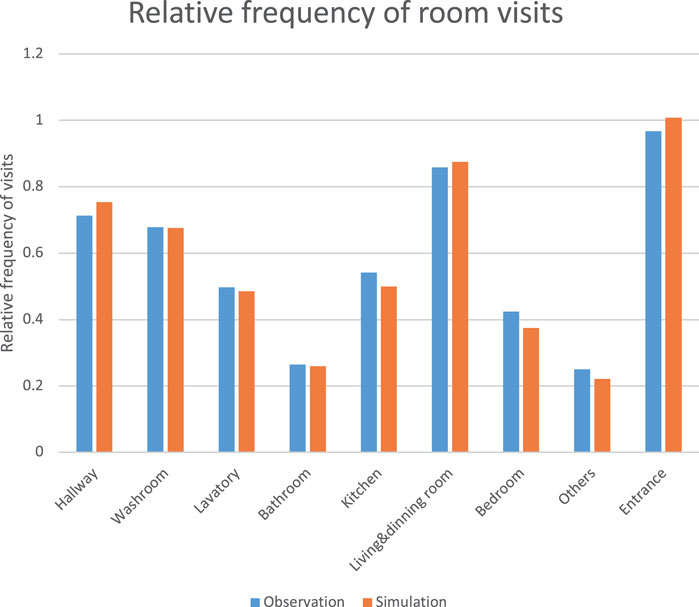
FIGURE 2. Relative frequency of room visits for 30 min from the time they returned home (blue: observation, orange: simulation).
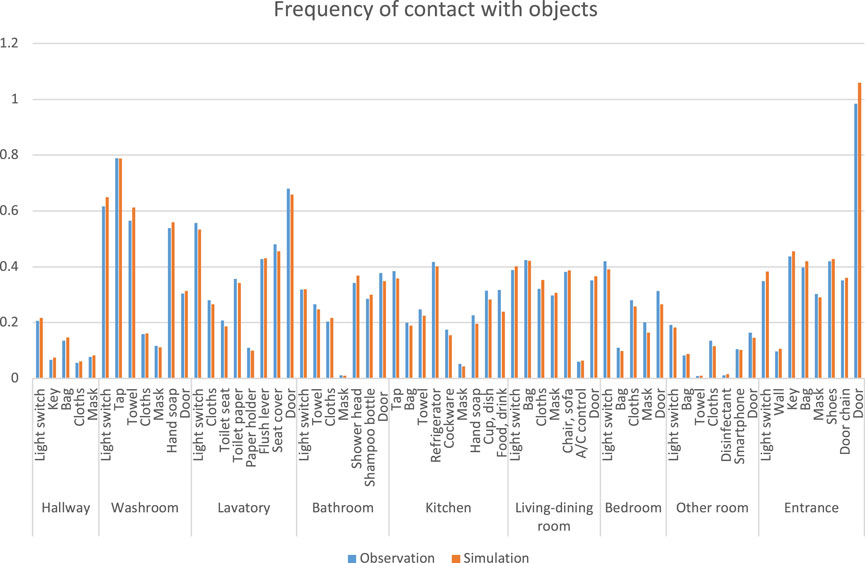
FIGURE 3. Frequency of contact with objects (blue: observation, orange: simulation).
Table 5 shows the eight experimental settings. Experiment 4.1.1 and 4.1.2 are experiments in which one person returning home from outside spreads the virus on their hands indoors. Experiment 4.2.1 to 4.2.2 are experiments in which a late returnee comes into contact with the virus spread indoors. Experiment 4.3.1 to 4.3.3 are experiments in which a person returning home comes into contact with the virus while an infected family member is recuperating at home. It should be noted that in these experiments, it is assumed that the infected family member wears a mask when they leave their bedrooms to prevent droplet infection.
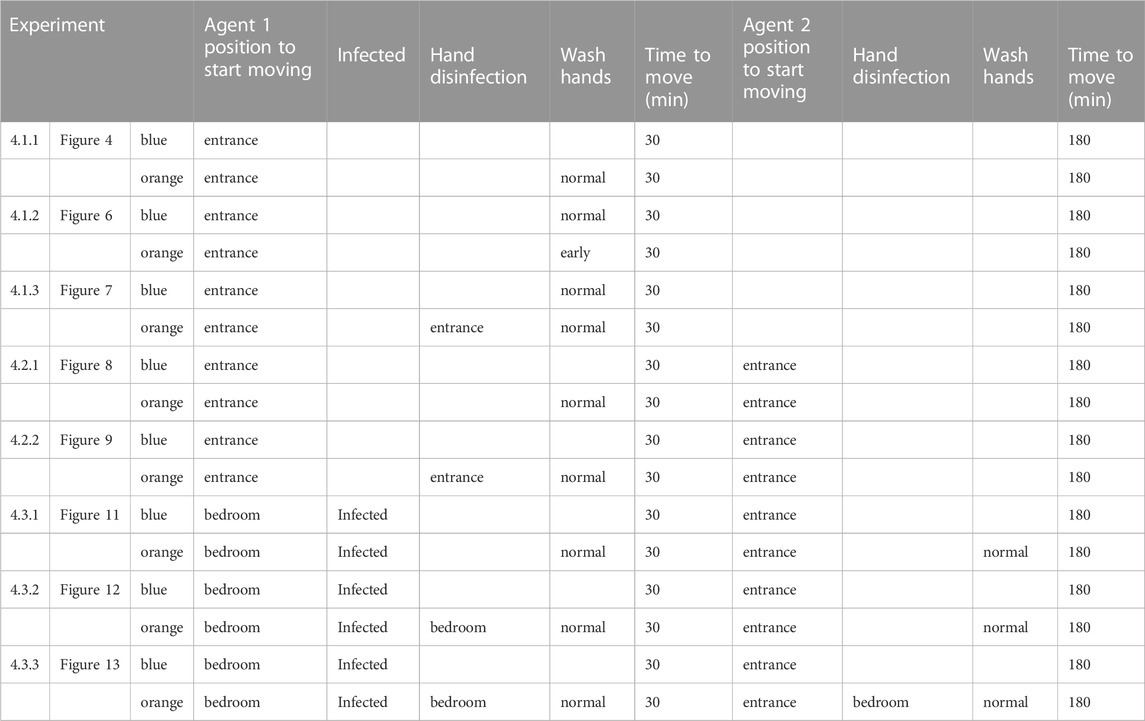
TABLE 5. Experimental settings.
The following are the results of 1,000 simulations of each possible household movement and contact behavior during the first 30 min after returning home, using the created model. In the simulation, we use the same room layout (Figure 1) as the previous example of the survey that is a two-bedroom apartment with a living and dining room plus kitchen.
The initial viral load on hand was set to 106copies, and the viral reduction factor by hand-washing with hand wash was set to 1/10,000 based on 6). As a result of 1,000 simulations, the hand-washing group and the no-hand-washing group were extracted. The average viral residuals in these groups are shown in Figure 4. The figure shows that although hand-washing behavior (orange bars) reduces the number of viruses on the hand and fingers, various contacts prior to hand-washing reduce the effectiveness in inhibiting virus spread. This indicates that it is difficult to prevent the spread of viruses in a room by ordinary hand-washing behavior.
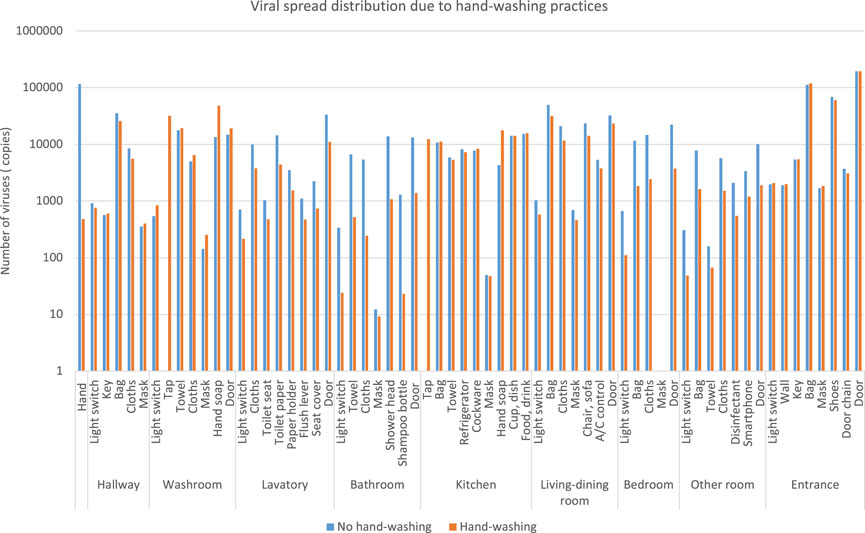
FIGURE 4. Viral spread distribution due to hand-washing practices.
Figure 5 shows the results of measuring the number of contacts before hand-washing among the hand-washing group. The distribution of contact counts before hand washing approximates the simulation results (blue: simlation, orange: observation). The number of contacts with household items before the first hand-wash in the hand-washing group was two at the minimum, 38 at the maximum, and nine at the median. The results of the simulation experiment show a pattern in which many contacts occur before hand-washing. From these data, we conducted a comparative analysis of the effect of early hand-washing on the number of contacts before hand-washing, with a median of nine contacts as the borderline. Figure 6 shows that earlier hand-washing upon returning home reduces the number of contact objects to which the virus adheres in the home (orange). This suggests that early hand-washing can reduce the extent of viral spread.
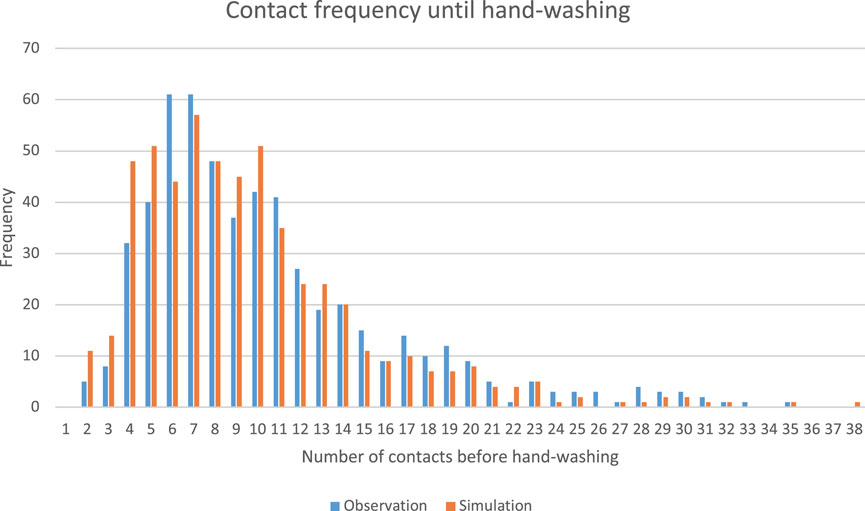
FIGURE 5. Distribution of contact frequency until hand-washing.
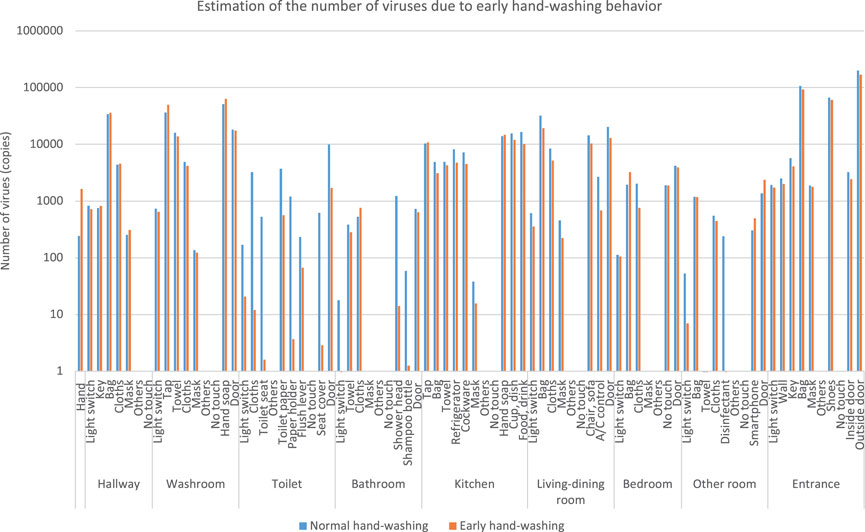
FIGURE 6. Estimation of the number of viruses due to early hand-washing behavior.
The previous section showed that early hand-washing behavior is effective. Next, we estimated the effect of hand disinfection inside the entranceway immediately after returning home, because the number of viruses deposited in the hallway, living and dining room, kitchen, and washroom, which are often used before hand-washing, is high. The results of an experiment in which the coefficient of virus reduction by hand disinfection was set to 1/10,000 according to [16] are shown in Figure 7.
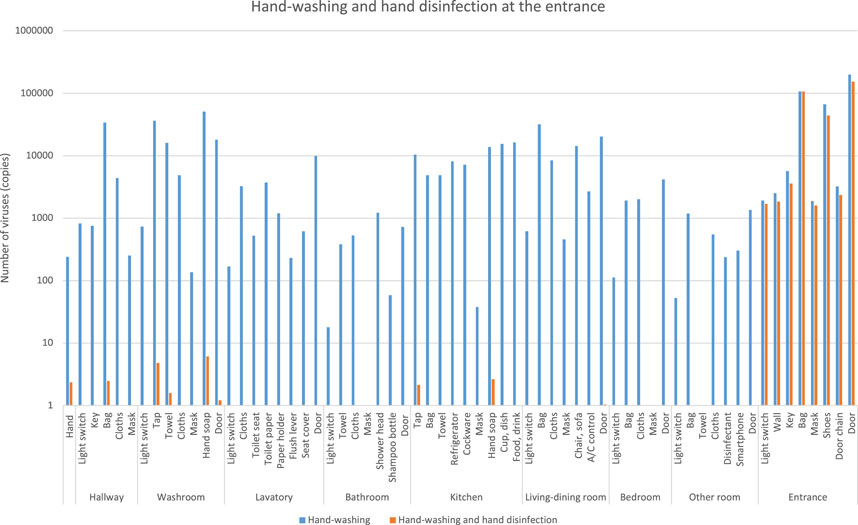
FIGURE 7. Estimation of the number of viruses by hand disinfection at the entrance.
The results show that the number of viruses outside the entrance (orange) was significantly reduced compared to hand-washing only (blue). However, the number of viruses on light switches, walls, doorknobs, and keys inside the entrance, as well as on portable items such as bags, remained high. This is presumably due to the fact that hand disinfection is performed inside the entryway, resulting in higher virus attachment to areas that were in contact with the virus prior to disinfection.
The results of the experiment for one returning family member raised concerns about the risk regarding the amount of adhesion at the entrance. In this experiment, a simulation analysis was conducted for a case in which one family member returned home with the virus on their hands, and a second family member returned home from an outing.
The viral residuals on objects are shown in blue bars when the first person returns home with the virus on their hands and moves around the room without hand-washing, and then the second person returns home without a virus attachment and moves around the room.
The number of viruses on household goods is shown in orange bars when the first person returned home with a virus on their hands and washed their hands after an average number of contacts while moving around the room, and then the second person returned home without a virus adhesion and moved around the room (Figure 8).
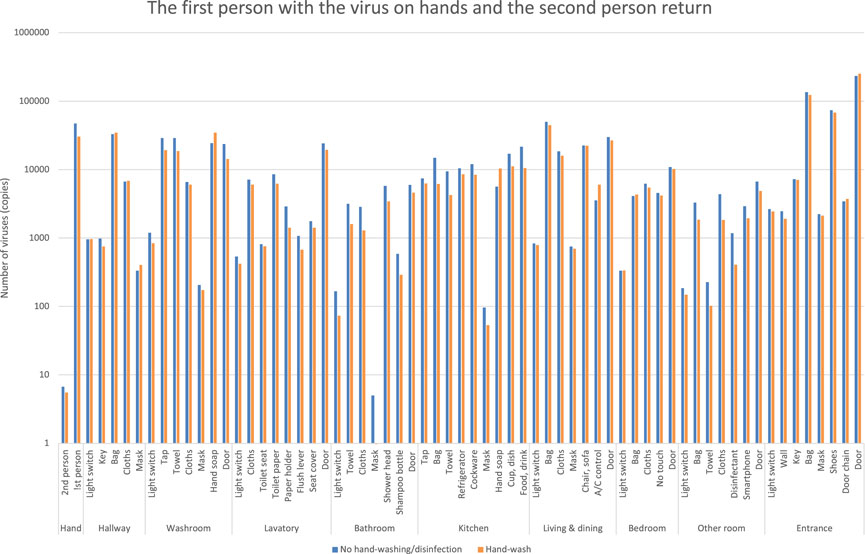
FIGURE 8. Estimation of the number of viruses when the first person returns with the virus on their hands, and then the second person returns.
In contrast to the blue bars, the orange bars show a slight decrease in viral residuals, but it shows little change. The first person’s hand-washing behavior alone shows that the decrease in viral residuals in each room is small, indicating that the second person’s hand adhesion would be high.
The first person comes home with the virus on their hands, disinfects their hands at the entrance, and moves around the room. The second person then returns home without the virus on their hands and moves around the room. The number of viruses is shown as orange bars (Figure 9).
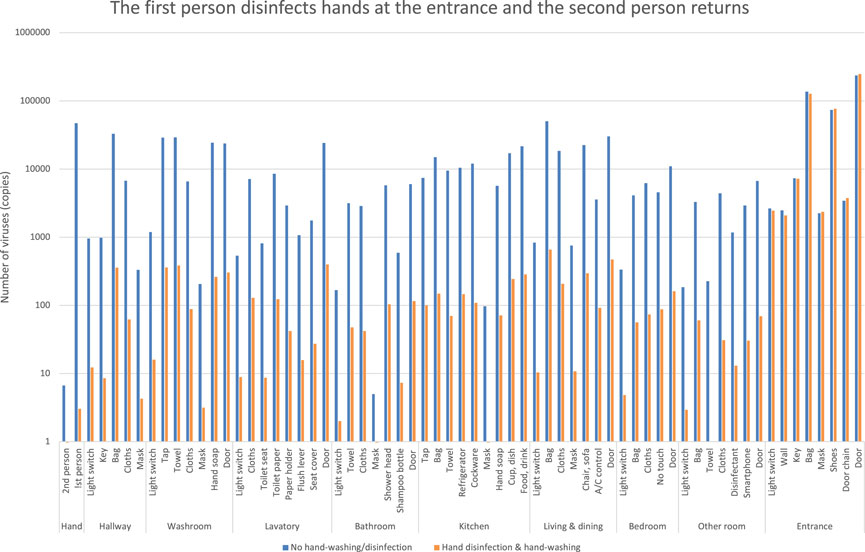
FIGURE 9. Estimation of the number of viruses when the first person returns and disinfects hands at the entrance, and the second person returns.
In the previous case (Figure 7), in contrast to the blue bars, the orange bars show a decrease in the number of viruses. However, the virus counts (orange bars in Figure 9) did not decrease significantly and differ from the results of the first person’s entrance disinfection behavior.
It indicates that the second person’s action allows the virus to spread to each room. This is because the first person leaves the virus inside the entrance where the person had contact with the virus at some parts of the entrance before disinfection.
In this experiment, we analyze the case of a second family member returning home from an outing while one family member was infected with COVID-19 and recuperating at home (Figure 10). The behavior of an infected patient who was recuperating at home was defined using data from the survey of behavior after returning home, and was modified so that the bedroom was used as the starting point for movement. The initial number of viruses on the hands upon exiting the bedroom was assumed to be 106copies, and no new increase was assumed during the behavior. Note that the influenza virus was also used as a proxy for the new coronavirus in this experiment.
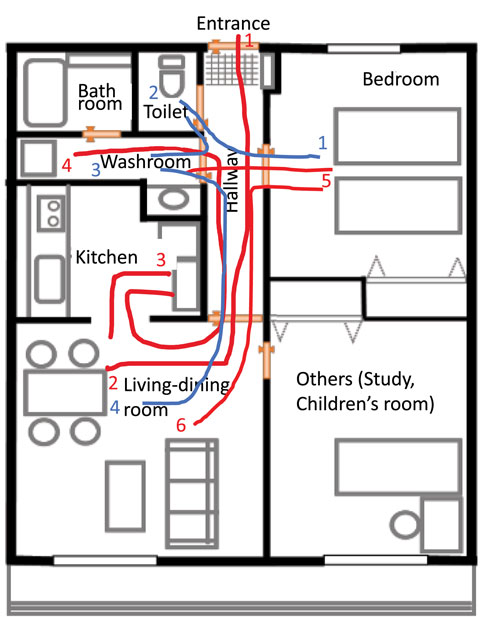
FIGURE 10. A behavior example of a person returning home and an infected person.
One person infected with COVID-19 is able to leave the bedroom and move to other rooms, while the second person returns home and moves around the room without viral attachment, as shown by Figure 11. The blue bars are a case where neither of the two people washed their hands, and the orange bars are a case where both people washed their hands as usual after returning home. In contrast to the blue bars, the orange bars show a slight decrease in the number of viruses, but little change. This indicates that normal hand-washing behavior alone is not enough, and the second person is also exposed to the risk of contact transmission as the infected family member spreads the virus to each room.
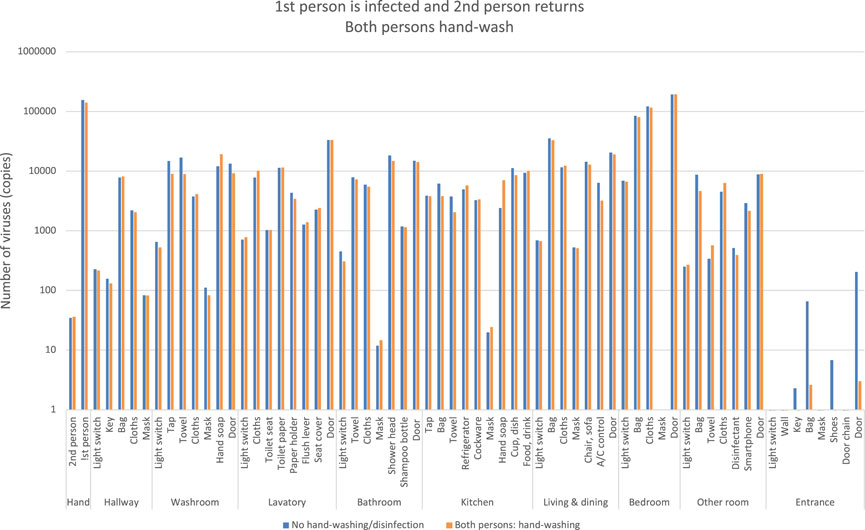
FIGURE 11. Estimation of the number of viruses when the first person is infected and the second person returns, both the persons hand-wash.
If a person infected with COVID-19 visits the bedroom by the probability of flow line, they disinfect their hands when leaving the bedroom. And then they move to other rooms. The orange bars indicate the number of viruses if the second person returned home without viral attachment and moved around the room (Figure 12). In contrast to the blue bars, the orange bars show a decrease in virus counts. However, the number of viruses is not reduced to zero and is spreading to each room.
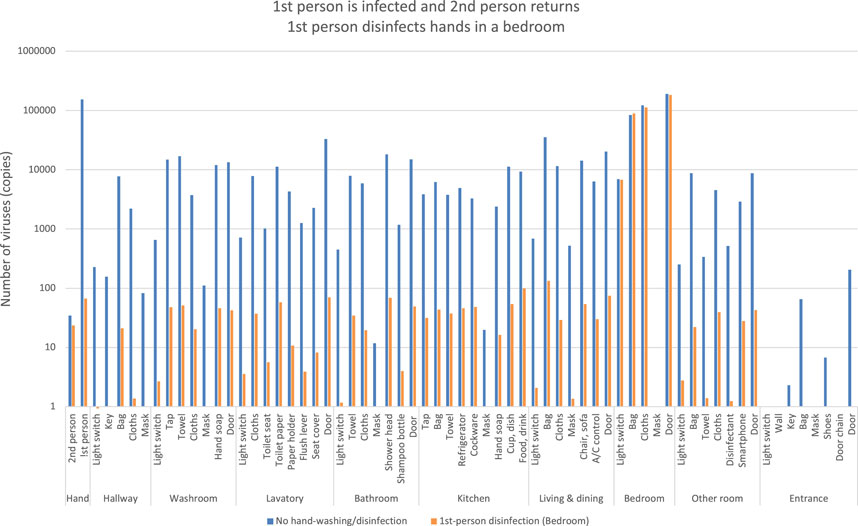
FIGURE 12. Estimation of the number of viruses when the first person is infected and the second person returns, the first person disinfects hands in a bedroom.
It indicates that when the second person after returning home entered the bedroom to care for the infected family member, he/she left the room without hand disinfection, thus spreading the virus to each room.
One person infected with COVID-19 was able to leave the bedroom and move to other rooms after hand disinfection, and the orange bars indicate the number of viruses when the second person returns home without viral attachment and moves around the room after hand disinfection in the bedroom (Figure 13).
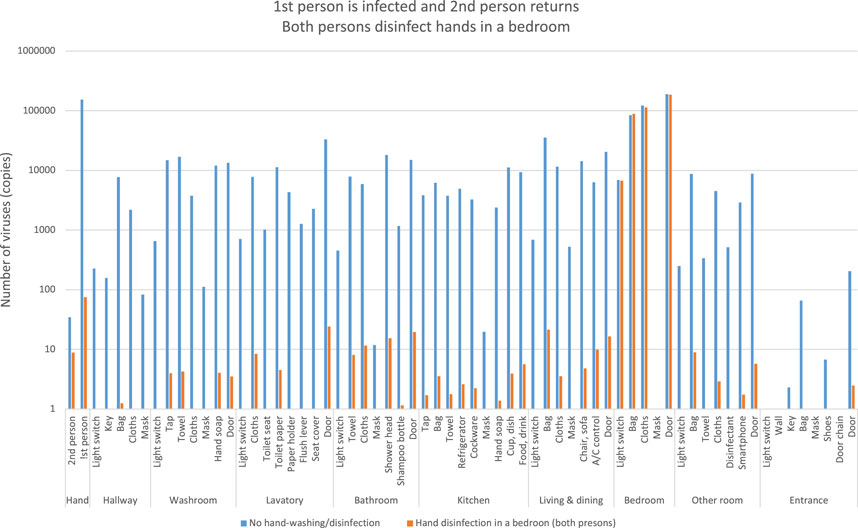
FIGURE 13. Estimation of the number of viruses when the first person is infected and the second person returns, both the persons disinfect hands in a bedroom.
In contrast to the blue bars, the orange bars show a significant decrease in viral residuals. This indicates that hand disinfection when the second person entered the bedroom after returning home prevented the spread of the virus.
Figure 14 shows an example of a situation in which the virus spreads gradually from an infected person moving from a bedroom to a room, including the movement of another family member. After the infected person moves out of the bedroom for 30 min, the other family member moves through each room for 30, 60, 120, and 180 min, respectively. The green line indicates the infected person’s movement between rooms, the blue line indicates the infected person’s contact movement, the red line indicates the second person’s movement, and the pink line indicates the second person’s contact movement. The square boxes indicate items with the virus on them. The movement of infected family members from the bedroom in the lower right corner shows how the virus spreads not only to the living and dining room, but also to the kitchen, bathroom, and everywhere else in the room except the entrance. The overlapping blue boxes and red boxes indicate the risk of transfer of the virus to another family member.
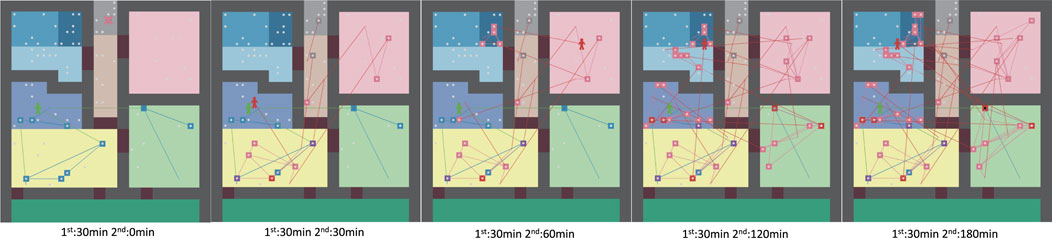
FIGURE 14. Agent moving paths and virus spread over time Left: after 30 min, center: after 60 min, right: after 120 min.
Table 6 shows the results of the Wilcoxon signed-rank test of the average amount of virus left on the hand in experiment 4.1.1 to 4.3.3, indicating that there is a significant difference in the amount of virus except in experiment 4.1.2 and 4.3.1.
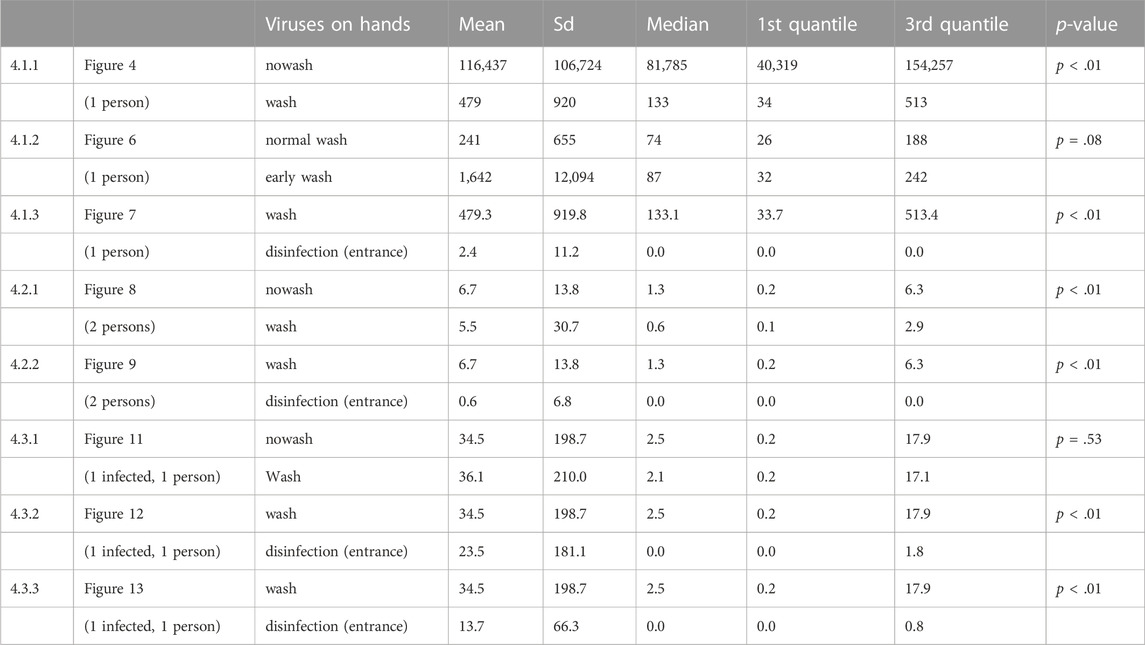
TABLE 6. Statiscal test between virus on hands of the experiments.
Hand-washing after returning home slightly reduces the amount of virus in the room and on the hands (Figure 4). Although early hand-washing is also effective, the final amount of virus on hands does not change much because the virus that was transferred to the room before hand-washing is transferred back to the hands (Figure 6). On the other hand, hand disinfection at the entrance significantly reduces the amount of viruses adhering to the room (Figure 7).
In an experiment with two family members, we also show that normal hand-washing behavior is less effective in reducing the amount of virus (Figure 8) and that hand disinfection at the entrance is effective (Figure 9).
An experiment in which one family member was infected and staying at home showed that simply having two people wash their hands had little effect on reducing the amount of virus (Figure 11). On the other hand, we confirmed that disinfecting hands when an infected person leaves the bedroom reduces the amount of virus in the room, but another family member who returns home stops by the bedroom, spreading the virus to other rooms (Figure 12). It was found that hand disinfection in the bedroom after a family member came home could significantly prevent the spread of the virus outside the bedroom (Figure 13).
These experiments showed that viruses on hands upon returning home spread to each room in the home; Maestre et al. [14] measured the spread of RNA in a home with a SARS-CoV-2 positive patient and found a median viral count of 966 copies. This value is consistent with the value in this simulation experiment (Figure 4).
In addition, the number of viruses on hands, even if the hands are disinfected, has not been reduced to zero. Because the virus spread from the entrance and portable items is occurring. This suggests that portable items, doorknobs at the entrance, light switches, and locks should also be disinfected. It was also revealed that other family members could spread the virus to other parts of the home by touching the virus on walls and furniture. These were also found to affect the number of viruses on hands, which are at high risk of virus contact.
The experiment examining the risk when the second family member returned home showed that even if the first returning family member disinfected their hands inside the entrance, the virus remained in a part of the entrance, and the virus was spread inside the room by the second returning family member. This result suggests that hand disinfection outside the front door is important.
From this result, it was found that hand disinfection at the time the second family member leaves the bedroom is important; from the analysis of COVID-19 virus titer, 1TCID50 was reported to be about 944 copies/µL [9]. The number of viruses attached to each room in the experiments ranged from 100 to over 1,000 copies in some locations. It indicates that there is a risk that the number of viruses absorbed into the body through the nose or mouth may exceed 1,000 copies after one to multiple contacts.
While the use of masks and keeping a safe distance during conversations have been shown to be effective for droplet transmission of viruses, the risk of contact transmission has not been quantified, as only general hand sanitization has been recommended. By visualizing the number of viruses adhering to the home, this experiment revealed that normal hand-washing behavior is not sufficient. In addition to hand-washing as soon as possible after returning home, the results also indicated that the appropriate timing and location of hand disinfection are extremely important as a tipping point.
Limitations of this study include the fact that the behavioral probability of an infected person at home was estimated from the survey of the behavior after returning home, and that the number of viruses on the hands of the infected person was assumed to be 106copies. A more accurate survey of home treatment of infected persons would be needed.
In addition, this study does not address the risk of droplet infection in the home. Droplet infection can be effectively prevented by masks, exhaust ventilation, and opening windows. Since contact infection cannot be prevented by these measures, this study focused on contact infection risk in the home. Bale et. al [17]. used fluid simulation modeling to clarify the indoor infection risk due to droplet/aerosol inhalation. We are collaborating with them to study contact transmission of virus-containing droplets when they fall on tables and other surfaces. These overall risks will be the subject of future work. Additionally, the veneered boards used in this experiment were not treated with any antimicrobial or antiviral treatment. Given the recent increase in the number of them with various surface antimicrobial treatments, future analysis should take the half-life and adhesion characteristics of viruses on the various boards into account. If these effects for virus are added to the simulation model, it may be used to predict the risks in more patterns and to estimate the effects of surface-treated products and the place to be treated in the home. In this analysis, the behavioral preferences obtained from the questionnaire were defined by a single probability model. However, by clustering the behavioral patterns of the subjects, a behavioral analysis that takes heterogeneity into account can be expected. These are issues to be addressed in the future.
In this study, we constructed an agent-based virus spreading model for household contact transmission of influenza viruses as a proxy for coronaviruses, which reproduces the spread of viruses on hands and personal belongings when leaving the house to various places and objects in the home, and estimated the risk of contact transmission. We conducted virus distribution experiments among various materials using influenza viruses with similar properties as substitutes for new coronaviruses.
Using the viral partitioning rates by material obtained from the experiments and the behavioral contact history data after returning home obtained from a questionnaire survey of approximately 1,100 people, we estimated the number of viruses by hand-washing and hand disinfection behavioral scenarios in the home. The experimental results confirmed the effectiveness of hand-washing and hand disinfection at the appropriate time against the risk of viruses brought in from outside the home and the risk of contact infection by an infected family member who is recuperating at home.
The original contributions presented in the study are included in the article/Supplementary Material, further inquiries can be directed to the corresponding author.
SK: design of the study, paper writing TM: model programming YS: design of experiments KN: design of the model KO: design of the survey JS: design of experiments TT: design of experiments YK: management of all experiments.
This work was supported by JSPS KAKENHI Grant Number 21H01561 and Covid-19 AI & Simulation Project run by Mitsubishi Research Institute commissioned by Cabinet Secretariat. The authors declare that this study received contribution from Mitsubishi Research Institute, Inc.. The company was not involved in the study design, collection, analysis, interpretation of data, the writing of this article or the decision to submit it for publication.
YS, KN, KO, JS, TT, and YK were employed by Lion Corporation
The remaining authors declare that the research was conducted in the absence of any commercial or financial relationships that could be construed as a potential conflict of interest.
All claims expressed in this article are solely those of the authors and do not necessarily represent those of their affiliated organizations, or those of the publisher, the editors and the reviewers. Any product that may be evaluated in this article, or claim that may be made by its manufacturer, is not guaranteed or endorsed by the publisher.
1. Kissler SM, Tedijanto C, Goldstein E, Grad YH, Lipsitch M. Projecting the transmission dynamics of SARS-CoV-2 through the postpandemic period. Science (2020) 368:860–8. doi:10.1126/science.abb5793
2. Kucharski AJ, Klepac P, Conlan AJK, Kissler SM, Tang ML, Fry MH, et al. Effectiveness of isolation, testing, contact tracing, and physical distancing on reducing transmission of sars-cov-2 in different settings: A mathematical modelling study. The LANCET (2020) 20:1151–60. doi:10.1016/S1473-3099(20)30457-6
3. Jaramillo C, Taboada M, Epelde F, Rexachs D, Luque E. Agent-based model and simulation of mrsa transmission in emergency departments. Proced Comp Sci (2015) 51:443–52. doi:10.1016/j.procs.2015.05.267
4. Peleg M. Modeling the dynamic kinetics of microbial disinfection with dissipating chemical agents-a theoretical investigation. Appl Microbiol Biotechnol (2021) 105:539–49. doi:10.1007/s00253-020-11042-8
5. Mokhtari A, Doren JMV. An agent-based model for pathogen persistence and cross-contamination dynamics in a food facility. Risk Anal (2019) 39:992–1021. doi:10.1111/risa.13215
6. Mori K, Hayashi Y, Noguchi Y, Kai A, Ohe K, Sakai S, et al. Effects of handwashing on feline calicivirus removal as norovirus surrogate. Jpn Assoc Infect Dis (2006) 80:496–500. doi:10.11150/kansenshogakuzasshi1970.80.496
7. Murata T, Komot S, Iwahori S, Sasaki J, Nishitusji H, Hasebe T, et al. Reduction of severe acute respiratory syndrome coronavirus - 2 infectivity by admissible concentration of ozone gas and wate. Risk Anal (2020) 65:10–6. doi:10.1111/1348-0421.12861
8. Yasugi M, Kuroda M, Ii C. Effect of aqueous ozone on sars-cov-2 under the condition with low-dose oxidizable materials. Indoor Environ (2021) 24:13–8. doi:10.7879/siej.24.13
9. Katsumi M, Yamada K, Matsubara H, Narita M, Kawamura K, Tamura S, et al. Relationship between SARS-CoV-2 viral RNA copy number and viral titer. Natl Inst Infect Dis (2021) 42 (1):22–4.
10. Kurahashi S, Yokomaku H, Yashima K, Nagai H. Assessment of the impact of Covid-19 infections considering risk of infected people inflow to the region and the vaccination effect. The Jpn Soc Artif Intelligence (2022) 37:1–L42. doi:10.1527/tjsai.37-1_C-L42
11. Madewell ZJ, Yang Y, Jr IML, Halloran ME, Dean NE. Household transmission of sars-cov-2: A systematic review and meta-analysis. JAMA Netw Open (2020) 3:e2031756. doi:10.1001/jamanetworkopen.2020.31756
12. Liu Y, Eggo RM, Kucharski AJ. Secondary attack rate and superspreading events for sars-cov-2. The Lancet (2020) 395:E47. doi:10.1016/S0140-6736(20)30462-1
13. Dutta S, Kaur RJ, Bhardwaj P, Charan J, Bist SKS, Detha MD, et al. Household transmission of Covid-19: A cross-sectional study. Infect Drug Resist (2020) 13:4637–42. doi:10.2147/IDR.S285446
14. Maestre JP, Jarma D, Yu JRF, Siegel JA, Horner SD, Kinney KA. Distribution of sars-cov-2 rna signal in a home with Covid-19 positive occupants. Sci Total Environ (2021) 778:146201–10. doi:10.1016/j.scitotenv.2021.146201
15. Ciunkiewicz P, Brooke W, Rogers M, Yanushkevich S. Agent-based epidemiological modeling of Covid-19 in localized environments. Comput Biol Med (2022) 144:105396. doi:10.1016/j.compbiomed.2022.105396
16. Kampf G, Todt D, Pfaender S, Steinmann E. Persistence of coronaviruses on inanimate surfaces and their inactivation with biocidal agents. J Hosp Infect (2020) 104:246–51. doi:10.1016/j.jhin.2020.01.022
Keywords: contact transmission, COVID-19, agent-based model, virus transmission, hand-washing, hand disinfection
Citation: Kurahashi S, Mukai T, Sekine Y, Nakajima K, Otake K, Sugiyama J, Takizawa T and Kakizawa Y (2023) A tipping point of spreading viruses: Estimating the risk of household contact transmission of COVID-19. Front. Phys. 10:1044049. doi: 10.3389/fphy.2022.1044049
Received: 14 September 2022; Accepted: 27 December 2022;
Published: 12 January 2023.
Edited by:
Takayuki Mizuno, National Institute of Informatics, JapanReviewed by:
Kattela Chennakesavulu, Sathyabama Institute of Science and Technology, IndiaCopyright © 2023 Kurahashi, Mukai, Sekine, Nakajima, Otake, Sugiyama, Takizawa and Kakizawa. This is an open-access article distributed under the terms of the Creative Commons Attribution License (CC BY). The use, distribution or reproduction in other forums is permitted, provided the original author(s) and the copyright owner(s) are credited and that the original publication in this journal is cited, in accordance with accepted academic practice. No use, distribution or reproduction is permitted which does not comply with these terms.
*Correspondence: Setsuya Kurahashi, a3VyYWhhc2hpLnNldHN1eWEuZ2ZAdS50c3VrdWJhLmFjLmpw
Disclaimer: All claims expressed in this article are solely those of the authors and do not necessarily represent those of their affiliated organizations, or those of the publisher, the editors and the reviewers. Any product that may be evaluated in this article or claim that may be made by its manufacturer is not guaranteed or endorsed by the publisher.
Research integrity at Frontiers
Learn more about the work of our research integrity team to safeguard the quality of each article we publish.