- 1School of Automation and Information Engineering, Xi’an University of Technology, Xi’an, China
- 2Shaanxi Key Laboratory of Complex System Control and Intelligent Information Processing, Xi’an University of Technology, Xi’an, China
Although the technical requirements for the feature extraction of ship radiated noise (SRN) in the fields of national defense and economy increase with each passing day, the complexity of the marine environment makes the feature extraction of SRN difficult. The traditional feature extraction method based on variational mode decomposition (VMD) is widely used in the feature extraction of SRN. Nevertheless, the use of VMD is greatly affected by parameters. In this paper, the butterfly optimization algorithm (BOA) is introduced to optimize VMD, which is called BOA-VMD algorithm, and realizes the optimal selection of VMD parameters
1 Introduction
Due to the complexity of the generation principle of underwater acoustic signals and the diversity of components, it is difficult to identify ship radiated noise (SRN) [1, 2]. The key to the recognition of SRN lies in the feature extraction method [3]. Traditional feature extraction methods usually use DEMON spectral analysis, wavelet transform, Fourier transform, empirical mode decomposition (EMD) and other signal processing algorithms, which are based on feature differences to classify and identify SRN. However, wavelet transform cannot guarantee time accuracy and frequency accuracy at the same time. Fourier transform has trouble in dealing with non-stationary signals, and EMD has modal aliasing in the processing of SRN signals.
To overcome the above shortcomings, Konstantin Dragomiretskiy et al. proposed the variational mode decomposition (VMD) in 2014 [4], which adaptively decomposes the complex signal into several intrinsic mode functions (IMF), thereby overcoming the mode mixing [5, 6]. VMD is suitable for processing complex hydroacoustic signal, such as feature extraction of SRN [7]. However, its decomposition effect is greatly affected by the number of decompositions
In the field of underwater acoustic signal processing, entropy is used to describe the complexity of the time series and is often used as eigenvalues for feature extraction [17–20], among which permutation entropy (PE) [21], dispersion entropy (DE) [22], fluctuation dispersion entropy (FDE) [23] and others have been widely used in this field. Moreover, a large number of experimental studies have also proved that the entropy-based feature extraction method [24] is more effective than traditional methods [25–27]. Slope entropy (SE) [28], as a new type of entropy estimator, was proposed by David Cuesta-Frau in 2019. It assigns symbols based on the slope between two continuous data samples, and has good time series classification performance [29]. In 2022, SE was applied for the first time, and combined with PE to achieve double feature extraction of SRN [30], which verifies the effectiveness of SE. However, the feature extraction methods still are based on the original signal, and the features of each mode of the signal are not deeply excavated. To solve this problem, a method combining VMD and SE is proposed to extract the features of SRN [31], which is more effective than the method based on SE of the original signal. However, intelligent optimization algorithm has not been introduced to improve the decomposition efficiency of VMD.
In order to solve the parameters selection problem of VMD and further improve the feature extraction efficiency of SRN, BOA is introduced to optimize the parameters of VMD, called BOA-VMD, in addition, combined with SE, a feature extraction method of SRN based on BOA-VMD and SE is proposed. The structure of this paper is as follows. Section 2 expounds the principle and step of various algorithms used in this paper. Section 3 exhibits the steps of the feature extraction method proposed in this paper. In Section 4, the simulation signal decomposition experiment and result analysis are introduced. Section 5 demonstrates the experiment and result analysis of single feature, dual feature and three feature extraction of SRN. Finally, the last Section draws the conclusion of this paper.
2 Algorithm
2.1 Butterfly optimization algorithm-variational mode decomposition algorithm
Since the parameters
where,
The expression for the envelope entropy value
where,
The algorithm steps of BOA-VMD are as follows:
(1) Set the range of parameters in VMD, with the parameter [
(2) Initialize the parameters in BOA, including population size
(3) Initialize the population, and use the average envelope entropy value of all IMF components as the fitness function for optimization.
(4) Calculate the fitness value of each butterfly under VMD decomposition, compare the size of the fitness value, and update the range of parameters [
(5) Repeat step (4) until the number of iterations reaches the set maximum value, and output the optimal parameter combination [
2.2 Slope entropy
SE, as a new type of entropy estimator, was proposed by David Cuesta-Frau in 2019. Its purpose is to solve the problem that the time series amplitude information is ignored in the calculation of permutation entropy. SE uses a new encoding method that is based on the slope of two consecutive data samples and maintains the symbolic representation of subsequences. The SE contains five symbols, namely
For two continuous values
The symbols cover the range of slopes of line segments for two consecutive input data samples, and the relative frequency of each pattern found is then mapped to a true value using the method of Shannon entropy. The calculation steps are as follows.
(1) Input a time series of length
(2) Calculate
(3) Calculate the probability of each type,
3 Feature extraction method
In this section, the BOA-VMD is proposed to select the best parameter combination of VMD, and combined with SE, we propose a feature extraction method based on BOA-VMD and SE to extract single, dual and three features of SRN.
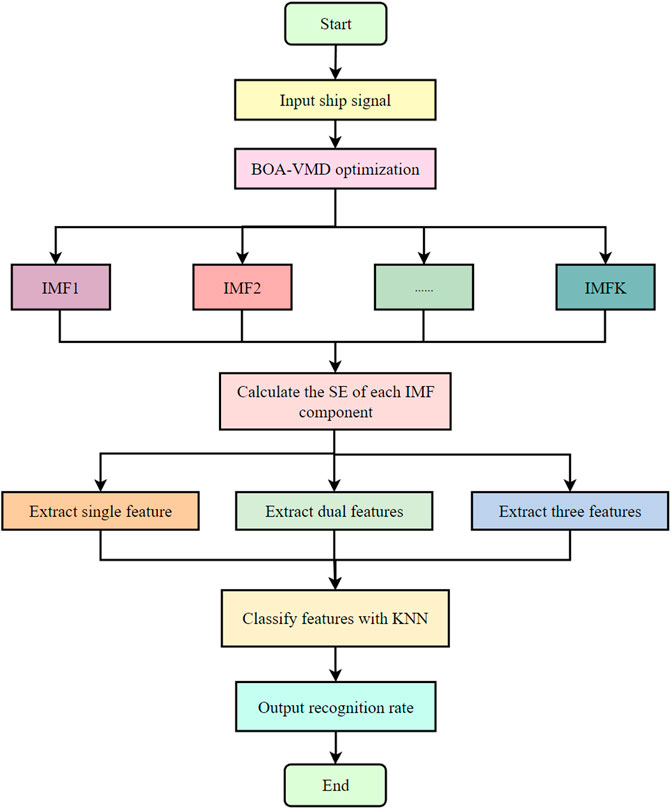
The flow chart of the feature extraction method of SRN based on BOA-VMD and SE is shown in Figure 2. The specific implementation steps of the proposed feature extraction method for SRN are as follows:
(1) Different types of SRN signals are input and normalized.
(2) The SRN is decomposed by the BOA-VMD algorithm, and
(3) The SE of each decomposed IMF component is calculated.
(4) SE is taken as the feature value, the feature extraction experiments of single feature, dual feature and three feature are carried out respectively.
(5) The KNN classifier is introduced for classification of feature values.
(6) The recognition rate is obtained.
4 Simulation
Two parameters of VMD, namely the number of decompositions
4.1 Simulation signal
To verify the optimization effect of the three optimization algorithms on VMD parameters, a set of simulation signals are set up for analysis, and the specific expressions are as follows:
here,
Figure 3 shows the waveform of the simulated signal. It can be seen from the figure that the time-domain waveform of the noise-added signal is complex, so signal decomposition is required.
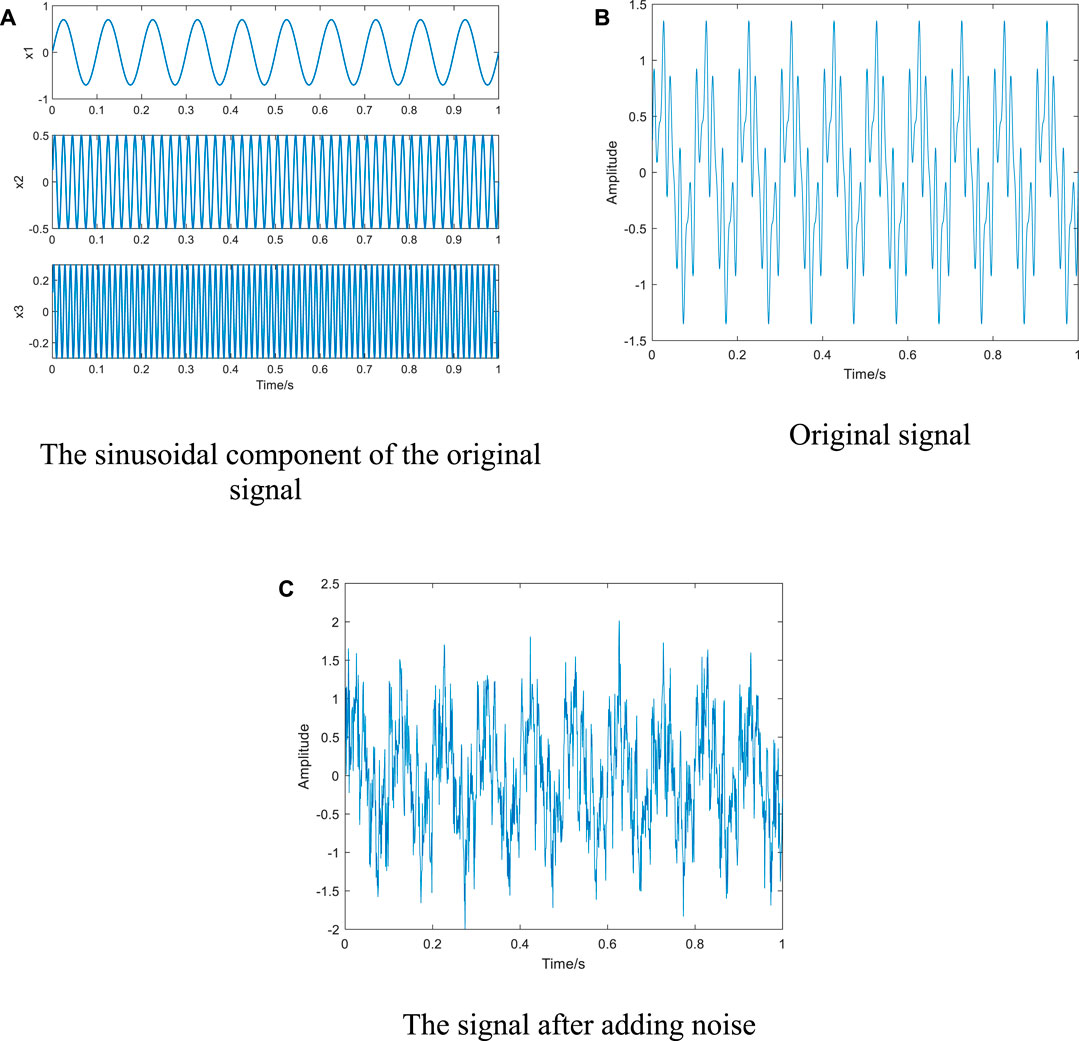
FIGURE 3. The waveform of the simulated signal: (A) The sinusoidal component of the original signal; (B) Original signal; (C) The signal after adding noise.
4.2 Parameter optimization variational mode decomposition
In this section, BOA-VMD is used to optimize the modal component
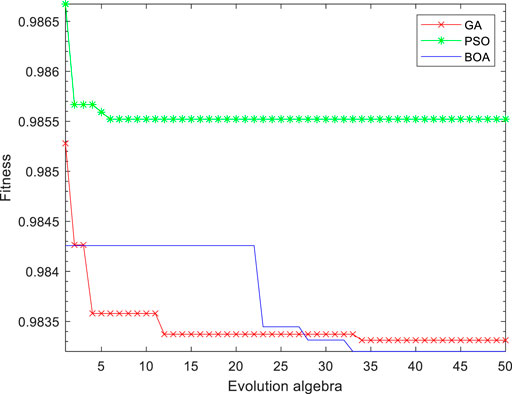
After several optimizations for the three types of algorithms, the average value of the iteration time and the minimum envelope entropy value are obtained. The iteration results of the three types of optimization algorithms are shown in Figure 4.
From Figure 4, it can be concluded that GA and BOA begin to converge after about the 35th iteration, and PSO begins to converge after about the 6th iteration. The convergence speed of PSO is much faster than that of BOA and GA. BOA has the smallest fitness value, which is about 0.9820, while the minimum fitness value of PSO and GA is approximately 0.9850 and 0.9830, which are larger than BOA.
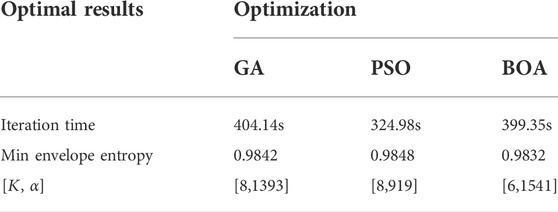
By calculating the iteration time and minimum envelope entropy of the three types of optimization algorithms for comparison, the optimization results of the three types of optimization algorithms are shown in Table 1.
As shown in Table 1, PSO has the least iteration time and GA has the most iteration time, that is, PAO has the fastest optimization speed. But in terms of optimization results, BOA has the smallest envelope entropy value, which is 0.9832. The minimum envelope entropy values of GA and PSO are bigger than BOA. The experimental results show that BOA’s optimization speed is second only to that of PSO, and has the smallest envelope entropy value. Considering comprehensively, the parameter combination obtained by BOA search is the most reliable.
5 Experiment on feature extraction of ship radiated noise
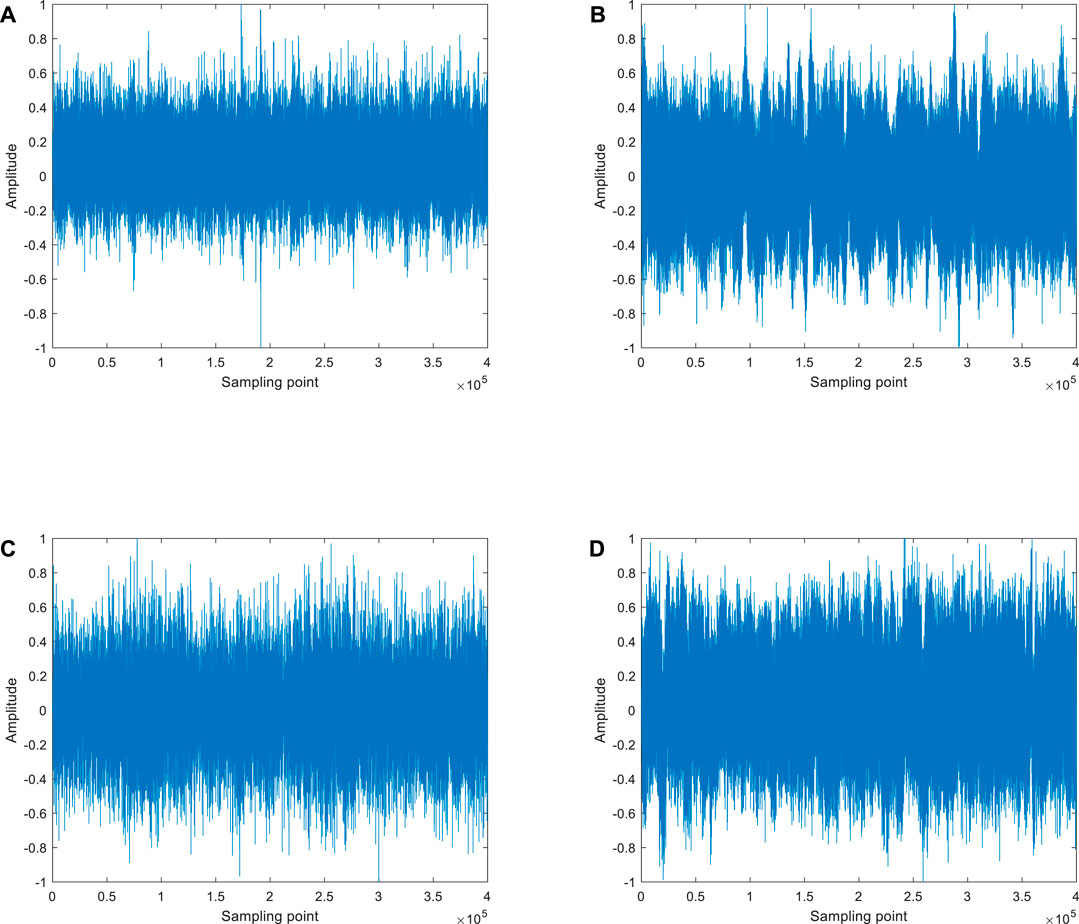
This section uses four types of SRN from the United States Park Service, which are ferries, freighters, cruise ships, and engine-driven ships [32]. The four types of SRN are coded as SRN-I, SRN-II, SRN-III, and SRN-IV. The data lengths of the four types of SRN are 1379568, 1641072, 5314800, and 446448, respectively. Each SRN sampling segment is [3001, 403000], containing 400,000 data points, and the sampling frequency is 44100Hz. The normalized four types of SRN are shown in Figure 5.
According to the BOA-VMD algorithm proposed in Section 3, the VMD decomposition results of four types of SRN are optimized. The optimal number of IMF
5.1 Single feature extraction and classification
5.1.1 Single feature extraction
In this single feature extraction experiment, 400 samples are selected for each type of SRN with 3001 as the starting point, and each sample contains 1000 data points. In order to compare with SE, FDE, DE and PE of each IMF are calculated at the same time. All entropies have two parameters in common, the embedding dimension
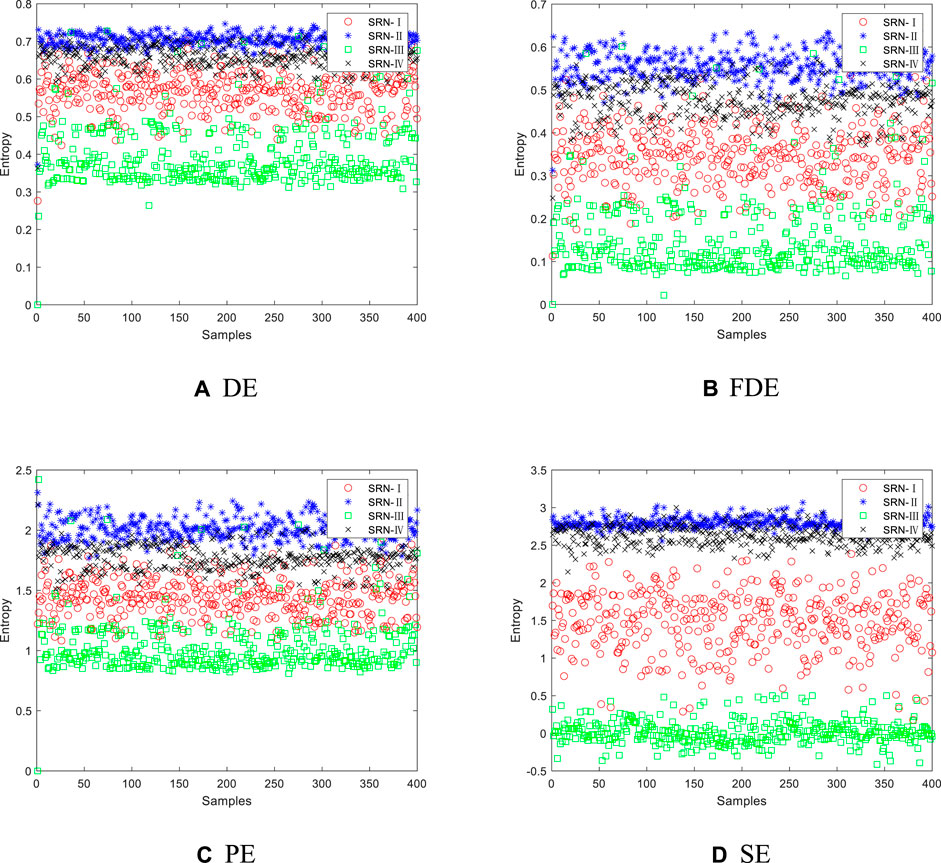
FIGURE 6. Single feature distribution of the IMF corresponding to the highest classification accuracy of the four types of SRN. (A) DE (B) FDE (C) PE (D) SE.
It can be gained from Figure 6 that the single feature distributions of the four types of SRN all fluctuate within a certain range, and the DE mixing of SRN-II and SRN-IV is the most serious; DE, FDE and PE of SRN-I and SRN-III have different degrees of aliasing, and only a few samples of their SE are aliased; the FDE of SRN-Ⅰ and SRN-Ⅳ is the most aliased, and their SE has only very little eigenvalue mixing. Experiments show that SE is the best for feature extraction of the four types of SRN.
5.1.2 Single feature classification
A KNN classifier is added to perform single-feature classification of four types of SRN [33, 34]. For the four types of SRN, 400 samples are selected, the first 200 samples are taken as training samples, and the remaining 200 samples are used as test samples for classification. Figure 7 shows the single feature classification results of four types of entropy for four types of SRN.
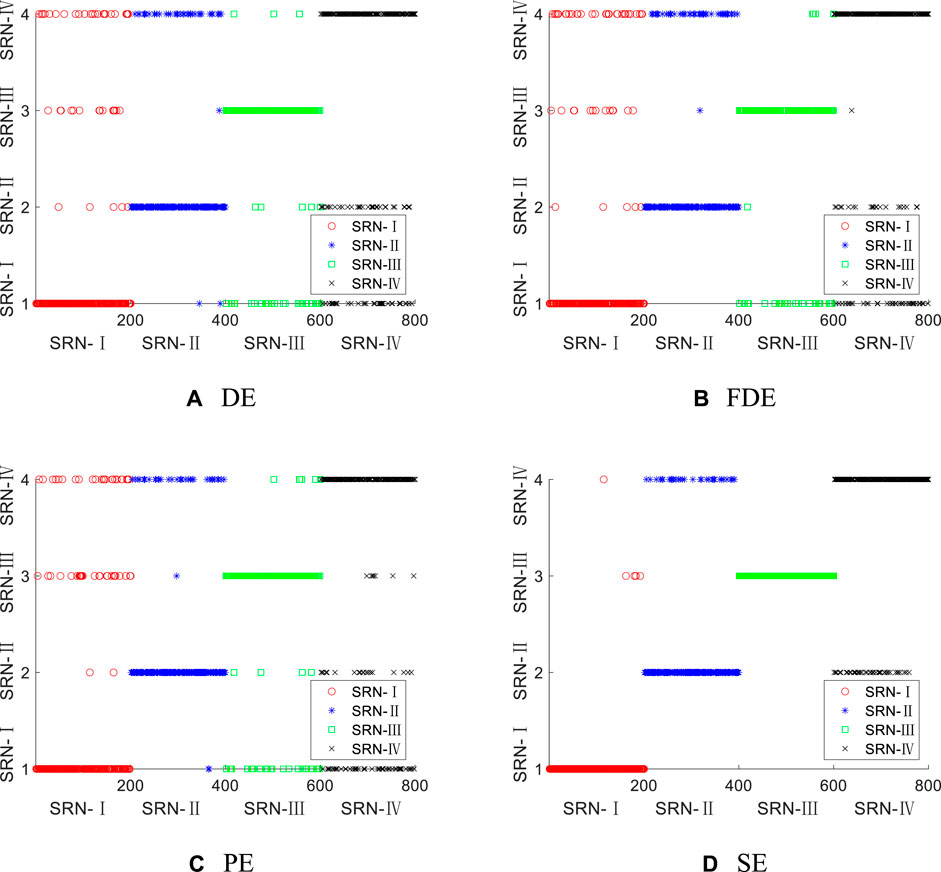
FIGURE 7. Single feature classification results of four types of entropy for four types of SRN. (A) DE (B) FDE (C) PE (D) SE.
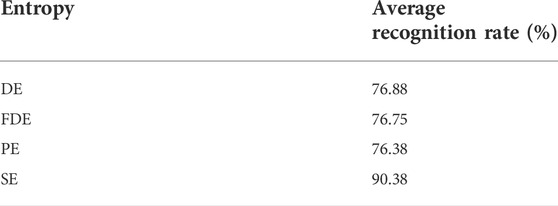
As shown in Figure 7, DE, FDE, PE and SE have different degrees of error in the classification of the four types of SRN samples; DE, FDE and PE have more classification errors for SRN-Ⅰ, SRN-Ⅱ and SRN-Ⅳ samples, but less for SRN-Ⅲ samples; this indicates that DE, FED and PE have a stronger ability to identify SRN-Ⅲ samples than the other three samples; compared with these three types of features, the SE has only four wrong classifications for SRN-Ⅰ, and all the classifications for SRN-III are correct; this suggests that SE has the strongest recognition ability for SRN-Ⅲ samples, but poor recognition ability for SRN-Ⅱ and SRN-Ⅳ, which is stronger than the other three features. Experiments show that SE is better than DE, FDE and PE for the classification of the four types of SRN. The highest average recognition rate of the four types of entropy under single-feature is shown in Table 2.
According to Table 2 can be obtained that the highest recognition rate of SE is 90.38%. Among DE, FDE and PE, the highest recognition rate did not exceed 80%. The highest recognition rates corresponding to DE, FDE and PE are 13.5%, 13.63%, and 14% lower than the highest recognition rates for SE, respectively. The experimental results show that under single feature extraction, the average recognition rate of SE is the highest compared with the other three entropies.
However, under single feature extraction, there are still many samples of four types of entropy that are not correctly identified and classified, and only the highest recognition rates of SE reach more than 90%. To further improve the recognition rates, we adopt dual feature extraction, that is, identifying two IMF components at the same time.
5.2 Dual feature extraction and classification
5.2.1 Dual feature extraction
In the dual feature extraction experiment, all parameters used in the experiment are the same as the data listed in Section 5.1. According to the principle of permutation and combination, the IMF components are combined in pairs, and a group of IMF components with the highest recognition rate is selected for feature extraction. Figure 8 shows the dual feature distribution of the IMF combination corresponding to the highest recognition accuracy of the four types of SRN, where the abscissa and ordinate are the corresponding IMF components.
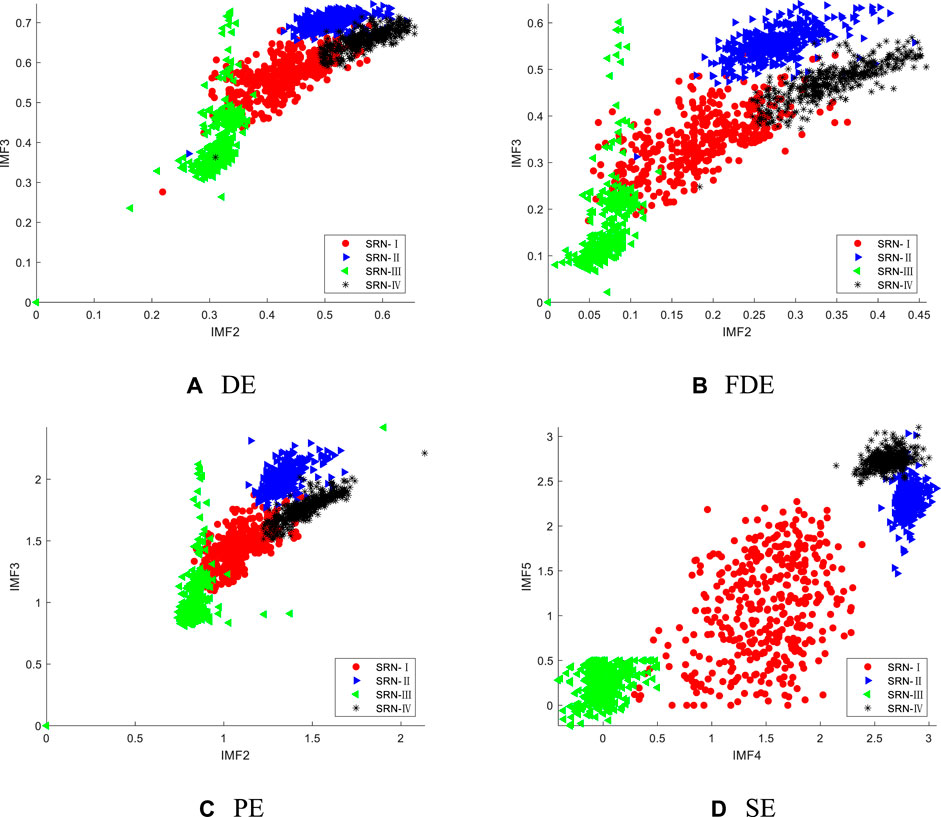
FIGURE 8. Dual feature distribution of the IMF combination corresponding to the highest recognition accuracy of the four types of SRN. (A) DE (B) FDE (C) PE (D) SE.
From Figure 8 we can obtain that, the mixing phenomenon of entropy value of the four types of SRN is significantly reduced under dual feature extraction; compared with the entropy values of the other three types of samples, the SRN-Ⅲ samples have obvious differences; in DE, FDE and PE, the SRN-Ⅰ sample is close to the other three types of samples in terms of partial entropy, which may lead to errors in sample identification; the entropy values of the four types of samples in SE are significantly different, which is easier to distinguish in sample identification. Experiments show that, compared with the other three types of features, the SE has better separability for the four types of SRN samples.
5.2.2 Dual feature classification
In order to prove that the identification effect of simultaneously identifying the SE of two IMF components is better under dual feature extraction, KNN classifier is also adopted to perform dual feature extraction classification of four types of SRN. The selection of training samples and test samples is the same as in Section 5.1. The dual feature classification results of the four types of entropy for four types of SRN are shown in Figure 9.
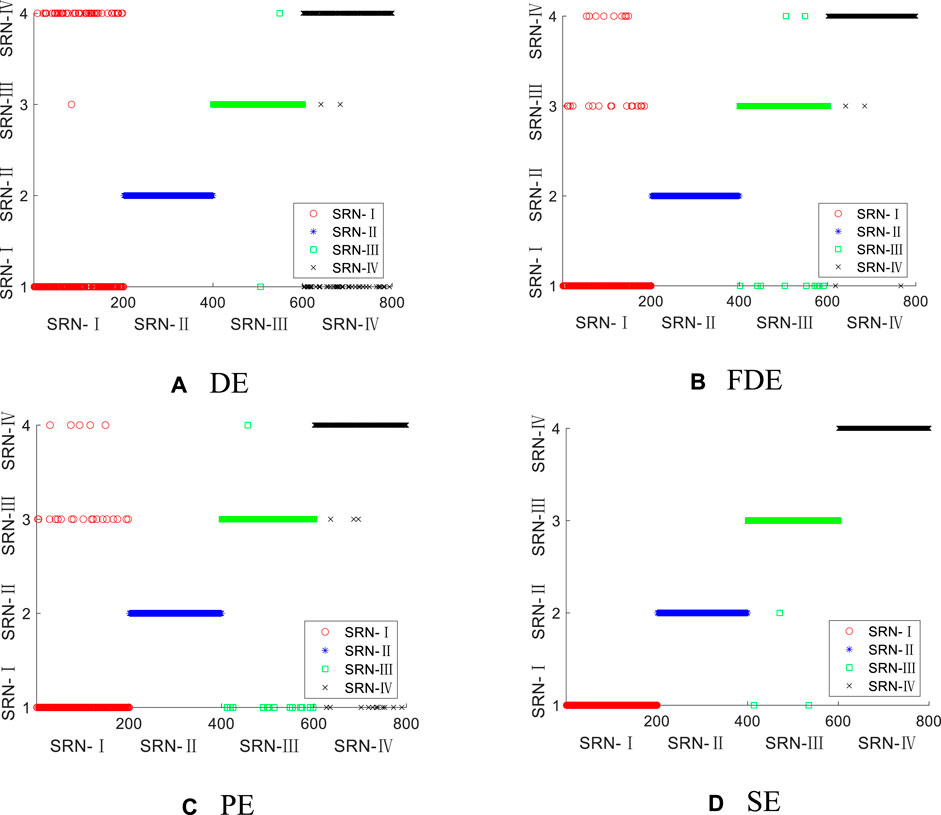
FIGURE 9. Dual feature classification results of four types of entropy for four types of SRN. (A) DE (B) FDE (C) PE (D) SE.
It can be seen from Figure 9 that under the dual feature extraction, the four types of entropy have improved the classification accuracy for the four types of SRN samples, and the SE samples have the highest classification accuracy; the classification of SRN-Ⅱ samples in DE, FDE and PE is completely correct, but some errors are found in SRN-Ⅰ, SRN-Ⅲ and SRN-Ⅳ samples; in SE, only three samples of SRN-Ⅲ are classified incorrectly, and the other three SRN samples are classified correctly. Through program operation, the highest average recognition rates of the four entropies under dual features are shown in Table 3, where (2, 3) in the table represents the selected modal components are IMF2 and IMF3, and so on.
As can be seen from the data in Table 3, the recognition rates of the four types of entropy for SRN all reach more than 90%. The SE has the highest recognition rate for the four types of SRN, up to 99.63%, which is 2.13%, 4.63%, and 6% higher than the recognition rates of DE, FDE and PE, respectively. This shows that the recognition effect of SE is the most significant.
To sum up, under dual feature extraction, although there are still some sample errors in the classification for the four types of SRN samples by the four types of entropy, the average recognition rate is greatly improved compared with the single feature extraction. The highest average recognition rate under dual feature extraction is still SE, which is 9.25% higher than the average recognition rate of 90.38% under single feature extraction.
5.3 Three feature extraction and classification
5.3.1 Three feature extraction
In view of the fact that the recognition rate of four kinds of entropy in dual feature extraction is greatly improved compared with single feature extraction, SE still has the highest recognition rate. Therefore, in order to further improve the recognition rate, this section classifies the four types of SRN by identifying the three IMF components. All parameters used in the experiment are the same as the data listed in Section 5.1. In the three-feature extraction experiment, according to the principle of permutation and combination, three IMF components are selected for combination, and a group of IMF components with the highest recognition rate is selected for feature extraction. Figure 10 shows the three-feature distribution of the IMF combination corresponding to the highest recognition accuracy of the four types of SRN, where the x, y, and z coordinates are the corresponding IMF components.
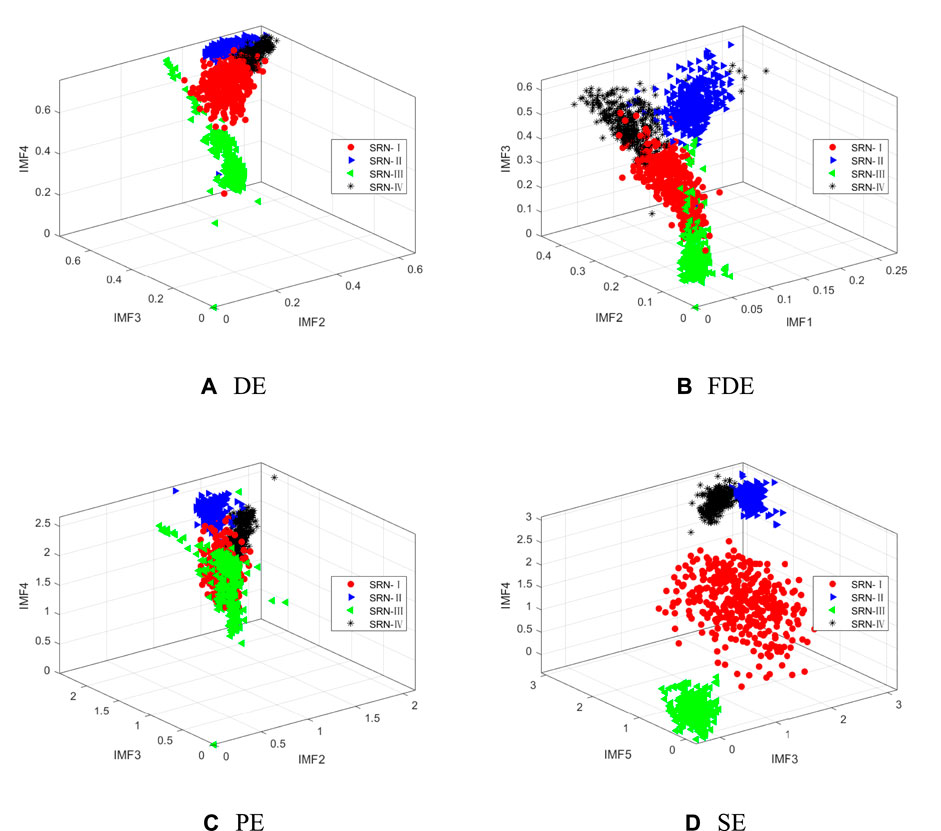
FIGURE 10. Three-feature distribution of the IMF combination corresponding to the highest recognition accuracy of the four types of SRN. (A) DE (B) FDE (C) PE (D) SE.
As shown in from Figure 10, under the three-features extraction, the SRN-I, SRN-II and SRN-IV samples in the DE and the FDE have partial entropy distributions overlapping, the SRN-III sample has a small amount of entropy mixed with SRN- I distribution; the four types of SRN in the PE have partial entropy aliasing; in the SE, only a few samples of SRN-II and SRN-IV have close entropy values. Experiments show that under the three-feature extraction, for the four types of SRN samples, the difference in the entropy value of the SE is the most obvious, so it has better distinguishing ability than the other three types of features.
5.3.2 Three feature classification
In order to prove that the identification effect of SE is better under three-feature extraction, KNN classifier is also introduced to perform three-feature classification of four types of SRN. The selection of training samples and test samples is the same as that in Section 5.1. The three-feature classification results of the four types of entropy for the four types of SRN are shown in Figure 11.
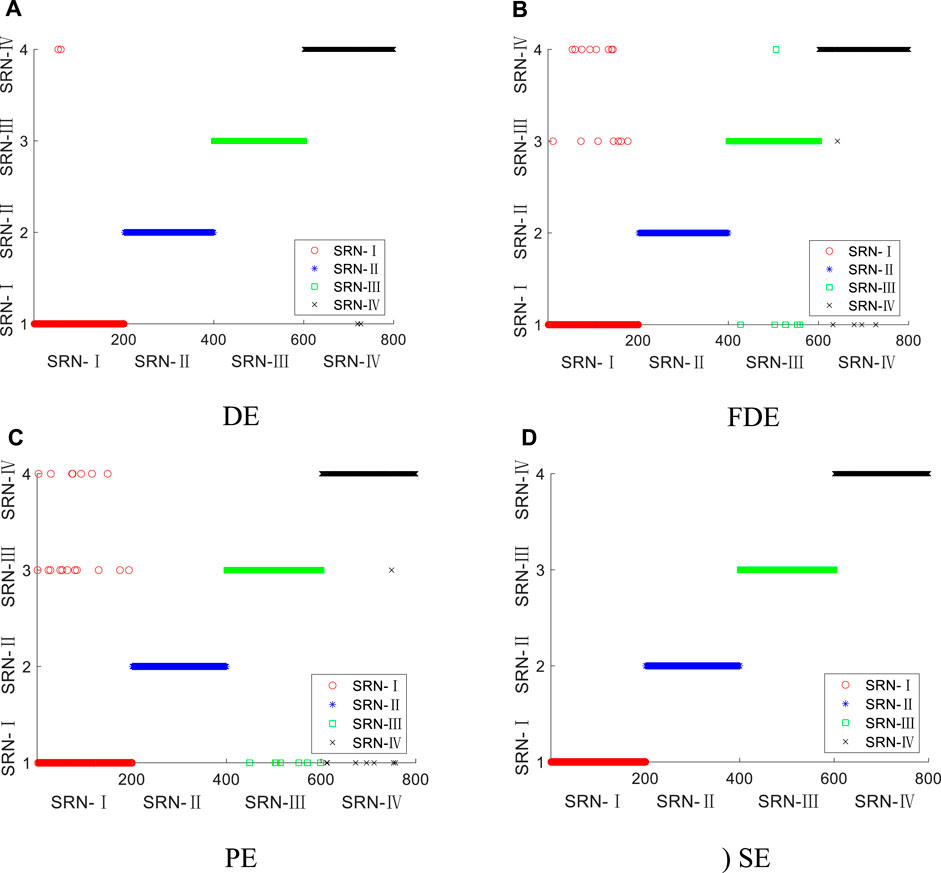
FIGURE 11. Three-feature classification results of the four types of entropy for the four types of SRN. (A) DE (B) FDE (C) PE (D) SE.
It can be seen from Figure 11 that under the three-feature extraction, the classification and recognition ability of the four types of entropy is greatly improved; the DE classification of SRN-Ⅱ and SRN-Ⅲ samples is completely correct, and only a few samples have errors in the DE classification of SRN-Ⅰ and SRN-Ⅳ; the FDE and PE are completely correct for the classification of SRN-Ⅱ samples, but some samples are wrong for SRN-Ⅰ, SRN-Ⅲ and SRN-Ⅳ; the classification of the four types of SRN samples by the SE is all correct. Experiments show that, compared with DE, FDE and PE, SE has a better ability to distinguish four types of SRN.
Through program operation, the highest average recognition rates of the four types of entropy under three-feature are shown in Table 4, where (1, 2, 7) in the table represents the selected IMF components are IMF1, IMF2 and IMF7, and so on.
From the data in Table 4, we can get that under the three-feature extraction, the four types of entropy have more than 95% recognition rates for SRN samples. Among them, the SE has the highest recognition rate of 100%, which is much higher than the SE under the single feature, and is also higher than the SE under the dual feature.
To sum up, under three feature extraction, the four types of entropy can greatly improve the recognition rate for the four types of SRN samples, and the classification performance of the SE is better than other entropies.
6 Conclusion
In this paper, BOA algorithm is introduced to realize the optimization of VMD parameters selection, and then BOA-VMD algorithm is proposed. Combined with the SE, a feature extraction method of SRN based on BOA-VMD and SE is proposed. The feasibility of the method is verified by simulation experiments and features extraction experiments of four SRNs. The main conclusions reached are as follows:
(1) In order to achieve the optimal selection of VMD parameters, the BOA algorithm is adhibited to optimize the VMD, called BOA-VMD. Compared with GA and PSO, the algorithm is more accurate and reliable, and can realize adaptive decomposition of signals in simulation experiments.
(2) In order to improve the effect of feature extraction and classification of SRN, this paper proposes a feature extraction method based on BOA-VMD and SE. Under single feature, the method achieves a remarkable effect on feature extraction, and the average recognition rate of SE is 90.38%, which is much higher than DE, FDE and PE.
(3) Compared with single feature, dual features and three features further improve the recognition rate of SRN. Compared with the other three entropies, the feature extraction method based on BOA-VMD and SE can obtain the highest recognition rate under the same number of features, furthermore, the three-feature recognition rate has reached 100%.
Data availability statement
The original contributions presented in the study are included in the article/Supplementary Material; further inquiries can be directed to the corresponding author.
Author contributions
YY and GT designed research, performed research, and analyzed data, and GT wrote the paper.
Funding
Key Research and Development Plan of Shaanxi Province (2020ZDLGY06-01) Key Scientific Research Project of Education Department of Shaanxi Province (21JY033) Science and Technology Plan of University Service Enterprise of Xi’an (2020KJRC0087).
Conflict of interest
The authors declare that the research was conducted in the absence of any commercial or financial relationships that could be construed as a potential conflict of interest.
Publisher’s note
All claims expressed in this article are solely those of the authors and do not necessarily represent those of their affiliated organizations, or those of the publisher, the editors and the reviewers. Any product that may be evaluated in this article, or claim that may be made by its manufacturer, is not guaranteed or endorsed by the publisher.
References
1. Wang S, Zeng X. Robust underwater noise targets classification using auditory inspired time–frequency analysis. Appl Acoust (2014) 78:68–76. doi:10.1016/j.apacoust.2013.11.003
2. Yang S, Li Z, Wang X. Ship recognition via its radiated sound: The fractal based approaches. The J Acoust Soc America (2002) 112(1):172–7. doi:10.1121/1.1487840
3. Esmaiel H, Xie D, Qasem ZAH, Sun H, Qi J, Wang J. Multi-stage feature extraction and classification for ship-radiated noise. Sensors (2022) 22(1):112. doi:10.3390/s22010112
4. Dragomiretskiy K, Zosso D. Variational mode decomposition. IEEE Trans Signal Process (2014) 62(3):531–44. doi:10.1109/tsp.2013.2288675
5. Mohanty S, Gupta KK, Raju KS. Hurst based vibro-acoustic feature extraction of bearing using EMD and VMD. Measurement (2018) 117:200–20. doi:10.1016/j.measurement.2017.12.012
6. Lei Z, Lei X, Zhou C, Qing L, Zhang Q, Chao W. Research on feature extraction of ship-radiated noise based on compressed sensing and center frequency. IEEE Access (2021) 9:128679–86. doi:10.1109/access.2021.3113042
7. Li Y, Li Y, Chen X, Yu J. A novel feature extraction method for ship-radiated noise based on variational mode decomposition and multi-scale permutation entropy. Entropy (2017) 19(7):342. doi:10.3390/e19070342
8. Chauhan S, Vashishtha G, Kumar A. A symbiosis of arithmetic optimizer with slime mould algorithm for improving global optimization and conventional design problem. J Supercomput (2022) 78(5):6234–74. doi:10.1007/s11227-021-04105-8
9. Li Y, Tang B, Jiang X, Yi Y. Bearing fault feature extraction method based on GA-VMD and center frequency. Math Probl Eng (2022) 2022:1–19. doi:10.1155/2022/2058258
10. Guo Z, Liu M, Wang Y, Qin H. A new fault diagnosis classifier for rolling bearing united multi-scale permutation entropy optimize VMD and cuckoo search SVM. IEEE Access (2020) 8:153610–29. doi:10.1109/access.2020.3018320
11. Li C, Peng T, Zhu Y. A novel approach for acoustic signal processing of a drum shearer based on improved variational mode decomposition and cluster Analysis. Sensors (2020) 20(10):2949. doi:10.3390/s20102949
12. Zhou F, Yang X, Shen J, Liu W. Fault diagnosis of hydraulic pumps using PSO-VMD and refined composite multiscale fluctuation dispersion entropy. Shock and Vibration (2020) 2020:1–13. doi:10.1155/2020/8840676
13. Xu W, Hu J. A novel parameter-adaptive VMD method based on grey wolf optimization with minimum average mutual information for incipient fault detection. Shock and Vibration (2021) 2021:1–14. doi:10.1155/2021/6640387
14. Ding J, Xiao D, Li X. Gear fault diagnosis based on genetic mutation particle swarm optimization VMD and probabilistic neural network algorithm. IEEE Access (2020) 8:18456–74. doi:10.1109/access.2020.2968382
15. Vashishtha G, Chauhan S, Kumar A, Kumar R. An ameliorated African vulture optimization algorithm to diagnose the rolling bearing defects. Meas Sci Technol (2022) 33(7):075013. doi:10.1088/1361-6501/ac656a
16. Arora S, Singh S. Butterfly optimization algorithm: A novel approach for global optimization. Soft Comput (2019) 23(3):715–34. doi:10.1007/s00500-018-3102-4
17. Li Z, Li Y, Zhang K, Guo J. A novel improved feature extraction technique for ship-radiated noise based on IITD and MDE. Entropy (2019) 21(12):1215. doi:10.3390/e21121215
18. Li Y, Jiao S, Geng B, Jiang X. Rcmfrde: Refined composite multiscale fluctuation-based reverse dispersion entropy for feature extraction of ship-radiated noise. Math Probl Eng (2021) 2021:7150921–18. doi:10.1155/2021/7150921
19. Yang H, Li L-L, Li G-H, Guan Q-R. A novel feature extraction method for ship-radiated noise. Defence Tech (2022) 18(4):604–17. doi:10.1016/j.dt.2021.03.012
20. Li Y, Geng B, Jiao S. Dispersion entropy-based lempel-ziv complexity: A new metric for signal analysis. Chaos Solitons Fractals (2022) 161:112400. doi:10.1016/j.chaos.2022.112400
21. Bandt C, Pompe B. Permutation entropy: A natural complexity measure for time series. Phys Rev Lett (2002) 88(17):174102. doi:10.1103/physrevlett.88.174102
22. Rostaghi M, Azami H. Dispersion entropy: A measure for time-series analysis. IEEE Signal Process Lett (2016) 23(5):610–4. doi:10.1109/lsp.2016.2542881
23. Azami H, Escudero J. Amplitude- and fluctuation-based dispersion entropy. Entropy (2018) 20(3):210. doi:10.3390/e20030210
24. Vashishtha G, Chauhan S, Yadav N, Kumar A, Kumar R. A two-level adaptive chirp mode decomposition and tangent entropy in estimation of single-valued neutrosophic cross-entropy for detecting impeller defects in centrifugal pump. Appl Acoust (2022) 197:108905. doi:10.1016/j.apacoust.2022.108905
25. Li Y-X, Li Y-A, Chen Z, Chen X. Feature extraction of ship-radiated noise based on permutation entropy of the intrinsic mode function with the highest energy. Entropy (2016) 18(11):393. doi:10.3390/e18110393
26. Li G, Hou Y, Yang H. A novel method for frequency feature extraction of ship radiated noise based on variational mode decomposition, double coupled Duffing chaotic oscillator and multivariate multiscale dispersion entropy. Alexandria Eng J (2022) 61(8):6329–47. doi:10.1016/j.aej.2021.11.059
27. Li Z, Li Y, Zhang K. A feature extraction method of ship-radiated noise based on fluctuation-based dispersion entropy and intrinsic time-scale decomposition. Entropy (2019) 21(7):693. doi:10.3390/e21070693
28. Cuesta-Frau D. Slope entropy: A new time series complexity estimator based on both symbolic patterns and amplitude information. Entropy (2019) 21(12):1167. doi:10.3390/e21121167
29. Cuesta-Frau D, Schneider J, Bakštein E, Vostatek P, Spaniel F, Novák D. Classification of actigraphy records from bipolar disorder patients using slope entropy: A feasibility study. Entropy (2020) 22(11):1243. doi:10.3390/e22111243
30. Li Y, Gao P, Tang B, Yi Y, Zhang J. Double feature extraction method of ship-radiated noise signal based on slope entropy and permutation entropy. Entropy (2022) 24(1):22. doi:10.3390/e24010022
31. Li Y, Tang B, Yi Y. A novel complexity-based mode feature representation for feature extraction of ship-radiated noise using VMD and slope entropy. Appl Acoust (2022) 196:108899. doi:10.1016/j.apacoust.2022.108899
32.National Park Service Available online: https://www.nps.gov/glba/learn/nature/soundclips.htmhttps://www.nps.gov/glba/learn/nature/soundclips.htm (Accessed July 10, 2022).
33. Venkatesan C, Karthigaikumar P, Varatharajan R. A novel LMS algorithm for ECG signal preprocessing and KNN classifier based abnormality detection. Multimed Tools Appl (2018) 77(8):10365–74. doi:10.1007/s11042-018-5762-6
34. Li G, Liu F, Yang H. Research on feature extraction method of ship radiated noise with K-nearest neighbor mutual information variational mode decomposition, neural network estimation time entropy and self-organizing map neural network. Measurement (2022) 199:111446. doi:10.1016/j.measurement.2022.111446
Keywords: ship radiated noise, slope entropy, feature extraction, variational mode decomposition, butterfly optimization algorithm
Citation: Yi Y and Tian G (2022) Feature extraction method of ship radiated noise based on BOA-VMD and slope entropy. Front. Phys. 10:1043070. doi: 10.3389/fphy.2022.1043070
Received: 13 September 2022; Accepted: 03 October 2022;
Published: 17 October 2022.
Edited by:
Govind Vashishtha, Sant Longowal Institute of Engineering and Technology, IndiaReviewed by:
Sumika Chauhan, National Institute of Technology Delhi, IndiaXiaohui Yang, Inner Mongolia University of Science and Technology, China
Xiao Chen, Shaanxi University of Science and Technology, China
Copyright © 2022 Yi and Tian. This is an open-access article distributed under the terms of the Creative Commons Attribution License (CC BY). The use, distribution or reproduction in other forums is permitted, provided the original author(s) and the copyright owner(s) are credited and that the original publication in this journal is cited, in accordance with accepted academic practice. No use, distribution or reproduction is permitted which does not comply with these terms.
*Correspondence: Ge Tian, MjIyMDMyMDA4M0BzdHUueGF1dC5lZHUuY24=
 Yingmin Yi1,2
 Ge Tian
