 Linjie Lv
 Yongjun Yang1
 Jibo Han
 Pengmou Ma
 Xiangmiao Chen
 Abdul Qayyum Khan
94% of researchers rate our articles as excellent or good
Learn more about the work of our research integrity team to safeguard the quality of each article we publish.
Find out more
ORIGINAL RESEARCH article
Front. Phys. , 09 December 2022
Sec. Optics and Photonics
Volume 10 - 2022 | https://doi.org/10.3389/fphy.2022.1037231
This article is part of the Research Topic Advances in Optical Frequency Comb Sources, Technology, and Applications View all 9 articles
In transient high-speed scenes such as chemical explosions, magnetic compression, electric explosion, and laser-driven flyer, the target object can accelerate from 0 to tens of km/s in a few nanoseconds. The time-stretched photon Doppler velocimetry uses the time-stretched interferometry to downscale the frequency of the Doppler shift signal in the optical domain, which breaks through the bandwidth limitations of photoelectric detectors and electrical digital to analog converters. A quasi-continuous time-stretched photon Doppler velocimetry (QT-PDV) is proposed in this paper, for the measurement of microsecond high-speed movement events. On the principle of hardware optical path, the velocity signal of the target object is encoded on multiple stretched chirp pulses, avoiding sampling interruptions and trigger condition limitations; in the signal demodulation methods, the error compensation algorithm is used to compensate for the frequency shift signal, which reduces the system error caused by the displacement and increases the effective recording time. This paper adopts the high-power nanosecond laser to drive the metal film to produce a high-speed target, where beat frequency was downscaled to 2.2 GHz from 4.4 GHz.
Speed is a physical quantity used to indicate how fast an object is moving and is directly related to the dynamic performance of the object. In dynamic compression experiments, the shock wave propagation in the sample can usually be accelerated from 0 to several km/s. It is a transient high-speed process, which is generated, propagated, and disappears in microseconds, nanoseconds, or even more minor time scales. The stress-strain state of the material can be deduced by measuring the mechanical parameters, such as the speed of the shock wave propagation in the sample. For example, the high-speed impact produced by the explosive-driven flyer was applied to the studied sample material. Through the measurement of the shock wave velocity in the sample, the stress-strain state of the sample material can be explained according to different theoretical models of the material state (elastic-plastic theory, viscoelastic theory or state equation, etc.).
Therefore, the development of a velocimetric instrument with an extensive dynamic range has important theoretical significance and broad application prospects for several research fields such as weapons design, new materials science, and geophysical studies of the Earth and planetary interiors (1–3).
Photon Doppler Velocimetry (PDV) (4) is widely used in transient high-speed scenarios such as high-pressure physics, space collision simulation, material forming, and explosive impact with its advantages of non-contact measurement, low-cost, easy-to-use, high-frequency response and good traceability of measurements. In transient high-speed measurement scenarios, the target object can accelerate from zero to tens of km/s in a few tens of nanoseconds. The bandwidth of PDV electrical digital-to-analog-conversion devices needs to reach GHz or even hundreds of GHz.
With the development of picosecond, femtosecond, and attosecond laser generation technology, ultrafast measurement has become a hot research field (5, 6). Ultrafast lasers are characterized by narrow pulses, broad spectra and high coherence, and are disperse into chirped pulses after passing through a dispersive medium. The time-stretching technique utilizes two-stage dispersive fiber to form the stretching factor to downscale the signal frequency. Due to the rapid progress of fiber laser technology brought by the development of the telecom industry, the time stretching method has been widely used in high-bandwidth real-time sampling (7), distance measurement (8), spectral measurement (9, 10), real-time imaging (11) and other fields (12).
In the field of speed measurement, A Benuzzi-Mounaix proposed chirped pulse spectral interferometry that encodes a Doppler signal onto a chirped pulse signal and obtains frequency-domain interferometric fringes through a Michelson interferometry in 1999 (13). The method designed to achieve femtosecond time-resolved velocity history measurements for a breakthrough in the current device time resolution capability limitations. In 2019, Mance J G et al., at the Nevada National Laboratory, proposed a time-stretched photon Doppler velocimetry (TS-PDV). The speed signal is also encoded onto the chirp pulse, and after a second dispersion, the Doppler frequency is downscaled in the optical domain to extend the speed measurement range. A 20 GHz bandwidth detector is used to measure Doppler shift signals at 50 GHz (14).
TS-PDV selects a single pulse through the pulse selector to achieve a large downscaling ratio. It uses the dispersion fiber as the dispersion device to complete the 150 ns time stretch with a stretch factor of 0.276, and the detonation velocity measured on the Z machine reaches 44 km/s. The method has a large frequency downscaling factor, high time resolution, and a larger velocity measurement range for nanosecond velocity measurement events. However, the laser and acquisition device need appropriate trigger conditions to ensure that the velocity signal can be collected at the time of pulse arrival. The velocity signal can only be effectively captured at the time of pulse arrival, and the pulse stretch width determines the measurement time. Therefore, the measurement time of this method is limited to hundreds of nanoseconds because of the cost limitation of the stretching device.
In this paper, an quasi-continuous time-stretched photonic Doppler velocimetry (QT-PDV) for microsecond velocity signal measurements is proposed, where the velocity signal is encoded onto multiple chirp pulses, avoiding sampling interruptions and trigger condition limitations. In the signal demodulation, a displacement error compensation algorithm is proposed to reduce the system error caused by displacement and thus increase the effective recording time.
There are two main approaches in engineering to extend the range of speed measurements to meet higher speed measurement demand scenarios. One of the methods, called leapfrog-PDV, uses multiple lasers of different wavelengths to achieve the speed range expansion in a cascade method. Various lasers of different wavelengths are used as reference signals for different channels, and different channels are used to reduce the beat frequency by increasing the reference optical frequency of Ref. (15). Leapfrog-PDV light source is an continuous-wave laser, which inherits the advantages of continuous measurement and high accuracy of PDV. However, the leapfrog-PDV method must be equipped with multiple lasers and photodetectors. This cascade mode makes the system more complex. The demand for higher speed measurement cannot be solved by adding lasers. The other method TS-PDV uses femtosecond laser time-stretched spectral interferometry to realize signal frequency downscaling in the optical domain, reducing the bandwidth pressure on photodetectors and digital-to-analog conversion devices and providing a novel solution for transient high-speed measurement.
Mode-locked light sources emit pulses that are femtosecond in the time domain and tens of nanometers wide in the spectral domain. Femtosecond lasers contain lasers with different frequency components. After passing through a long-distance fiber, femtosecond lasers with different frequency components have different times to pass through the fiber, due to their own different propagation speeds in the fiber. After transmission within the single-mode fiber of length
Where
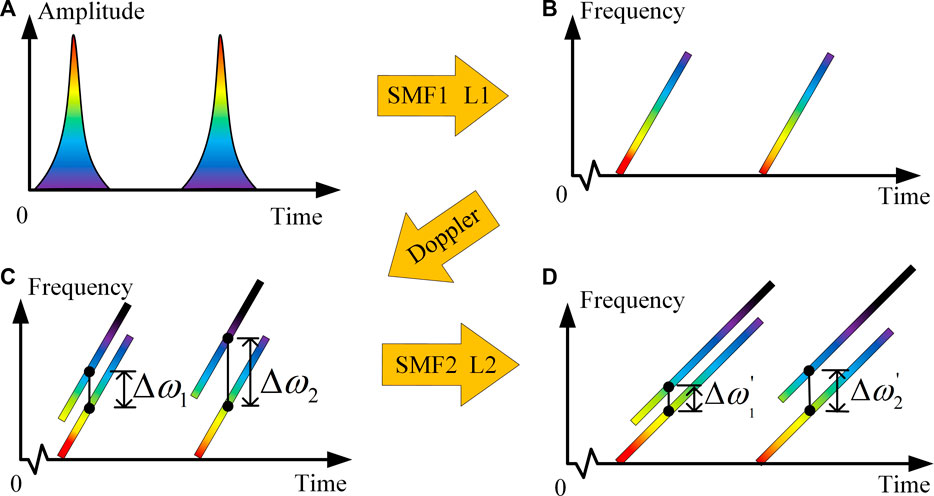
FIGURE 1. Schematic diagram of time-stretched principle. SMF1
When the signal pulse hits the moving target object, the signal light is frequency shifted due to the optical Doppler effect. The returned signal optical frequency is given from the Doppler shift formula of the laser
Where
Since the object moving speed
and the time-frequency distribution of signal light can be described as:
Signal and reference light arriving at the photodetector at the same time produce the beat interference signal. At this time, signal and reference pulse’s transmission time are equal
According to Eq. 7, we can obtain the differential frequency signal with lower frequency by controlling the length ratio of the first-order dispersive fiber
In this system, femtosecond laser is dispersed as a chirped pulse signal through the first-order dispersive fiber. Although the delay time of the two channels is equal in the initial state, the movement of the target object causes the light range of the signal channel to change continuously. The delay difference between the reference and the measuring channel will also produce frequency difference signal. Therefore, the difference frequency signal of the system not only contains the Doppler signal, but is also produced by the change of displacement.
After the first-order dispersion, the femtosecond pulse width
Where
Time delay difference due to displacement
In a transient high-speed measurement scene at the microsecond level, the target usually moves within a few millimeters of the field of view, resulting in a frequency difference signal that can reach hundreds of MHz. Therefore, we need to write an algorithm to compensate the experimental results.
The frequency signal demodulated by the system is generated by two factors: velocity and displacement. As the object moves, the optical length of the measurement path becomes shorter, and the frequency caused by displacement will counteract part of the measurement path frequency signal. Therefore, the frequency difference signal due to displacement will reduce the total frequency difference signal. At the initial time, the target object is stationary. The initial velocity
The laser of the system is a 50 MHz mode-locked laser, whose pulse width is 200 fs To reduce the nonlinear effect of femtosecond pulses in the long-distance fiber, the femtosecond laser power is attenuated to 1 mW. After the optical filter (OF), the spectral range of the output pulse is 1559 nm–1562 nm. First-order dispersion fiber using a length of 100 km single-mode fiber SMF1, through the three-port circulator and fiber reflector to obtain 200 km stretch effect. Femtosecond lasers disperse into chirped pulses of 10 ns after passing through a first-order dispersive fiber. The nonlinear effect of femtosecond pulse in long-distance fiber is reduced by distributed Raman fiber amplification. Delayer controls the same delay length of the reference and measurement channels. EDFA2 acts as a power amplifier to amplify laser power to 1 W. The returned measured pulse is mixed with the reference path signal in the Coupler2. The second-stage dispersive fiber SMF2 also uses the combination of the three-port circulator, 100 km single-mode fiber and fiber mirror to achieve the dispersion effect of 200 km. After second-order dispersion of the fiber, the femtosecond laser is dispersed into a 20 ns chirped pulse signal, which just covers the entire pulse period. After the dispersion of the second-order dispersive fiber, the scaling factor
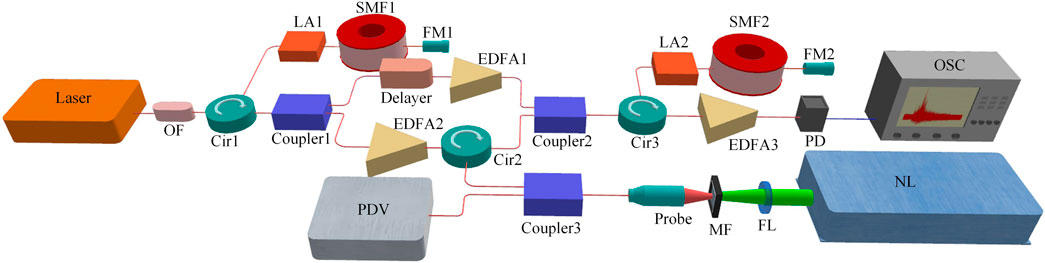
FIGURE 2. Simplified schematic of TS-PDV system. Laser: 50 MHz Mode-Locked Laser, OF: optical filter, Cir1, Cir2 and Cir3: three-port fiber-optic circulator, RA1 and RA2: Raman Amplifier, SMF1 and SMF2: 100 km single mode fiber, FM1 and FM2: fiber mirror, Coupler1 and Coupler2: 90/10 and 50/50, EDFA1, EDFA2 and EDFA3: doped fiber amplifier, Probe: fiber focus lens, MF: metal film, FL: focus lens, NL: nanosecond laser, PD: photoelectric detector, OSC: DSA91304 KEYSIGHT, bandwidth 13 GHz and sampling frequency 40 GSa/s oscilloscopes.
The measurement system uses nanosecond laser to drive flyer to generate transient high-speed moving target. High power Nd-YAG nanosecond laser (Vlite-200) is selected as the driving laser. The laser pulse (532 nm, 8 ns, 138.8 mJ) was focused through a 3 μm thick aluminum film. The focused spot is a circular area with a diameter of 700 μm, the power density reached
The experiment selected short-time Fourier transform (STFT) as the time-frequency analysis algorithm. In the experiment, the oscilloscope sampling rate is 20 GSa/s. The time interval between each sampling point is 50 ps The time window of STFT contains 1,024 sampling points, and the time length of each window is 50 ns The femtosecond laser has a repetition period of 20 ns, which is less than the length of a single time window, so details more minor than the pulse period can be ignored.
Time-frequency distribution diagram, which is measured by PDV (as shown in Figure 3A) and QT-PDV (as shown in Figure 3B). The upper part is the time-frequency diagram and the lower part is the time-domain waveform collected by the oscilloscope. The time-frequency figure after the flight phase of flyer appears relatively decentralized state. When the nanosecond laser driving metal film, the metal film is not a complete flyer. The flyer consists of a large amount of metal particles. Metal particles at different locations have different velocities and directions, carrying different frequencies of the Doppler effect signal. Therefore, the time-frequency diagram shows a relatively dispersed state.
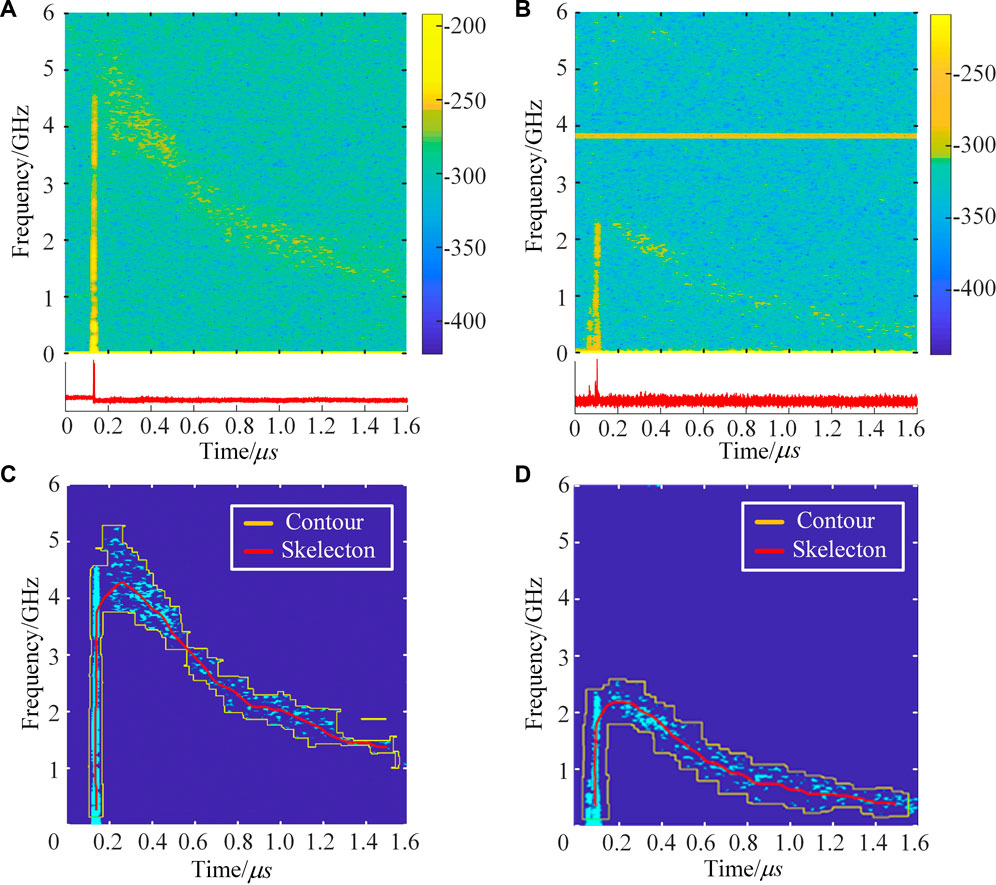
FIGURE 3. Comparison of the time-frequency ridge extraction diagram measured by different systems. (A) Time-frequency energy map measured by PDV, (B) Time-frequency energy map measured by QT-PDV. After image processing by thresholding, skeleton extraction, filtering, and connectivity, After image processing by thresholding, skeleton extraction, filtering, and connectivity, the yellow line indicates the extraction outline and the red line indicates the extraction skeleton. (C) Extraction of PDV time-frequency energy map ridges by image processing algorithm, (D) Extraction of PDV time-frequency energy map ridges by image processing algorithm.
The energy ridge of the velocity curve is extracted by an image processing algorithm. Firstly, the time-frequency map is preprocessed by threshold processing, and then the energy ridge is extracted by skeleton extraction, screening, and connectivity algorithm. As shown in Figure 3C and Figure 3D, the yellow contour is the region selected by image processing. The middle red curve is the energy ridge, which is extracted by the skeleton extraction algorithm. After the energy ridge coordinates are extracted, the final Doppler shift curve is obtained by interpolation fitting and smoothing.
The peak Doppler shift frequency of the target object is 4.4 GHz, and after the downscaling factor of 1/2 time stretching, the beat frequency with a peak of 2.2 GHz is obtained, as can be seen in Figure 3. After the time-frequency energy ridges of the flyer were obtained by the image processing algorithm, the displacement error compensation algorithm was used to compensate the system result. The displacement-time curve calculated by the displacement error compensation algorithm was shown in Figure 4A, and the flyer recording distance is about 2.45 mm. The frequency difference generated by the displacement will reach 300 MHz.
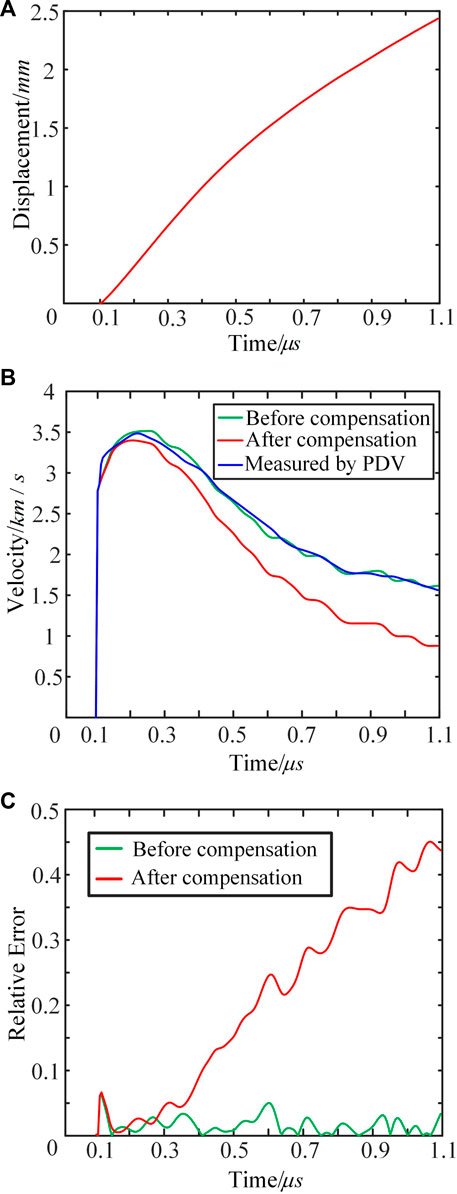
FIGURE 4. QT-PDV displacement error compensation algorithm processing results. The velocity and displacement are separated from the frequency domain by Eq. 9 to compensate the measurement results. (A) Is the displacement signal separated in the frequency domain, (B) is the comparison graph of the velocity signal before and after compensation of the QT-PDV measurement results, the red line indicates the velocity signal before compensation, the green line indicates the velocity signal after compensation, and the blue line indicates the measurement results of the PDV velocity signal, (C) the relative error graph before and after compensation of the velocity signal measured by QT-PDV.
The velocity curve, as shown in Figure 4B, is obtained after image processing and extraction algorithm. The PDV measurement results are used as the reference value of QT-PDV. Compared with the reference value, the system error caused by displacement becomes larger, and the dynamic system error caused by displacement finally reaches 45% (as shown in Figure 4C. After the displacement error compensation algorithm, the system error and the dynamic error of the PDV reference velocity are significantly reduced. The main reason for the large fluctuation in the relative error is caused by the image processing process of energy ridge extraction. The energy distribution in the time-frequency graph is scattered. The flyer is accelerated from zero to 3 km/s in the first 20 ns time. Then the flyer breaks away from the metal film and presents a broken powder state. The energy distribution in the frequency domain is broadened and the extracted energy distribution profile of interest is too large, which affects the accurate extraction of the time-frequency ridges. The maximum speed measurement error reached 6.32%, but the overall speed measurement error distribution was within 5%.
The QT-PDV realizes frequency downscaling quasi-continuous processing in optical domain through multi-pulses sampling time stretching interference method, and completes the speed measurement of high-speed flyers within 1 µs The stretch ratio reaches 1/2 and the Doppler shift signal of 4.4 GHz is downscaled to 2.2 GHz. The article verifies the feasibility of QT-PDV principle through microsecond transient high-speed experiments.
The system ignores the motion change of the target object within the pulse period, so the time resolution is limited to the scene of nanosecond resolution. It depends on the pulse period of the light source. There is still a large space for optimization in techniques such as high time resolution, the scaling factor of time stretch, displacement compensation, time-frequency ridge extraction and so on. This method is suitable for microseconds high velocity scenarios, such as high-power pulsed laser, magnetic drive, electric explosion, chemical explosion and another dynamic high-pressure loading flying-plate velocity measurement fields. The system can adjust the stretch ratio flexibly and downscaled the frequency to 10 times in theory, so it has more obvious advantage in velocity measurement of ultra-high-speed target flyer.
The raw data supporting the conclusion of this article will be made available by the authors, without undue reservation.
TW and YY contributed to the original idea of the study and the allocation of the fund to support the study. LL, JH, PM, XC, and AK performed the experiments and analysed the data. All authors wrote and contributed to the final version of the manuscript and approved the submission.
This research was funded by the National Natural Science Foundation of China with grant no. 62175229.
The authors declare that the research was conducted in the absence of any commercial or financial relationships that could be construed as a potential conflict of interest.
All claims expressed in this article are solely those of the authors and do not necessarily represent those of their affiliated organizations, or those of the publisher, the editors and the reviewers. Any product that may be evaluated in this article, or claim that may be made by its manufacturer, is not guaranteed or endorsed by the publisher.
1. Wang CH, Lee H, Hsu YH, Lee SS, Huang JW, Wu WJ, et al. Photonic Doppler Velocimetry for high-speed fragment generator measurements. Opt Express (2020) 28(3):3864–78. doi:10.1364/OE.377832
2. Dolan DH. Extreme measurements with photonic Doppler velocimetry (PDV). Rev Sci Instrum (2020) 91(5):051501. doi:10.1063/5.0004363
3. Stanley B, Allan C, Micheal K, Vivek A, Daehn G, Niezgoda S. Measurement and characterization of nanosecond laser driven shockwaves utilizing photon Doppler velocimetry. J Appl Phys (2021) 20(129):205101. doi:10.1063/5.0048610
4. Strand OT, Goosman DR, Martinez C, Whitworth TL, Kuhlow WW. Compact system for high-speed velocimetry using heterodyne techniques. Rev Scientific Instr (2006) 77(8):083108. doi:10.1063/1.2336749
5. Fortier T, Baumann E. 20 years of developments in optical frequency comb technology and applications. Commun Phys (2019) 3(1):153–27. doi:10.1038/s42005-019-0249-y
6. Godin T, Sader L, Anahita K. K., Hanzard PH, Hideur A, Moss DJ, et al. Recent advances on time-stretch dispersive Fourier transform and its applications. Adv Phys X (2022) 7(1):2067487. doi:10.1080/23746149.2022.2067487
7. Li YH, Zhu K, Kang Z, Ho WL, Davidson R, Lu C, et al. CMOS-compatible high-index doped silica waveguide with an embedded silicon-nanocrystal strip for all-optical analog-to-digital conversion. Photon Res (2019) 7(10):1200–8. doi:10.1364/PRJ.7.001200
8. Zhao LJ, Zhao CB, Xia CQ, Zhang Z, Wu T, Xia H. Nanometer precision time-stretch femtosecond laser metrology using phase delay retrieval. J Lightwave Technol (2021) 39(15):5156–62. doi:10.1109/JLT.2021.3079127
9. Mance JG, La Lone BM, Madajian JA, Turley WD, Veeser LR. Time-stretch spectroscopy for fast infrared absorption spectra of acetylene and hydroxyl radicals during combustion. Opt Express (2020) 28(20):29004–15. doi:10.1364/OE.401737
10. Zhang Z, Xia H, Yu S, Zhao L, Wei T, Li M. Femtosecond imbalanced time-stretch spectroscopy for ultrafast gas detection. Appl Phys Lett (2020) 116(17):171106. doi:10.1063/1.5143790
11. Goda K, Tsia KK, Jalia B. Serial time-encoded amplified imaging for real-time observation of fast dynamic phenomena. Nature (2009) 458:1145–9. doi:10.1038/nature07980
12. Mahjoubfar A, Churkin DV, Barland S, Broderick N, Turitsyn SK, Jalali B. Time stretch and its applications. Nat Photon (2017) 1111(66):341–51. doi:10.1038/nphoton.2017.76
13. Benuzzi-Mounaix A, Koenig M, Boudenne JM, Hall TA, Batani D, Scianitti F, et al. Chirped pulse reflectivity and frequency domain interferometry in laser driven shock experiments. Phys Rev E (1999) 60(3):R2488–91. doi:10.1103/physreve.60.r2488
14. Mance JG, La Lone BM, Dolan DH, Payne SL, Ramsey DL, Veeser LR. Time-stretched photonic Doppler velocimetry. Opt Express (2019) 27(18):25022–30. doi:10.1364/OE.27.025022
Keywords: ultrafast measurement, time-stretch, photon Doppler velocimetry, laser-driven flyer, transient high-speed, dispersive fourier transform, femtosecond (fs) laser
Citation: Lv L, Yang Y, Wu T, Han J, Ma P, Chen X and Khan AQ (2022) Quasi-continuous time-stretched photon Doppler velocimetry. Front. Phys. 10:1037231. doi: 10.3389/fphy.2022.1037231
Received: 05 September 2022; Accepted: 14 November 2022;
Published: 09 December 2022.
Edited by:
Jinghua Sun, Dongguan University of Technology, ChinaReviewed by:
Zuxing Zhang, Nanjing University of Posts and Telecommunications, ChinaCopyright © 2022 Lv, Yang, Wu, Han, Ma, Chen and Khan. This is an open-access article distributed under the terms of the Creative Commons Attribution License (CC BY). The use, distribution or reproduction in other forums is permitted, provided the original author(s) and the copyright owner(s) are credited and that the original publication in this journal is cited, in accordance with accepted academic practice. No use, distribution or reproduction is permitted which does not comply with these terms.
*Correspondence: Tengfei Wu, d3V0ZW5nZmVpQGNpbW0uY29tLmNu
Disclaimer: All claims expressed in this article are solely those of the authors and do not necessarily represent those of their affiliated organizations, or those of the publisher, the editors and the reviewers. Any product that may be evaluated in this article or claim that may be made by its manufacturer is not guaranteed or endorsed by the publisher.
Research integrity at Frontiers
Learn more about the work of our research integrity team to safeguard the quality of each article we publish.