- 1Jilin Provincial Key Laboratory of Space Optoelectronics Technology, Changchun University of Science and Technology, Changchun, China
- 2Institute of Optoelectronic Engineering, Changchun University of Science and Technology, Changchun, China
The vertical polarization distribution pattern of sea fog multilayer media and skylight in the atmosphere is explored. To change the complicated maritime environment, the simplified double layer structure of the atmosphere and sea fog is employed, and the scattering coefficients of the uniform atmosphere and sea fog medium are derived using the Rayleigh and Mie scattering methods, respectively. Using the adding-doubling method (RT3) based on the vector radiation transmission equation, the transmission of radiation between the two layers of the medium is calculated to obtain the polarization distribution conditions of skylight, and the variation tendency of the polarization characteristics observed from the ground is studied for the downwelling radiation of sea fog on the meridian of the Sun. An indoor sea fog setting was employed to perform the polarization transmission test, and the relationship between humidity, light intensity transmittance, and polarization degree was explored. The data suggest that the Sun’s position gives the lowest degree of polarization (DOP), and that the maximum value is obtained when the angle between the solar altitude angle and the observed altitude angle is 90°. Short wavelength lasers have a higher influence on optical transmittance than long wavelength lasers do when humidity levels increase. The circular polarization effect of long wavelength laser is better in damp surroundings.
1 Introduction
The production process of the atmosphere in the natural environment, especially the marine lower atmosphere where advection cooling fog predominates, entails forcing the air to acquire saturation and then correctly allowing for some oversaturation to terminate [1, 18]. The study of sky polarization distribution in complex marine environments is of great significance to the fields of marine transportation, marine target detection, and marine development because the presence of air-sea fog creates a partial natural light through the sea fog particles and atmospheric molecules like multilayer dielectric scattering, increasing the sky light’s polarization properties [2, 3].
Combined Many academics have undertaken some studies based on the polarization distribution features of sky light, both in theory and simulation. Based on the literature [4], Rayleigh atmospheric polarization mode offered a type of the Sun and a mechanism for calculating the location of the meridian in space, and it employed cluster analysis to determine the solar position. The polarization mode of the full Moon sky in clear weather is explored in literature [5]. The distribution of polarization properties of the Sun and moonlight sky are explored using simulation and test techniques, respectively, both of which are based on the Rayleigh theory. In literature [6], vector polarization analysis device was utilized to detect the polarization information of air dispersed light. Based on Mie scattering theory, the link between the polarization features of air dispersed light and the location of the Sun and scattering particles was explored. All of the aforementioned research that was done to illustrate the polarization distribution patterns had a certain influence, yet the study was done in sunny settings. The vector radiative transfer equation is generally utilised as the core transmission theory for studies on foggy weather and other difficult weather situations. The vector radiative transfer equation, which covers the transmission mechanism, characteristics, and transmission rules of polarization and other radiant rays in the medium, is regarded to be the basic equation driving scattering behavior [7, 8]. In the literature [9], the monte Carlo method was employed to simulate the polarization mode of the water cloud atmosphere throughout the entire sky under various solar altitude angles, and the impact of optical thickness and effective radius on polarization characteristics under water cloud conditions was investigated. The literature [10] propose a full-sky polarization imaging navigation method adapted to urban environments. A compact full-sky polarimeter is established, and a specific pattern inpainting algorithm based on convolution operation is proposed to amend the navigation errors caused by obscurations. Among 174 sets of comparative experiments, 90.2% of the extraction results are improved after inpainting, which verifies the effectiveness and robustness of the method.
The distribution pattern for the atmosphere—sea fog sky light polarization within the framework of inquiry is relatively few because of the complicated maritime environment. To widen the application of polarization detection and enhance our knowledge of the characteristics of polarization distribution in the sky under vertical observation of challenging marine environment. In this work, the intricate maritime environment is reproduced using a simplified double-layer model of the atmosphere and sea fog. The Rayleigh and Mie scattering techniques are used to estimate the particle distribution properties of the atmosphere and sea fog, respectively. The RT3 approach is then used to simulate the sea fog’s ambient radiation polarization qualities at different degrees of visibility, with a focus on the Sun’s usual optical wavelengths on the meridian, the Sun’s location, the observation site, and changes to factors like visibility. High-precision imaging detection of ocean objects is enabled theoretically and technically by this.
2 Simulation of polarization transmission in sea fog environment
2.1 Polarization modeling of sky based on RT3 method
According to the particle qualities of each layer, the nonuniform layer in the RT3 approach may be split into several thin, uniform layers. Calculating the different reflection and transmission processes between the two layers enables one to derive the radiation and transmission characteristics of the whole nonuniform layer based on the process of solving the vector radiative transfer equation.
The interaction of monochromatic radiation with the atmosphere and the resulting changes are represented by the radiative transfer equation. Considering the impacts of elements such as optical thickness
Among them,
The scattering matrix in Eq. 1 above is further enlarged, and the scattering matrix
Where,
For rotational symmetry particle phase matrix
In the preceding formula, when the particle is spherical, there are
The elements of the phase matrix
Where,
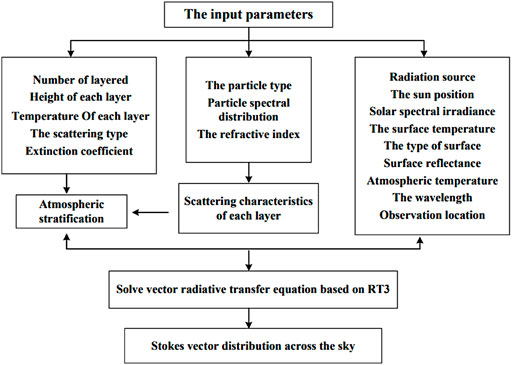
Figure 1 displays the vector radiative transfer equation's RT3-based solution approach. First, the information on interlayer temperature and extinction coefficient is used to categorize the atmosphere; the information on particle type, particle spectrum distribution, and refractive index is used to determine the scattering properties of each layer; then, the solar position, radiation source information, surface information and atmospheric stratification are input into the radiation transfer equation based on RT3 for calculation, the reflection and transmission properties of the whole atmosphere are obtained, and the Stokes vector distribution of each scattering point in the whole sky is obtained.
2.2 Validation of polarization transport model
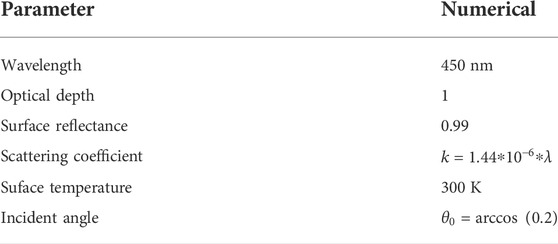
Set in clear weather conditions for verification, and the particles are uniformly distributed. Input parameters according to Table 1, and analyze the simulation results.
The test results are shown in Figure 2. The test particles are assumed to obey gamma distribution, and the average effective radius is
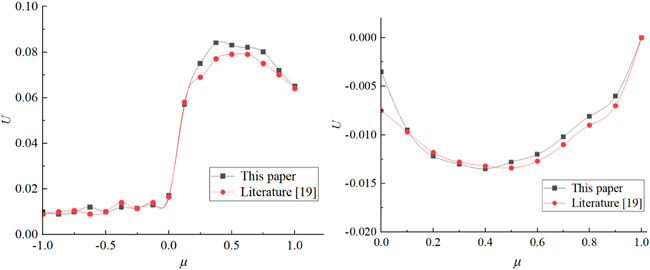
FIGURE 2. Values of I (left) and V (right) components at an Angle of 90° at the bottom of the atmosphere.
As can be seen from Figure 2, the results of I and V components calculated by the polarization transport model of sea fog in this paper are basically consistent with the results in the literature. When the optical thickness is small, there is some error between the results in this paper and the results in the reference, but with the increase of the optical thickness, the results in this paper are consistent with the overall trend of the results in the literature. It shows that the polarization transport model of sea fog based on RT3 is correct to calculate the radiative transport problem of scattering medium.
3 Multilayer particle dispersion characteristics in complicated atmosphere-sea fog environment
3.1 Headings Stratification of atmosphere-sea fog complex environment
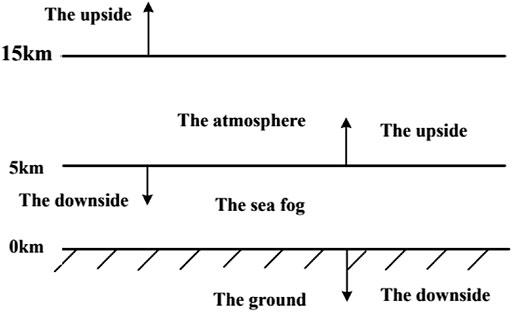
The marine environment, which comprises the atmosphere and the sea fog layer with progressively diminishing visibility, may be conceived of as a multi-layer complex medium dependent on the shifting fog concentrations. Refer to the American standard atmospheric model [12] to simplify the calculation because of the complexity of the scenario to be taken into consideration when dividing the atmosphere sea fog environment according to the actual sea fog weather. The total atmospheric sea fog environment is separated into two uniform layers, namely the sea fog layer and the atmosphere [13], as indicated in Figure 3, based on the numerous dispersed particles and water vapor present in each layer when it is sunny. Because of Rayleigh scattering, the atmospheric water vapor amount between 5 and 15 km is smaller. The 0–5 km sea fog layer has a large particle diameter and a sophisticated scattering process, which is mainly estimated using Mie scattering.
3.2 The marine fog particle distribution characteristics
The geography, weather, time, and other elements all have an influence on the particle size distribution of the sea fog layer. The most prevalent model, the gamma distribution model, may typically describe fog droplets [14]
Among them,
The range of advection fog in a sea fog environment is wider, the concentration of sea fog is thicker, and the sea fog fills a broader region of the environment. The following connection exists between water content and visibility for the advection fog
The association between sea fog particle size distribution and visibility may then be found.
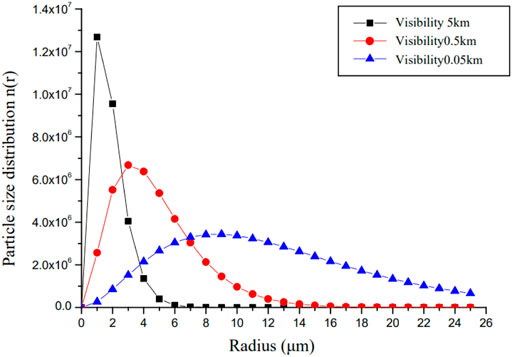
The particle size distribution of dense sea fog, middle sea fog, and light sea fog can be obtained by substituting it into Eq. 10, as shown in Figure 4, if the sea surface fog is assumed to be composed of fog, medium fog, and light fog respectively, and the typical visibility is selected as 0.05, 0.5, and 5 km, respectively. The modified Gamma distribution's mode radii for heavy sea fog, moderate sea fog, and light sea fog are 8.676
4 Air—sea fog polarization simulation results and analysis
4.1 The sea fog particle scattering characteristics
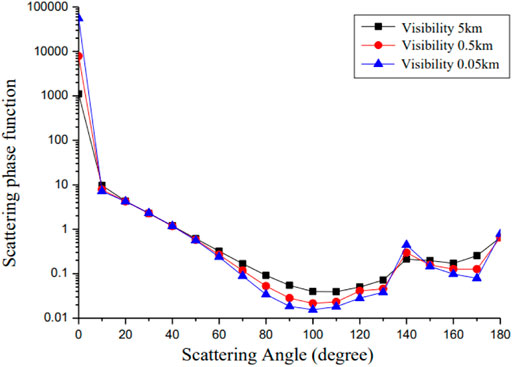
It is reasonable to infer that fog, medium fog, and light fog fulfill the criteria under the modified Gamma distribution by evaluating the distribution properties of the sea fog layer at 3.2 nodes. The relationship between the scattering phase function and scattering Angle, which is the first term of the scattering matrix, is solved in accordance with Mie scattering theory for uniform, uniform, and spherical sea fog particles in order to study the impact of sea fog particles with different concentrations on the scattering characteristics of polarized light, as shown in Figure 5. The scattering of light is notably concentrated at one narrow angle of a few degrees ahead, as seen in the illustration, and is roughly four orders of magnitude greater than diffused light in other directions. The scattering phase function continues expanding as visibility declines, which is to say as sea fog concentration grows. This leads the whole scattering environment to drift toward forward scattering. The distribution of polarization modes in the atmosphere and sea fog sky may be explored by studying the scattering characteristics of particles in the sea fog layer.
4.2 Air—sea fog sky polarization mode
In order to mimic the sea fog environment more accurately, according to the description of the stratification of the complex atmosphere and sea fog environment in Section 4.1, it is separated into two levels. The solar zest Angle is
The link between the degree of polarization and the observation angle under varying visibility circumstances at three wavelengths is represented in Figure 6. Under sea fog, the three visibility's degree of polarization variation trend is practically the same. The degree of polarization achieves its minimum value and is very close to zero when the observation altitude angle is equal to the solar altitude angle of 30°. The maximum degree of polarization may be reached when the angle between the observation height and the solar altitude is 90°. This phenomenon corresponds to the location of the lowest and highest values observed in the atmospheric theoretical model based on Rayleigh scattering [15]. The polarization value constantly grows as eyesight progressively declines. This is owing to the fact that when vision drops, the average radius of the particles rises (as illustrated in Figure 3). (as shown in Figure 3). As particle size rises, polarization values climb [16], and as particle counts grow in thick marine fog, scattering rates rise as well, increasing the possibility that unbiased sunlight will become polarized after additional scattering [17]. Therefore, the degree of polarization grows as eyesight declines, and this phenomenon becomes more noticeable as the viewing angle increases. The impact of polarization degree on particle form is minor and the polarization degree is practically the same when the observed height Angle is small (less than 90), i.e., when the scattering Angle generated by the solar height Angle and the observed height Angle is minimal. The comparable trend may be discovered by comparing the simulation results of three distinct wavelengths.

FIGURE 6. DOP and measured altitude angle correlations in varying visibility situations. (A) 450 nm; (B) 532 nm; (C) 671 nm.
Figure 7 depicts the link between polarization degree and wavelength for three distinct forms of vision under visible light wavelengths. Along with the change in observation height Angle under the same visibility progressively decreasing with rising wavelength, polarization degree is connected to particle size parameter

FIGURE 7. DOP and measured altitude angle correlations for different wavelengths. (A) slight mist V=5 km; (B) moderate fog V=0.5 km;(C) dense fog V=0.05 km.
A multi-layer maritime fog environment simulation system that will be created inside for the actual test is suggested. To verify the stability of the test, a semi-realistic object simulation environment is developed and white light is utilised to imitate unpolarized sunlight. As proven by the actual simulation results, it is designed to employ a spectrometer and polarizer in the open air to measure the downward radiation value of an observation point on the sea surface. It is tough to test the sky polarization mode in an air-sea fog environment, which is also the next specific research challenge of this work, owing to the limits of the sea surface environment produced by sea fog, waves, and other elements. However, a theoretical foundation for evaluating the sky polarization mode in an air and sea fog multi-layer environment may be built by theoretical analysis of the simulation data and comparison with the standard Rayleigh scattering model in sunny weather.
5 Polarization transmission characteristics test in sea fog environment
5.1 The experimental device
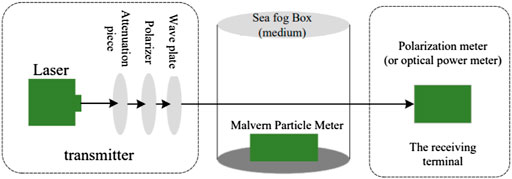
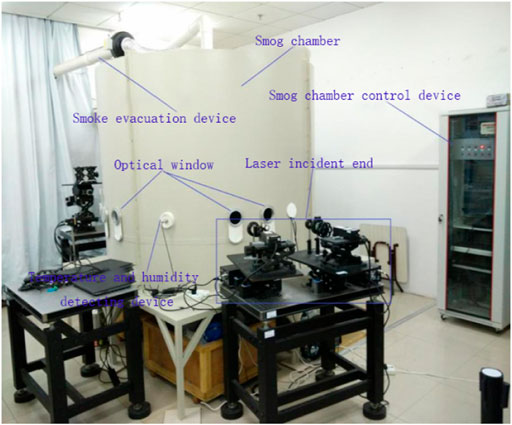
On the parameters of laser transmission, the influences of wavelength, humidity, and polarization of incoming light are explored. Lasers (450, 532, and 671 nm), attenuators, polarizers, wave plates, optical power meters, polarization state meters, and Malvin particle size meters are among the essential experimental instruments.
The primary index parameters of the instrument employed in the test are as follows. The output power of the laser chosen in the test is 50mW, and the laser with wavelengths of 450, 532, and 671 nm may be employed as the emitting laser. In view of the measurement and analysis of a single variable, the experiment is carried out under the same attenuation rate. Attenuate the power of the outgoing laser using an attenuate sheet. The polarizer is used to polarize the laser, and the optional Angle is 0°∼360°. The polarizer chosen in this experiment is 0° and 45° correspondingly. The wave plate is utilized to create the right—handed circularly polarized light required for the experiment. After calibrating the polarizer, add
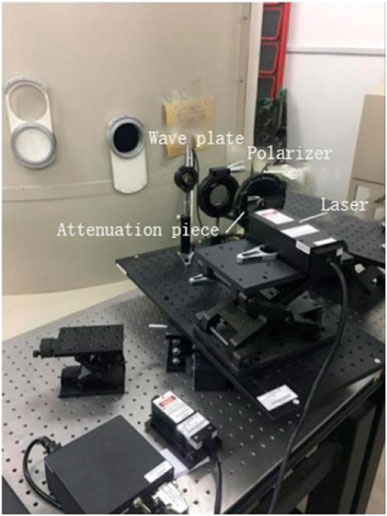
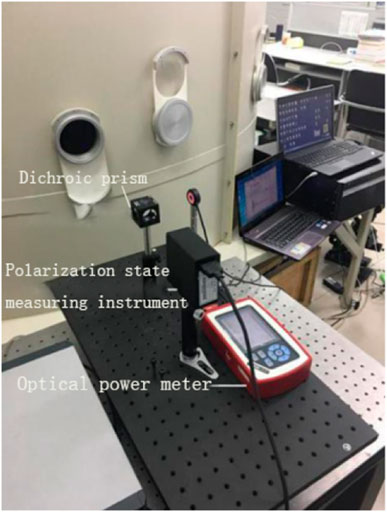
Figure 8 shows the experimental block diagram of polarization transmission, Figure 9 is the actual image of the transmitter, from right to left are the laser, attenuation plate, polarizer, wave plate. Figure 10 represents the physical representation of the receiving end, which are polarization state measuring device and optical power meter correspondingly. Figure 11 is the Physical image of sea fog box.
5.2 The experimental results to discuss
1) The relation between humidity and light transmittance
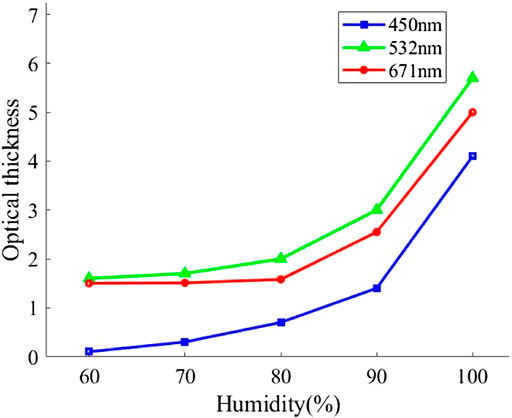
The example size of 450, 532, and 671 nm laser in sea fog environment is fairly enormous, as can be observed in Figure 12. Due to the growth in sea fog concentration and the dispersion of sea fog particles in the air, the light’s optical power diminishes while it is being emitted. The optical thickness grows and the optical transmittance drastically drops as humidity progressively rises. When the humidity is between 60% and 70%, the laser transmittance at three separate wavelengths lowers slowly; when it is between 70% and 100%, the strong transmittance diminishes fast. The explanation of this behavior is that water mist particles in the air become larger as humidity rises, which produces a quick decline in optical transmittance. The optical thickness and optical transmittance are at their maximum and lowest levels, respectively, under 100% humidity. When the humidity is between 60% and 70%, a longer wavelength results in a slower decline in laser intensity transmittance; when the humidity is between 70% and 100%, the optical transmittance declines more quickly, but a longer wavelength results in a slower decline in laser intensity than a laser with a shorter wavelength. It has been established that humidity has a higher influence on shorter wavelength laser optical transmittance than it does on longer wavelength lasers.
Figure 13 illustrates that optical thickness in the 450 nm band rises slowly as humidity increases from 60% to 90%; but, as humidity increases from 90% to 100%, optical thickness increases rapidly. The optical thickness reaches 4 at 100% humidity. When the humidity is between 60% and 90%, the optical thickness at the 532 nm band rises progressively. However, when the humidity is between 90% and 100%, the optical thickness grows swiftly with the increase in humidity, and the growth rate increasingly accelerates. In the 671 nm band, the optical thickness grows gradually with rising humidity levels of 60%–90%, climbs swiftly with increasing humidity levels of 90%–100%, and rises over 5 when humidity reaches 100%. When humidity is between 60% and 90%, it can be seen from three different wavelength laser optical thickness measurements that the longer the wavelength laser grows more slowly, whereas when humidity is between 90% and 100%, it is evident that the greater the humidity in the air, the larger the sea mist particle size is, and the slower the longer the wavelength laser grows. It has been established that the optical thickness of shorter wavelength lasers is more sensitive to humidity fluctuations than the optical thickness of longer wavelength lasers.
2) The humidity and the relationship between degree of polarization
As demonstrated in Figure 14, the degree of polarization DOP lowers with increasing humidity when compared to 532, 450, and 671 nm lasers. The longer the wavelength, the more gradual the decline is, and the degree of polarization likewise grows with the longer wavelength. When compared to linearly polarized light, circularly polarized light has superior polarization maintaining qualities. In three different bands, circularly polarized light has an outgoing polarization degree that is greater than that of linearly polarized light, and its fall is slower than that of linearly polarized light. Therefore, the longer wavelength laser should be employed for imaging while aiming at the environment of sea fog, which is easily impacted by ambient humidity. Longer wavelengths of circularly polarized light have a better polarization-preserving impact in humid settings.

FIGURE 14. The relationship between humidity and degree of polarization at various wavelengths. (A) 450 nm; (B) 532 nm; (C) 671 nm.
6 Conclusion
The intricate marine environment is simplified to a two-layer structure of atmosphere and sea fog in order to obtain the polarization distribution of the whole sky and deliver the polarization distribution of the downward radiation of the fog layer on the solar meridian. The RT3 approach is used to calculate the radiation transmission between two layers. An experiment is done to investigate the parameters of polarization transmission in a sea fog environment. The data show that a scattering angle of 90° between the Sun and the measured height angle might provide the maximum DOP. At the position of the Sun, the bare minimum DOP may be created. As wavelength grows, DOP progressively drops, vision gradually reduces, and wavelength’s influence on polarization properties gradually lessens. Circularly polarized light performs better than linearly polarized light in retaining polarization in a sea fog environment, and the greater the wavelength, the better the image effect. As a consequence, 670 nm light is better appropriate for settings with sea fog. The study discussed above presents theoretical advice for polarization detection in a scenario of multi-layer sea fog.
Data availability statement
The original contributions presented in the study are included in the article/Supplementary Material, further inquiries can be directed to the corresponding author.
Author contributions
QF and YaL simplified the idea, YaL carried out simulations and experiments. QF oversaw the project. The results were discussed and analyzed by all authors.
Funding
This research was funded by the Natural Science Foundation of China (No. 61890963, 61890960, 62127813).
Acknowledgments
Thank the Natural Science Foundation of China for help identifying collaborators for this work.
Conflict of interest
The authors declare that the research was conducted in the absence of any commercial or financial relationships that could be construed as a potential conflict of interest.
Publisher’s note
All claims expressed in this article are solely those of the authors and do not necessarily represent those of their affiliated organizations, or those of the publisher, the editors and the reviewers. Any product that may be evaluated in this article, or claim that may be made by its manufacturer, is not guaranteed or endorsed by the publisher.
References
1. Yinyu L., Huimin C, Fengjie W, Changping L. Research on sea fog characteristic parameters based on mesoscale numerical atmospheric model. Acta Armamentarii (2020) 41(3):507. doi:10.3969/j.issn.1000-1093.2020.03.011
2. Guan L, Li S, Zhai L, Liu S, Liu H, Lin W, et al. Study on skylight polarization patterns over the ocean for polarized light navigation application. Appl Opt (2018) 57(21):6243–51. doi:10.1364/ao.57.006243
3. Chu JK, Tian LB, Cheng HY, Gui X, Zhang P. Simulation of polarization distribution model under wavy water surfaces dominated by skylight. Acta Optica Sinica (2020) 40(20):2001002. doi:10.3788/aos202040.2001002
4. Ren JB, Liu J, Tang J, Wang C-G. Skylight polarization pattern-based approach to the location of the sun and solar meridian. Guangzi Xuebao Acta Photonica Sin (2015) 44:107–12. doi:10.3788/gzxb20154407.0701002
5. Cui Y, Xiao-Long C, Jin-Kui C. Study on polarization pattern of full moonlight in clear sky [J]. Acta Optica Sinica (2014) 34(10):1012002. doi:10.3788/AOS201434.1012002
6. Xufen H, Yang B, Wang X. Skylight polarization patterns based on Mie theory for scattering [J]. CHINESE JOURNAL LASERS (2010) 37(12):3002–6.
7. Chorfi H, Ayadi K, Gader R, Boufendi L. Morphological characterization of particles by the intensity and polarization of the scattered radiation. Optik (2018) 154:251–7. doi:10.1016/j.ijleo.2017.10.056
8. Jin Z, Charlock TP, Rutledge K, Stamnes K, Wang Y. Analytical solution of radiative transfer in the coupled atmosphere-ocean system with a rough surface. Appl Opt (2006) 45(28):7443–55. doi:10.1364/ao.45.007443
9. Qi L, Chu J, Wang J, Guan L. Research and simulation analysis of atmospheric polarization properties under water cloud condition. Acta Optica Sinica (2014) 34:30301004. doi:10.3788/aos201434.0301004
10. Li Q, Hu Y, Hao Q, Cao J, Cheng Y, Dong L, et al. Skylight polarization patterns under urban obscurations and a navigation method adapted to urban environments. Opt Express (2021) 29(25):42090–105. doi:10.1364/oe.443321
11. Juntong Z, Shicheng B, Su Z. The research of long-optical-path visible laser polarization characteristics in smoke environment[J]. Front Phys (2022) 277. doi:10.3389/fphy.2022.87495
14. Al N, Maher C, Sizun H, de Fornel F. Fog attenuation prediction for optical and infrared waves. Opt Eng (2004) 43(2):319–29. doi:10.1117/1.1637611
15. Cui Y, Zhao JY, Guan L, Chu J, Zhang X, Liu H. Simulation and measurement of skylight polarization distributionin in yellow sea. Acta Optica Sinica (2017) 37(10):1001004. doi:10.3788/aos201737.1001004
16. van der Laan JD, Kemme SA, Scrymgeour DA. Superior signal persistence of circularly polarized light in polydisperse, real-world fog environments. Appl Opt (2018) 5719(J):5464–73. doi:10.1364/ao.57.005464
17. Zhang S, Zhan JT, Fu Q. Simulation research on sky polarization characteristics under complicated marine environment[J]. Acta Optica Sinica (2020) 40(22):2201001.
Keywords: atmosphere and sea fog multi-layer environment, skylight polarization pattern, adding-doubling method, downwelling radiance, degree of polarization
Citation: Fu Q, Liu Y, Liu N, Si L, Zhang S, Zhan J and Li Y (2022) Sky polarization pattern under multi-layer environment of atmosphere and sea fog. Front. Phys. 10:1036560. doi: 10.3389/fphy.2022.1036560
Received: 04 September 2022; Accepted: 22 September 2022;
Published: 06 October 2022.
Edited by:
Jingsong Li, Anhui University, ChinaReviewed by:
Yao Hu, Beijing Institute of Technology, ChinaSuwen Li, Huaibei Normal University, China
Jie Li, Xi’an Jiaotong University, China
Copyright © 2022 Fu, Liu, Liu, Si, Zhang, Zhan and Li. This is an open-access article distributed under the terms of the Creative Commons Attribution License (CC BY). The use, distribution or reproduction in other forums is permitted, provided the original author(s) and the copyright owner(s) are credited and that the original publication in this journal is cited, in accordance with accepted academic practice. No use, distribution or reproduction is permitted which does not comply with these terms.
*Correspondence: Qiang Fu, Y3VzdF9mdXFpYW5nQDE2My5jb20=
 Qiang Fu
 Yang Liu1,2
 Juntong Zhan