 Kazuya Hayata
- Department of Economics, Sapporo Gakuin University, Ebetsu, Japan
Perturbation analysis of the rank-size rule is made for municipalities that are squeezed in a prefecture. Specifically, attention is focused on Japanese prefectures, for which effects of the archipelagoes, municipal consolidations, and coastal inundations due to the future sea-level rise are examined. In each prefecture, typically tens of municipalities are closely packed with a unique configuration that has been arranged according to a self-organized process. With a mind to sustainable development goals, analysis is made from three points of view. First, comparisons between the results of the mainland and those of the entire prefecture with territorial islands suggest that historical interactions over a long period become a key factor to enhance the statistical rule. Next, to cope with rapidly increasing rural depopulation, simulations are made on the basis of three consolidatory schemes. Of prefectures with extremely depopulated areas, particular emphasis is laid on Fukushima Prefecture, the east coast of which was damaged by the nuclear disaster on 11 March 2011. Lastly, analysis is made implying perturbations due to global warming. Among three parameters that characterize the rank-size relation, stabilities are confirmed for the scaling exponent.
1 Introduction
Since the beginning of the present century, sustainability has become one of the most cited keywords. Not to mention international organizations such as the United Nation, World Health Organization, and World Meteorological Organization, all the governments of the developed countries are in a quandary over how to handle the difficult issue. While the countries are confronting such problems as rapidly increasing aging, aggravating rural depopulation, and dealing with expanding refugees, the developing countries are of more serious concern with desperate poverties, drought damages, and fear of the future sea-level rise, most of which seem to arise from the climate change occurring now in the global scale. This perspective allows one to explore motivations for integrating physical and social sciences and eventually for establishing an interdisciplinary area on the methodological basis of conventional statistics, probability theory, and theory of complex networks. To this end, one should pay attention to the success in establishing the physics of cities [1–10], which exhibit analogy in many viewpoints with the condensed matter system. As the next step we are now in the best position to extend the new discipline to human communities consisting of not only cities but also towns and villages as an organic whole.
In this paper, with a mind to the sustainable development goals [11–14], perturbation analysis of the rank-size rule is made for municipalities that are squeezed in a prefecture. Specifically, attention is focused on Japanese prefectures, for which effects of the archipelagoes, municipal consolidations, and coastal inundations due to the future sea-level rise are examined. In each prefecture, typically tens of municipalities are closely packed with a unique configuration that has been arranged according to a self-organized process. Analysis is made from three points of view.
First, comparisons between the results of the mainland and those of the entire prefecture with territorial islands allow one to discuss whether social interactions over a long period become a key factor to preserve the statistical rule. The topic may be of potential significance in the context of territorial issues between neighboring countries. As is well known, the Japanese Islands belong to the circum-Pacific orogenic belt, which had yielded such archipelagoes as the Northern Territories (in Hokkaido), the Izu and Bonin Islands (in Tokyo Metropolis), and the Southwest Islands (in Kagoshima to Okinawa Prefecture) being the long string of islands stretching between Kyushu and Taiwan. It should be noted that, in contrast to spontaneous interactions between the mainland of Hokkaido and the Northern Territories as well as the ones between the mainland of Kagoshima Prefecture and the Southwest Islands, no evidence, to our knowledge, is seen of deep interactions between the Tokyo Metropolis mainland and its territorial islands. In other words, the latter seem to be assigned into the former solely for an administrative convenience.
Next, to deal with rapidly increasing rural depopulation [15–17], simulations are made on the basis of three consolidatory schemes. As in countries of the European Union, Japan is suffering from the rapidly increasing rural depopulation, major part of which arises from urbanization, sporadic disaster, as well as chronic aging. To achieve Goal 3: Good Health and Wellbeing, Goal 10: Reduced Inequalities, and Goal 11: Sustainable Cities and Communities, consolidations between neighboring municipalities seem to be a realistic compromise. The first scheme could be regarded as a gravitation method in that a sparsely populated municipality is annexed to the neighboring one with highest density of population. In contrast to this, in the other two schemes, populations of municipalities are employed instead of their population densities. In particular, the third one is presented to mitigate the ethnic minority issue in the northernmost prefecture in the country [18–20]. It should be noted here that as in other Asian countries such as India, Burma, Thailand, Lao, Taiwan, and China, Japan is far from unrelated to ethnic minority issues. Of the prefectures with extremely depopulated areas, particular emphasis is laid on Fukushima Prefecture that was damaged by the nuclear disaster on 11 March 2011 [21–26]. To achieve Goals 3 and 11 simultaneously, in the near future, administration must make a move to mitigate the damage by means of municipal consolidations.
Lastly, analysis is made for coastwise prefectures, implying perturbations due to the global warming [27–31]. Not to particularly mention islets in the Pacific Ocean, representative megacities with coasts are confronting a sign of the inundation crisis due to the global-scale change of earthly climate. Currently, no one can consider the sustainable development matter without focusing one’s attention on the future aqua-crisis [13, 14]. Along with Indonesia, Brunei Darussalam, Philippines, and Taiwan, Japan is the country located off the easternmost extreme of the Eurasian Continent and is surrounded by the four seas, specifically the Pacific Ocean, East China Sea, Japan Sea, and Sea of Okhotsk. Indeed, of the 47 prefectures, 39 ones front at least one of the seas. In our analysis, for three parameters that characterize the rank-size relation, stabilities are examined with increasing the inundate ratio.
In summary, of the 17 Sustainable Development Goals, topics of this paper have relevance to Goals 3: Good Health and Wellbeing, 10: Reduced Inequalities, 11: Sustainable Cities and Communities, as well as Goal 13: Climate Action.
2 Method
The areas of municipalities (cities, towns, and villages) yi (i = 1, 2, … , n; n being the number of municipalities in a prefecture) will be analyzed statistically. The entire analysis consists of two steps. First, as regressions on the areas versus the ranks, two modellings that exhibit a short and long tail profile, respectively, are considered:
where log abbreviates the common logarithm; x represents the rank variable in descending order. Namely, x = 1 for y = y(1), x = 2 for y = y(2), ⋯, and x = n for y = y(n), where y(i) indicates the ordered statistics of yi as y(1) > y(2) > ⋯> y(n). The parameters a and b are positive constants to be determined with the least square fit. The accuracy of the respective model can be examined by the degree of fit, |r|, namely with the Pearson’s coefficient (0 < |r| < 1), and with the Durbin-Watson ratio, d (0 < d < 2 for positive serial correlations, whereas 2 < d < 4 for negative counterparts) [32]. Next, provided that the best logarithmic fit to the long tail function is established, Eq. 2 will subsequently be modified with introducing a positive parameter q [8, 33, 34]
Note that with the additional parameter the optimal parameters for (a, b) are renewed. Although mathematically, extending a domain of q to the complex number might be interesting, we confine the domain within the real number. To detail the physical meaning of Eq. 3, the first derivative d y/d x that is normalized by y/x is given
showing that in the vicinity of the high rank region the kurtosis, |(d y/d x)/(y/x)|, increases with decreasing q. As q→0, it may be convenient to rewrite Eq. 3 in the form of the Box-Cox transformation [35].
where e is the Napier’s constant. In the derivation of Eq. 5 the formula
has been implied. Note that in the limit of vanishing q, Eq. 5 coincides with the curve of the Zipf’s law [36–42].
In the context of our tournament game model [8, 33], for a team (assuming team #i) that has survived till the final, the cumulative score, Si, in, e.g., 64 teams can be written as
while for a team (assuming team #k) that has lost in the first round, the counterpart, Sk, can be given as
Here sij represents the score for team i (i = 1–64) at round j (j = 1–6). In comparison of the two teams in the scores it is apparent that for 0 < q < 1 the team (team #i) that has survived till the final gains far greater advantage than the one (team #k) that has lost in the first round [8], being indicative of the typical rich-get-richer effect or the Matthew effect. For this reason, the exponent may be useful for roughly estimating the strength of territorial competition due to squeezed elements in a constrained domain. Namely, 0 < q < 1 for substantial squeezing, q ∼ 1 for moderate squeezing, and q > 1 for little squeezing. In the Durbin-Watson d statistics [32], dU represents the upper critical value of the ratio (α = 0.01, i.e., level 1% test being implied). For dU < d ≤ 2, a null hypothesis H: “There is no correlation between the neighboring residual data.” is not rejected. For a negative counterpart, i.e., 2 < d ≤ 4, d must be replaced with 4—d. In contrast to non-ranking as well as rank-rank data (such as, e.g., Spearman’s and Kendall’s approaches), for the rank-size analysis, in most cases the positive correlations are included between the neighboring data.
3 Results
3.1 Examining perturbations by archipelagoes
We consider the entire prefecture in Japan, which is divided into 47 prefectures [43]. As is well known, belonging to the circum-Pacific orogenic belt had yielded a number of islets and archipelagoes around the Japan Islands. In Figure 1, a complete map of A) Japan is given along with the ones of B) Hokkaido (n = 175), C) the Metropolis of Tokyo (n = 53), and D) Kagoshima Prefecture (n = 25). Here n indicates the number of municipalities squeezing in the mainland of a prefecture, which consist of cities, towns, and villages. The three prefectures are to be cited in the rank-size analysis, and are marked with the yellow ink in Figure 1A. The colored dashed lines in Figures 1B–D indicate the boundaries among municipalities in each prefecture.
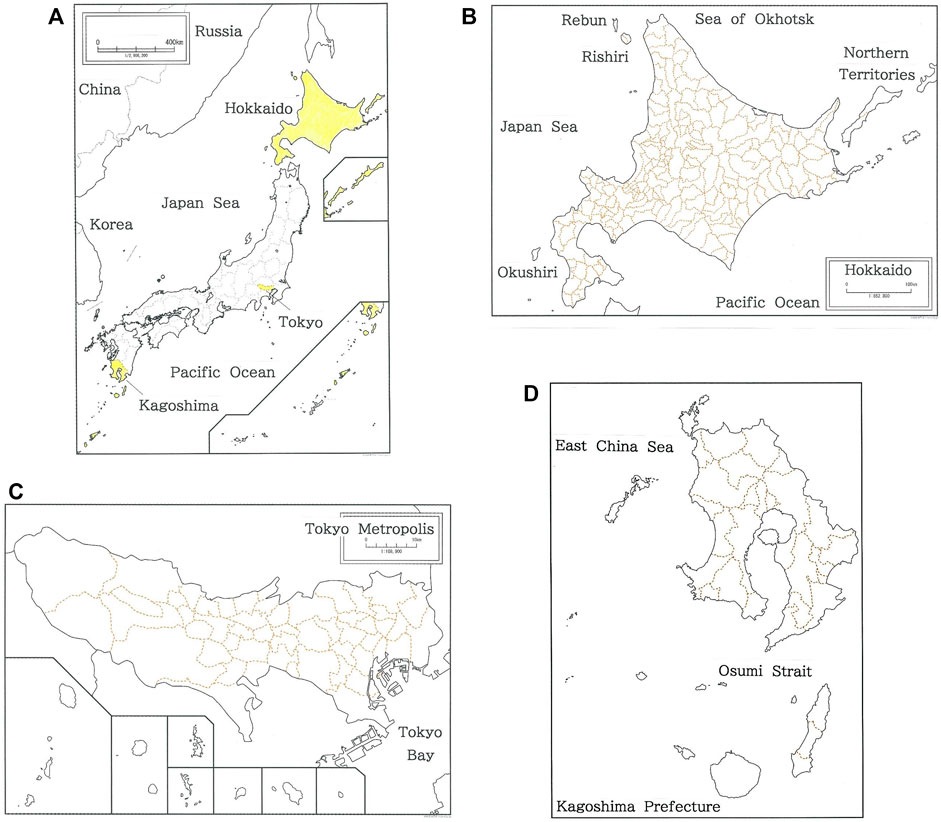
FIGURE 1. A complete map of (A) Japan (B) Hokkaido, (C) the Metropolis of Tokyo, and (D) Kagoshima Prefecture. The three prefectures are marked with the yellow ink in (A). The colored dashed lines in (B–D) indicate the boundaries among municipalities in the prefecture.
Figure 2A plots the dependence of the areas (km2) of municipalities in the mainland of Hokkaido on the logarithmic rank. The brown declining line indicates the optimized fit to Eq. 3 (|r| = 0.9938 with d = 0.477 for q = 1.39 and n = 175). Oscillations across the regression line are seen in the region of high ranking. Hokkaido is the northernmost prefecture in Japan, which consists of 175 and 10 municipalities, respectively, in the mainland and on its territorial islands. Of the ten municipalities on the islands, there are six ones in the Northern Territories [44, 45]. To evaluate effects due to the municipalities on the territorial islands, in Figure 2B the dependence is shown of the areas (km2) of municipalities in the entire Hokkaido. The brown line indicates the optimized fit (|r| = 0.9942 with d = 0.511 for q = 1.39 and n = 185). Data of municipalities on the territorial islands are highlighted with pink dots. It is worth noting that the oscillations in the high rank region are slightly reduced and the inclusion of islands allows one to improve the fitting to Eq. 3 (notice |r|: 0.9938 →0.9942, being 0.04% increase; d: 0.477→ 0.511).
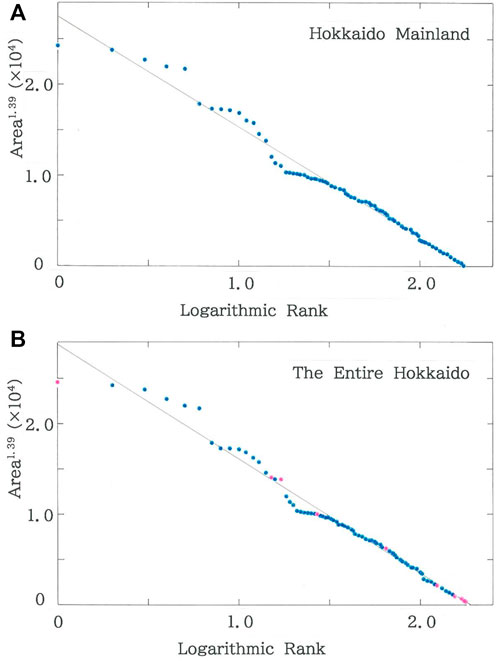
FIGURE 2. (A) Dependence of the areas (km2) of municipalities in the mainland of Hokkaido on the logarithmic rank. The brown declining line indicates the optimized fit (|r| = 0.9938 with d = 0.477 for q = 1.39 and n = 175; a = 2.75×10⁴, b = 1.22×10⁴). (B) Dependence of the areas (km2) of municipalities in the entire Hokkaido on the logarithmic rank. The brown line indicates the optimized fit (|r| = 0.9942 with d = 0.511 for q = 1.39 and n = 185; a = 2.88×10⁴, b = 1.26×10⁴). Data of municipalities on the territorial islands are highlighted with pink dots.
Figure 3A shows the dependence of the areas (km2) of municipalities in the mainland of the Metropolis of Tokyo on the logarithmic rank. The brown declining line indicates the optimized fit to Eq. 3 (|r| = 0.9961 with d = 1.861 for q = 0.21 and n = 53) [8]. There are nine islands belonging to the prefecture. Figure 3B plots the dependence of the areas (km2) of municipalities in the entire Metropolis of Tokyo. The brown line indicates the optimized fit (|r| = 0.9936 with d = 1.267 for q = 0.44 and n = 62). Data of municipalities on the territorial islands are highlighted with pink dots. In sharp contrast to Hokkaido, improvement is seen neither for the degree of fitting (|r|: 0.9961→0.9936, being 0.25% decrease) nor for the Durbin-Watson ratio (d: 1.861→1.267).
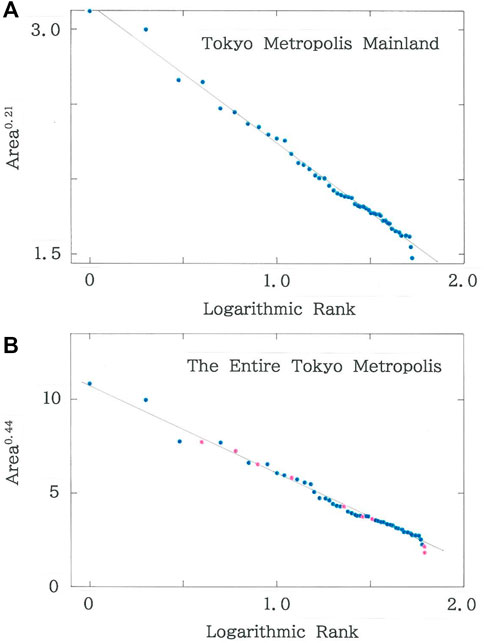
FIGURE 3. (A) Dependence of the areas (km2) of municipalities in the mainland of the Metropolis of Tokyo on the logarithmic rank. The brown declining line indicates the optimized fit (|r| = 0.9961 with d = 1.861 for q = 0.21 and n = 53; a = 3.16, b = 0.919) [8]. (B) Dependence of the areas (km2) of municipalities in the entire Metropolis of Tokyo on the logarithmic rank. The brown line indicates the optimized fit (|r| = 0.9936 with d = 1.267 for q = 0.44 and n = 62; a = 10.8, b = 4.67). Data of municipalities on the territorial islands are highlighted with pink dots.
Figure 4A shows the dependence of the areas (km2) of municipalities in the mainland of Kagoshima Prefecture on the logarithmic rank. The declining line indicates the optimized fit to Eq. 3 (|r| = 0.9951 with d = 1.277 for q = 1.35 and n = 25). The prefecture possesses 18 municipalities scattered all over the territorial islands. Figure 4B plots dependence of the areas (km2) of municipalities in the entire Kagoshima Prefecture. The brown line indicates the optimized fit (|r| = 0.9955 with d = 1.055 for q = 1.16 and n = 43). Data of municipalities on the territorial islands are highlighted with pink dots. It is found that, as has been confirmed for Hokkaido, adding the municipalities on the islands allows one to enhance the fit to Eq. 3 (i.e., |r|: 0.9951→0.9955, being 0.04% increase). This prefecture shares long history with Okinawa Prefecture, the southernmost prefecture in Japan. The dependence of the areas (km2) of municipalities in the entire Kagoshima and Okinawa Prefecture is shown in Figure 4C. The brown line indicates the optimized fit (|r| = 0.9955 with d = 0.557 for q = 0.88 and n = 84). Data of municipalities in Okinawa Prefecture are highlighted with pink dots. Because of the addition of municipalities of the latter prefecture, the tail in the ranking gets substantially longer than the ones in Figures 4A,B (i.e., q: 1.35→1.16→0.88).
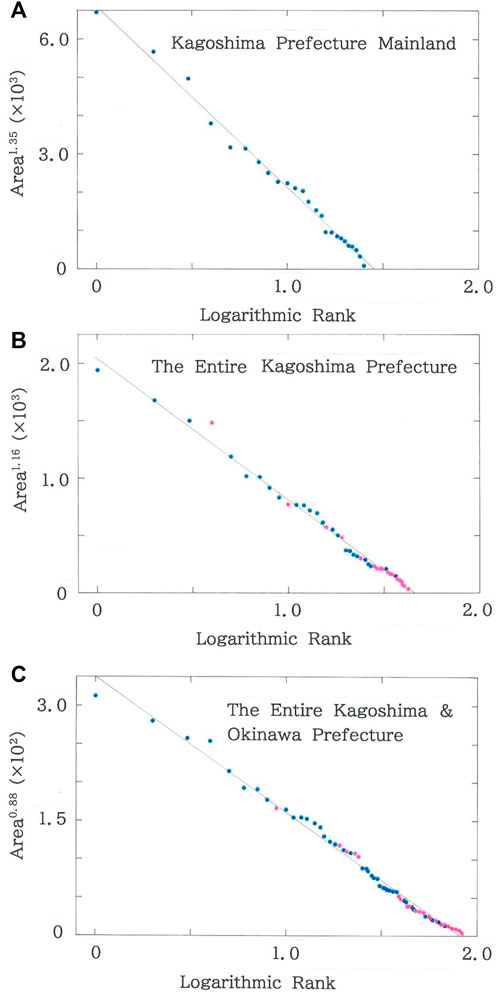
FIGURE 4. (A) Dependence of the areas (km2) of municipalities in the mainland of Kagoshima Prefecture on the logarithmic rank. The brown declining line indicates the optimized fit (|r| = 0.9951 with d = 1.277 for q = 1.35 and n = 25; a = 6.86×10³, b = 4.72×10³). (B) Dependence of the areas (km2) of municipalities in the entire Kagoshima Prefecture on the logarithmic rank. The brown line indicates the optimized fit (|r| = 0.9955 with d = 1.055 for q = 1.16 and n = 43; a = 2.05×10³, b = 1.24×10³). Data of municipalities on the territorial islands are highlighted with pink dots. (C) Dependence of the areas (km2) of municipalities in the entire Kagoshima and Okinawa Prefecture on the logarithmic rank. The brown line indicates the optimized fit (|r| = 0.9955 with d = 0.557 for q = 0.88 and n = 84; a = 3.37×10², b = 1.77×10²). Data of municipalities in Okinawa Prefecture are highlighted with pink dots.
3.2 Simulating consolidations (goals 3, 10, and 11)
As in countries of the European Union, Japan is suffering from the rapidly increasing rural depopulation, major part of which arises from urbanization as well as chronic aging. To achieve the sustainable development goals, radical countermeasures are needed [15–17]. In this subsection, computed results are given on the application of a consolidatory scheme between neighboring municipalities in a prefecture. In Japan, there are 18 prefectures that include municipalities exhibiting the extremely low density of population, the value of which is lower than 10 per km2. The consolidatory scheme (for later convenience, termed Scheme I) could be regarded as a gravitation method. Namely, a sparsely populated municipality (discriminated with suffix f) is annexed to the neighboring one (discriminated with suffix t) with highest density of population. The density of the newborn municipality, ρt’, is renewed with
where ρt and ρf are the original population densities; At and Af are the areas of prefectures.
Figure 5A shows the distributional map of 18 prefectures that include municipalities with population densities lower than 10 per km2. In Figure 5B, scattergram is plotted of scaling exponents after the municipal consolidations according to Scheme I versus those before consolidation. The majority of dots is seen below the diagonal line, indicating that the consolidations promote the so-called rich-get-richer effect [46]. The crosses that are superimposed on the dots are marked to highlight the three prefectures (specifically, Hokkaido, Fukushima, and Nagano Prefectures) in Figure 5C, which shows the dependence of scaling exponent, q, on the consolidatory stage. Here one consolidatory event per stage is implied. With this assumption, 48 stages are needed for Hokkaido (ρ = 66.1 per km2) to complete the entire consolidation, which results finally in three gigantic hubs. In contrast to this, for Fukushima (ρ = 1.31×10² per km2) and Nagano Prefecture (ρ = 1.50×10² per km2), respectively, only 9 and 7 stages are needed.
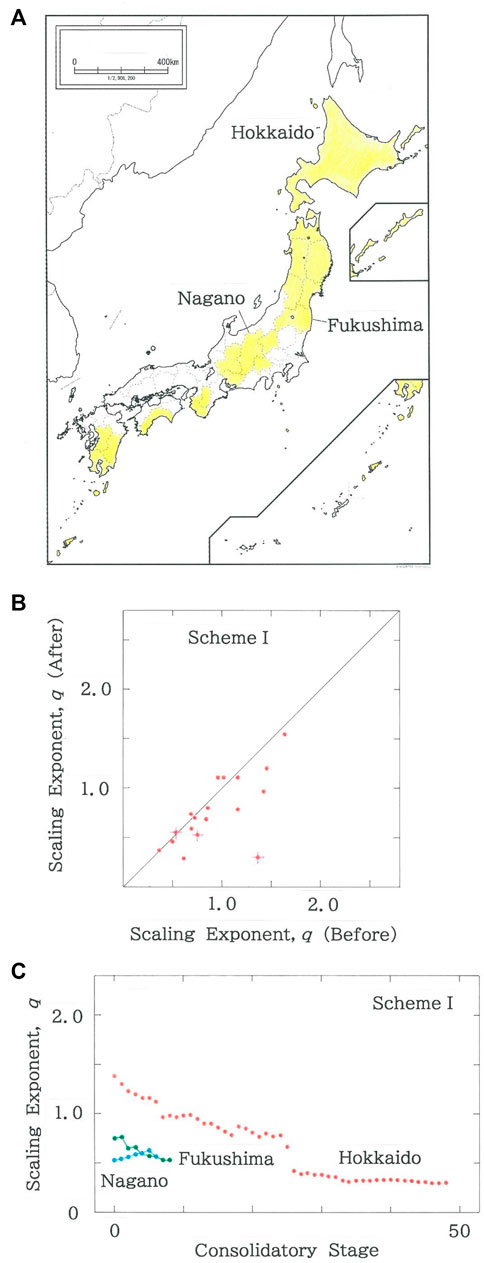
FIGURE 5. (A) The distributional map of 18 prefectures that include municipalities with population densities lower than 10 per km2. (B) Scattergram of scaling exponents after the municipal consolidations according to Scheme I versus those before consolidation (R = 0.6889 with d = 1.982). The crosses that are superimposed on the dots highlight the three prefectures in (C). (C) Dependence of scaling exponent, q, on the consolidatory stage. Three prefectures (Hokkaido, Fukushima, and Nagano Prefectures) are selected from (B), which are discriminated, respectively, with the red, green, and blue ink.
Of the three prefectures, since the nuclear disaster on 11 March 2011 the situation of Fukushima Prefecture has been most dire [21–26]. To achieve Goals 3 and 11 simultaneously, in the near future, administration must make a move to mitigate the damage by means of municipal consolidations. On the map of Figure 6A, the Fukushima Daiichi nuclear power plant (marked with pink on the east coast) is located across the boundary between Futaba (north side) and Okuma (south side) Town. To explain how to make consolidations between neighboring municipalities, first the eight municipalities with extremely low population densities (specifically, lower than 10 per km2) are specified:
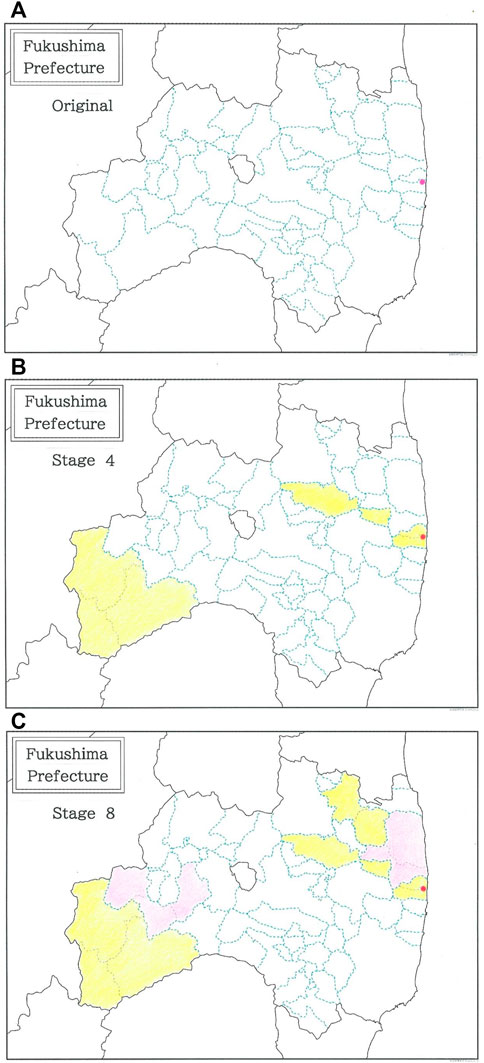
FIGURE 6. A complete map of Fukushima Prefecture. The pink dot on the east coast indicates the site of the Fukushima Daiichi nuclear power plant. (A) Before consolidation. (B) Under consolidations (Stage 4). (C) After consolidations (Stage 8).
Futaba Town (0.00), Hinoemata Village (1.29),
Katsurao Village (4.98), Tadami Town (5.41),
Idate Village (5.73), Showa Village (5.95),
Kaneyama Town (6.34), Namie Town (8.62),
where the numeric in the parentheses indicates the population density per km2. Note the null density of Futaba Town, on the coast of which there is the Fukushima Daiichi nuclear power plant. In our simulations using Scheme I, of the eight municipalities above, priorities are assigned to lower densities. With this rule the entire consolidation will be completed according to the procedure as follows (area being given by the numeric in km2):
Stage 1: 51.42 (Futaba Town) +78.71 (Okuma Town)
= 130.13 (New Okuma Town).
Stage 2: 390.46 (Hinoemata Village) + 886.47 (Minami-Aizu Town)
= 1,276.93 (New Minami-Aizu Town).
Stage 3: 84.37 (Katsurao Village) + 344.42 (Nihonmatsu City)
= 428.79 (New Nihonmatsu City).
Stage 4: 747.56 (Tadami Town) + 1,276.93 (New Minami-Aizu Town)
= 2024.49 (Novel Minami-Aizu Town).
Stage 5: 230.13 (Idate Village) + 265.12 (Date City)
= 495.25 (New Date City).
Stage 6: 209.46 (Showa Village) + 276.33 (Aizu-Misato Town)
= 485.79 (New Aizu-Misato Town).
Stage 7: 293.92 (Kaneyama Town) + 485.79 (New Aizu-Misato Town)
= 779.71 (Novel Aizu-Misato Town).
Stage 8: 223.14 (Namie Town) + 398.58 (Minami-Soma City)
= 621.72 (New Minami-Soma City).
Figure 6 shows a complete map of Fukushima Prefecture A) before consolidation, B) under consolidations (Stage 4), and C) after consolidations (Stage 8). The pink dot on the east coast is marked to indicate the site of the Fukushima Daiichi nuclear power plant. In Figure 7A the dependence of the areas (km2) of municipalities in this prefecture without consolidation is plotted as a function of the logarithmic rank. The blue declining line indicates the optimized fit to Eq. 3 (|r| = 0.9938 with d = 0.851 for q = 0.75 and n = 59). Subsequently the dependence of the areas (km2) of municipalities in the same prefecture under intermediate consolidations (Stage 4) is shown in Figure 7B. The blue line indicates the optimized fit (|r| = 0.9783 with d = 0.532 for q = 0.59 and n = 55). Data of consolidated municipalities are highlighted with orange dots. The sigmoid seen in the high rank region is responsible for substantially reducing the degree of fit, |r|, as well as the Durbin-Watson ratio d. Finally, for the complete consolidations (Stage 8) the dependence of the areas (km2) of municipalities in the prefecture is shown in Figure 7C. The line indicates the optimized fit to Eq. 3 (|r| = 0.9943 with d = 1.166 for q = 0.53 and n = 51). Data of consolidated municipalities are highlighted with orange and pink dots. It is found that the fit to Eq. 3 recovers on the original one.

FIGURE 7. (A) Dependence of the areas (km2) of municipalities in Fukushima Prefecture before consolidation on the logarithmic rank. The blue declining line indicates the optimized fit (|r| = 0.9938 with d = 0.851 for q = 0.75 and n = 59; a = 1.99×10², b = 1.06×10²). (B) Dependence of the areas (km2) of municipalities in Fukushima Prefecture under consolidations (Stage 4) on the logarithmic rank. The blue line indicates the optimized fit (|r| = 0.9783 with d = 0.532 for q = 0.59 and n = 55; a = 73.7, b = 38.2). Data of consolidated municipalities are highlighted with orange dots. (C) Dependence of the areas (km2) of municipalities in Fukushima Prefecture after consolidations (Stage 8) on the logarithmic rank. The blue line indicates the optimized fit (|r| = 0.9943 with d = 1.166 for q = 0.53 and n = 51; a = 51.7, b = 26.9). Data of consolidated municipalities are highlighted with orange and pink dots.
3.3 Examining effects due to sea-level rise (goal 13)
Not to particularly mention islets in the Pacific Ocean, a number of megacities with coasts are confronting a sign of the inundation crisis due to the global-scale change of earthly climate. Currently, no one can discuss the sustainable development issue without noticing the future aqua-crisis [13, 14]. Indeed, of the 17 Global Goals the issue has relevance close to not only Goals 3, 10, and 11 but Goal 13: Climate Action. Along with Indonesia, Brunei Darussalam, Philippines, and Taiwan, Japan is the country located off the easternmost extreme of the Eurasian Continent and is surrounded by the four seas, specifically the Pacific Ocean, East China Sea, Japan Sea, and Sea of Okhotsk. Indeed, of the 47 prefectures, 39 ones front at least one of the seas.
In Figures 8–10, computed results of perturbation analysis are given, where uniform inundations on the 39 coastal prefectures are assumed. For 100δ% inundation (0 < δ < 1) the model can be explained by a flow chart: For i = 1 to n, if the municipality i with area yi has a coastline, then yi = (1 – δ)yi, next i. Figure 8 plots the scattergram of scaling exponents after inundation due to the sea-level rise versus those before inundation: A) 10% inundation (R = 0.9659 with d = 1.073 for δ = 0.1); B) 20% inundation (R = 0.9148 with d = 1.405 for δ = 0.2). The scaling exponent, q, is found to preserve stabilities against the coastwise perturbations. Next, in Figure 9, scattergram is shown of degrees of fit after inundation due to the sea-level rise versus those before inundation: A) 10% inundation (R = 0.9667 with d = 1.432 for δ = 0.1); B) 20% inundation (R = 0.8378 with d = 1.491 for δ = 0.2). Although the stability comparable to the scaling exponent is seen for 10% inundation, for 20% inundation, considerable reduction is inevitable. Finally, Figure 10 shows the scattergram of Durbin-Watson ratios after inundation due to the sea-level rise versus those before inundation: A) 10% inundation (R = 0.8189 with d = 1.545 for δ = 0.1); B) 20% inundation (R = 0.6320 with d = 1.598 for δ = 0.2). In contrast to the two parameters above, irrespective of the inundated rate, substantial reduction is seen for the Durbin-Watson ratio.
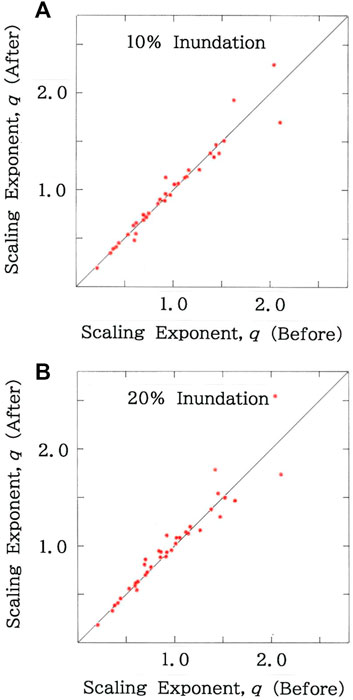
FIGURE 8. Scattergram of scaling exponents after inundation due to the sea level rise versus those before inundation. (A) 10% inundation (R = 0.9659 with d = 1.073). (B) 20% inundation (R = 0.9148 with d = 1.405).
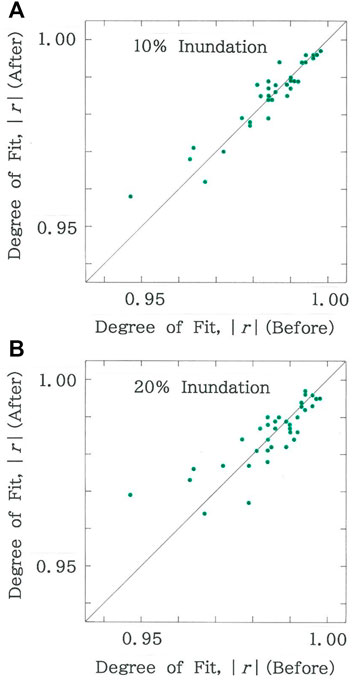
FIGURE 9. Scattergram of degrees of fit after inundation due to the sea level rise versus those before inundation. (A) 10% inundation (R = 0.9667 with d = 1.432). (B) 20% inundation (R = 0.8378 with d = 1.491).

FIGURE 10. Scattergram of Durbin-Watson ratios after inundation due to the sea level rise versus those before inundation. (A) 10% inundation (R = 0.8189 with d = 1.545). (B) 20% inundation (R = 0.6320 with d = 1.598).
For two prefectures along the Tokyo Bayside Area, the dependence of optimal parameters on the inundated rate δ is plotted in Figure 11, on the supposition that effects due to global warming will get more and more inevitable in the future. In Chiba (ρ = 1.22×10³ per km2) and Kanagawa Prefecture (ρ = 3.82×10³ per km2), respectively, there are 27 and 15 municipalities that are located along the coast. Here, the uniform inundations on the coastal municipalities are assumed. Again, both the scaling exponent, q, and the degree of fit, |r|, preserve stabilities against the large-scale perturbation, whereas the results of the Durbin-Watson ratio, d, exhibit a sharp contrast. Especially for Kanagawa Prefecture a phenomenon similar to a phase transition occurs just in front of the 20% inundation (δ = 0.2), and the new phase is maintained to the 60% inundation (δ = 0.6).
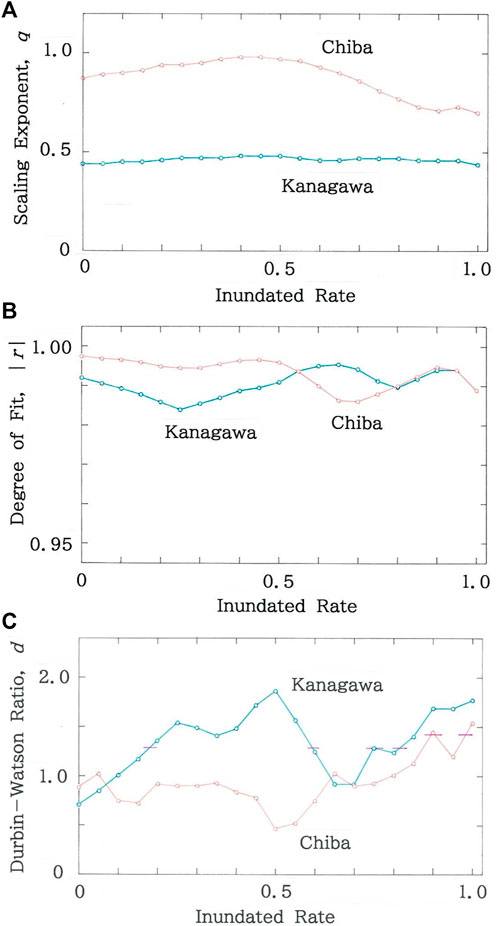
FIGURE 11. Dependence of optimal parameters on the inundated rate on the supposition that effects due to global warming will get more and more inevitable in the future. (A) Scaling exponent. (B) Degree of fit. (C) Durbin-Watson ratio. The horizontal bar shows d = dU.
4 Discussion
4.1 Clustering neighboring prefectures
The results given in Figures 2–4 have shown that social interactions between the mainland and its archipelago, through which mutual history has been shared tightly, seem to be responsible for preserving the rank-size rule for the entire prefecture. Below, to discuss the topic in more detail, we consider the clusters of neighboring prefectures that interact across their boundary. The interaction may be responsible for intensifying the rank-size rule. Figure 12 shows a complete map of the A) Kyushu Region, B) Shikoku Region, C) Kinki Region, and D) Greater Tokyo Area (GTA). These are representative clusters in Japan, all of which consist of several neighboring prefectures. The colored dashed lines in (A) - (D) indicate the boundaries among municipalities in the region.
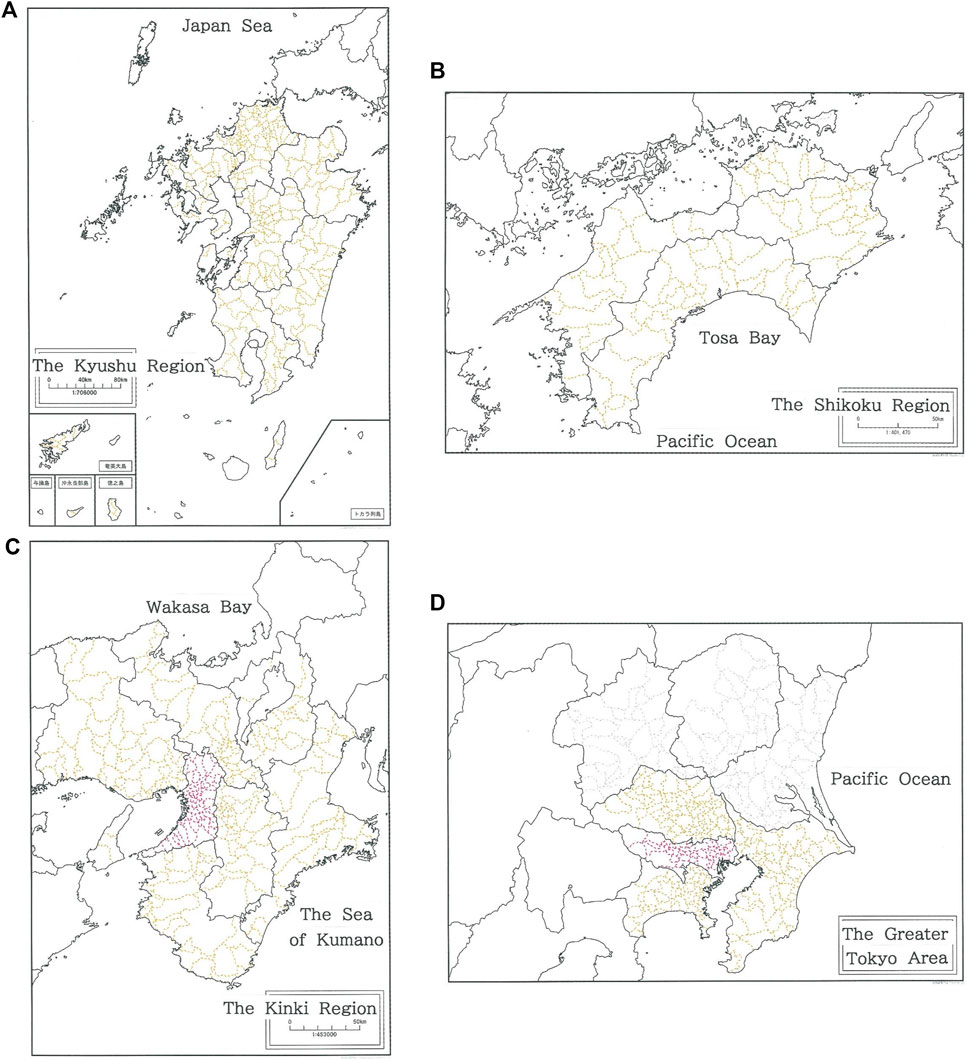
FIGURE 12. A complete map of the (A) Kyushu Region (B) Shikoku Region, (C) Kinki Region, and (D) Greater Tokyo Area (GTA). The colored dashed lines in (A–D) indicate the boundaries among municipalities in the region.
Figure 13A plots the dependence of the areas (km2) of municipalities in the Kyushu Region on the logarithmic rank. The brown declining line indicates the optimized fit to Eq. 3 (|r| = 0.9947 with d = 0.321 for q = 1.05 and n = 233). As has been seen in Figure 2, there are oscillations in the high rank region. Subsequently, Figure 13B shows dependence of the areas (km2) on the rank for municipalities in the Shikoku Region. The brown line indicates the optimized fit (|r| = 0.9951 with d = 0.614 for q = 1.14 and n = 95). It seems that the fit to Eq. 3 is better than the one for the Kyushu Region. Indeed, there is no ripple along the regression line. The dependence of the areas (km2) of municipalities in the Kinki Region is shown in Figure 13C. The declining line indicates the optimized fit to Eq. 3 (|r| = 0.9963 with d = 0.172 for q = 0.80 and n = 227). While the degree of fit, |r|, increases, the Durbin-Watson ratio, d, decreases substantially. Again, oscillations emerge in the high rank region. Next, the dependence of the areas (km2) of municipalities in the GTA is plotted in Figure 13D. The line indicates the optimized fit to Eq. 3 (|r| = 0.9988 with d = 0.492 for q = 0.57 and n = 203). It should be particularly mentioned here that the value of |r| gets astonishingly high. This can be explained by the fact that the present cluster, which consists of Tokyo Metropolis surrounded by Saitama, Chiba, and Kanagawa Prefectures, exhibits the exceptionally high population density. Finally, Figure 13E shows the dependence of the areas (km2) of municipalities in the Tokyo Bayside Area (TBA). The line indicates the optimized fit (|r| = 0.9981 with d = 1.092 for q = 0.72 and n = 48). Note that although the degree of fit decreases slightly, the value remains much higher than those of the Kyushu, Shikoku, and Kinki Regions.
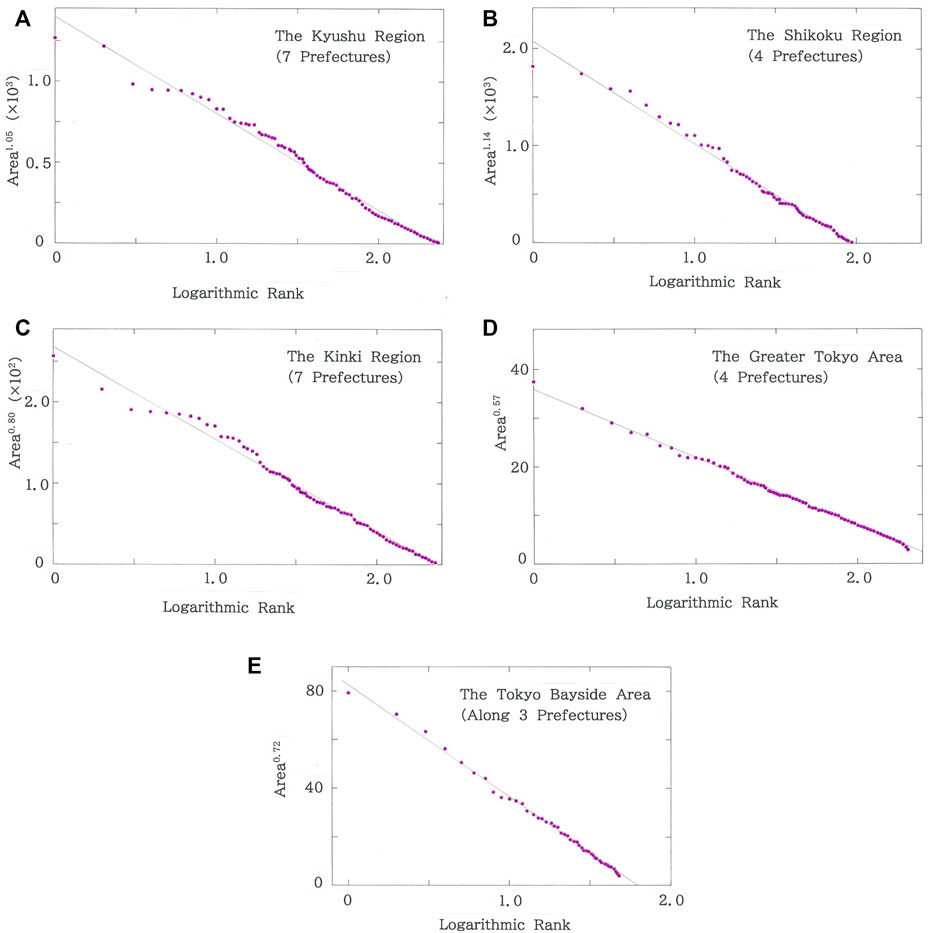
FIGURE 13. (A) Dependence of the areas (km2) of municipalities in the Kyushu Region on the logarithmic rank. The brown declining line indicates the optimized fit (|r| = 0.9947 with d = 0.321 for q = 1.05 and n = 233; a = 1.40×10³, b = 5.97×10²). (B) Dependence of the areas (km2) of municipalities in the Shikoku Region on the logarithmic rank. The brown line indicates the optimized fit (|r| = 0.9951 with d = 0.614 for q = 1.14 and n = 95; a = 2.08×10³, b = 1.05×10³). (C) Dependence of the areas (km2) of municipalities in the Kinki Region on the logarithmic rank. The brown line indicates the optimized fit (|r| = 0.9963 with d = 0.172 for q = 0.80 and n = 227; a = 2.68×10², b = 1.13×10²). (D) Dependence of the areas (km2) of municipalities in the Greater Tokyo Area (GTA) on the logarithmic rank. The brown line indicates the optimized fit (|r| = 0.9988 with d = 0.492 for q = 0.57 and n = 203; a = 35.9, b = 14.0). (E) Dependence of the areas (km2) of municipalities in the Tokyo Bayside Area (TBA) on the logarithmic rank. The brown line indicates the optimized fit (|r| = 0.9981 with d = 1.092 for q = 0.72 and n = 48; a = 82.5, b = 46.0).
4.2 Presenting other schemes of consolidations (goals 3, 10, and 11)
The simulated results of Figures 5–7 have indicated that municipal consolidations with Scheme I enhance the rich-get-richer effect [46] in that minor municipalities tend to be absorbed into the neighboring major ones. Indeed, it has been found that for Hokkaido three gigantic hubs around Asahikawa, Kitami, and Kushiro Cities are generated. To relieve the effect, here we present another consolidation scheme (Scheme II) noticing the population instead of the population density. Namely, consolidation is made between a depopulated municipality with population less than two thousand and the neighboring one with the largest population. In contrast to the previous one, density is not considered in this scheme. This model would be preferable in prefectures with vast areas for dairy farming, where depopulation in the density does not necessarily correlate with decline.
To detail how to make consolidations according to Scheme II, for Fukushima Prefecture the nine municipalities with small populations (for instance, lower than 2,000) are written:
Futaba Town (0), Katsurao Village (420),
Hinoemata Village (504), Okuma Town (847),
Showa Village (1,246), Idate Village (1,318),
Mishima Town (1,452), Kaneyama Town (1,862),
Namie Town (1,923),
where the numeric in the parentheses indicates the population. Again, note the null population of Futaba Town in which one can see the Fukushima Daiichi nuclear power plant. In our simulations using Scheme II, of the nine municipalities above, priorities are assigned to smaller populations. With this rule the entire consolidation will be made according to the plan as follows (area being given by the numeric in km2):
Stage 1: 51.42 (Futaba Town) + 223.14 (Namie Town)
= 274.56 (New Namie Town).
Stage 2: 84.37 (Katsurao Village) + 344.42 (Nihonmatsu City)
= 428.79 (New Nihonmatsu City).
Stage 3: 390.46 (Hinoemata Village) + 886.47 (Minami-Aizu Town)
= 1,276.93 (New Minami-Aizu Town).
Stage 4: 78.71 (Okuma Town) + 458.33 (Tamura City)
= 537.04 (New Tamura City).
Stage 5: 209.46 (Showa Village) + 276.33 (Aizu-Misato Town)
= 485.79 (New Aizu-Misato Town).
Stage 6: 230.13 (Idate Village) + 398.58 (Minami-Soma City)
= 628.71 (New Minami-Soma City).
Stage 7: 90.81 (Mishima Town) + 175.82 (Yanaizu Town)
= 266.63 (New Yanaizu Town).
Stage 8: 293.92 (Kaneyama Town) + 298.18 (Nishi-Aizu Town)
= 592.10 (New Nishi-Aizu Town).
Stage 9: 274.56 (New Namie Town) + 628.71 (New Minami-Soma City)
= 903.27 (Novel Minami-Soma City).
Figure 14A shows the scattergram of scaling exponents after the municipal consolidations according to Scheme II versus those before consolidation (R = 0.8936 with d = 2.575). The crosses that are superimposed on the dots highlight the three prefectures in the subsequent figure. Of the 19 dots, there are 10 dots below the diagonal line, indicating that in comparison with the results on Figure 5B the rich-get-richer effect can be relieved substantially. Figure 14B shows the dependence of scaling exponent, q, on the consolidatory stage. The three prefectures (Hokkaido, Fukushima, and Nagano Prefectures) are selected from Figure 14A, which are discriminated, respectively, with the red, green, and blue ink.
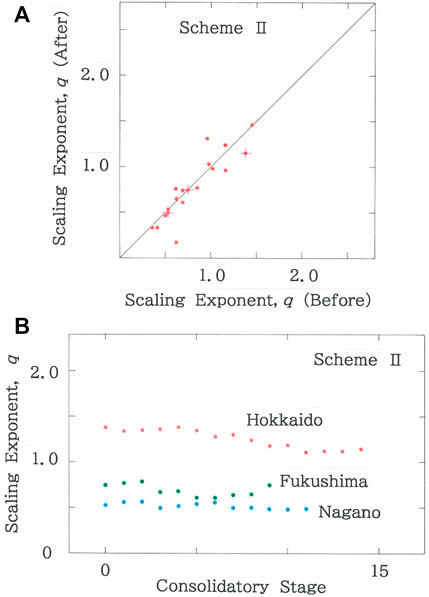
FIGURE 14. (A) Scattergram of scaling exponents after the municipal consolidations according to Scheme II versus those before consolidation (R = 0.8936 with d = 2.575). The crosses that are superimposed on the dots highlight the three prefectures in (B). (B) Dependence of scaling exponent, q, on the consolidatory stage. Three prefectures (Hokkaido, Fukushima, and Nagano Prefectures) are selected from (A), which are discriminated, respectively, with the red, green, and blue ink.
As in other Asian countries such as India, Burma, Thailand, Lao, Taiwan, and China, Japan is far from unrelated to ethnic minority issues [18–20]. Unfortunately, not to mention Scheme I, even Scheme II might not be compatible with the issue, because in most cases the absorption into the larger municipality is necessarily responsible for the removal of indigenous toponyms. What is worse, the decline of ethnic society might be further spurred by the removal of the toponyms. To cope with the anxiety, finally we will present Scheme III, in which a depopulated municipality is annexed to the neighboring one with, instead of the largest one, the smallest population. With this scheme, further reduction of the rich-get-richer effect can be expected.
Again, we will take notice of Fukushima Prefecture. In our simulations using Scheme III, of the nine municipalities above, priorities are assigned to smaller populations. With this rule the entire consolidation for this prefecture will be made according to the procedure as follows (area being given by the numeric in km2):
Stage 1: 51.42 (Futaba Town) + 78.71 (Okuma Town)
= 130.13 (New Okuma Town).
Stage 2: 84.37 (Katsurao Village) + 223.14 (Namie Town)
= 307.51 (New Namie Town).
Stage 3: 390.46 (Hinoemata Village) + 747.56 (Tadami Town)
= 1,138.02 (New Tadami Town).
Stage 4: 130.13 (New Okuma Town) + 197.35 (Kawauchi Village)
= 327.48 (New Kawauchi Village).
Stage 5: 209.46 (Showa Village) + 90.81 (Mishima Town)
= 300.27 (New Mishima Town).
Stage 6: 230.13 (Idate Village) + 307.51 (New Namie Town)
= 537.64 (Novel Namie Town).
Stage 7: 293.92 (Kaneyama Town) + 300.27 (New Mishima Town)
= 594.19 (Novel Mishima Town).
Figure 15A shows the scattergram of scaling exponents after the municipal consolidations according to Scheme III versus those before consolidation (R = 0.9119 with d = 2.942). The crosses that are superimposed on the dots highlight the three prefectures in the following figure. It should be noted that there are only 5 dots in the region below the diagonal line, indicating that the third consolidation scheme is useful for mitigating the competition among municipalities in a prefecture. Subsequently Figure 15B plots the dependence of scaling exponent, q, on the consolidatory stage. Again, three prefectures (Hokkaido, Fukushima, and Nagano Prefectures) are selected from Figure 15A, which are discriminated, respectively, with the red, green, and blue ink.

FIGURE 15. (A) Scattergram of scaling exponents after the municipal consolidations according to Scheme III versus those before consolidation (R = 0.9119 with d = 2.942). The crosses that are superimposed on the dots highlight the three prefectures in (B). (B) Dependence of scaling exponent, q, on the consolidatory stage. Three prefectures (Hokkaido, Fukushima, and Nagano Prefectures) are selected from (A), which are discriminated, respectively, with the red, green, and blue ink.
4.3 Adding notes for the future
In the high rank region in several plots of Figures 2, 13, there have been characteristic oscillations or wavelets across the regression line. Those are supposed to arise from certain artifacts due to the influence from the mathematical divisions, which, in contrast to the natural boundaries, cannot be compatible with our model of a tournament game [8, 33]. In order to make a more precise regression, Eq. 3 might be modified for instance in the from
where ϕ(m) (t) is the error function with Hm(t) being the Hermite polynomial of order m
Here, on assuming a value of m, a set of optimized values for additional parameters (α, β, and ε) could be obtained by a simplex method [47].
In a series of Figures 8–11, effects of the future sea-level rise have been given on the three parameters of Eq. 3, where uniform inundation has been assumed. To discuss the topic in more detail, numerical simulations based on an encroachment model may be useful. Here we will take notice on the applicability of a method once developed for explaining propagating plagues [48]:
where I (z, t) and S (z, t), respectively, are population densities of inundated and non-inundated lands; D, β, and γ are positive parameters. The coupled parabolic-type nonlinear partial differential equations can be solved numerically by a split-step procedure with the combined use of finite elements (for z) and the Crank-Nicolson method [49] (for t). To roughly estimate the head velocity of I (z, t) we will approximate Eq. 14b as
where it is assumed that S ∼ S0. This equation allows one to use the model by Skellam [50], which can eventually result in the formula of the head velocity
with the assumption that βS0—γ ≥ 0. Equation 16 shows that at the critical point
the chronic encroachment will stop. Whether this condition can really be met depends on which countermeasure is selected for mitigating impacts due to the global warming.
5 Conclusion
Perturbation analysis of the rank-size rule has been made for municipalities that are squeezed in a prefecture. Specifically, attention has been focused on Japanese prefectures, for which effects of the archipelagoes, municipal consolidations, and coastal inundations due to the future sea-level rise have been examined in details. First, in comparisons between the results of the mainland and those of the entire prefecture with territorial islands, it has been suggested that historical interactions over a long period become a key factor to enhance the statistical rule. In contrast to spontaneous interactions between the mainland of Hokkaido and the Northern Territories as well as the ones between the mainland of Kagoshima Prefecture and the Southwest Islands, no evidence, to our knowledge, is found of suggesting active interactions between the Tokyo Metropolis mainland and its territorial islands. Namely, the latter seem to be assigned into the former solely for an administrative convenience. Subsequently the method has been applied also to the typical clusters of neighboring prefectures. The most significant clustering effect has been found for the inter-prefectural area around the capital, i.e., |r|: 0.9961 (for the Metropolis of Tokyo; Figure 3A) →0.9981 (for the TBA; Figure 13E) →0.9988 (for the GTA; Figure 13D). Next, to cope with rapidly increasing rural depopulation, simulations have been made using three consolidatory schemes (Scheme I to III). Of prefectures with extremely depopulated areas, particular emphasis has been on Hokkaido, Fukushima, and Nagano Prefectures. Although to be compatible with the ethnic minority issues the simulated results have suggested the advantage of the last consolidation scheme (Scheme III), a blend among the three schemes will become a realistic method. Lastly, analysis has been made implying perturbations due to the global warming. Among the three parameters that characterize the rank-size relation, remarkable stability has been confirmed for the scaling exponent. Furthermore, analysis for prefectures along the TBA has shown that at least in the near future no drastic collapse will occur in the current rank-size rule.
Finally, the study of this paper remains open. To seek all over the world for clusters of prefectures bearing the rank-size rule, international cooperations are needed. In particular, it appears interesting to identify, if any, the specific cluster with a degree of fit that is higher than the value of the GTA. The most likely candidate will be the one that is composed by several prefectures around a gigantic hub with population density comparable to or higher than the one of Tokyo Metropolis, the topography of which might be analogous to a certain kind of complex networks.
Data availability statement
The raw data supporting the conclusions of this article will be made available by the authors, without undue reservation.
Author contributions
The author confirms being the sole contributor of this work and has approved it for publication.
Conflict of interest
The author declares that the research was conducted in the absence of any commercial or financial relationships that could be construed as a potential conflict of interest.
Publisher’s note
All claims expressed in this article are solely those of the authors and do not necessarily represent those of their affiliated organizations, or those of the publisher, the editors and the reviewers. Any product that may be evaluated in this article, or claim that may be made by its manufacturer, is not guaranteed or endorsed by the publisher.
References
2. Barthelemy M. The structure and dynamics of cities. Cambridge: Cambridge University Press (2016).
3. Netto VM, Meirelles J, Ribeiro FL. Social interaction and the city: The effect of space on the reduction of entropy. Complexity (2017) 2017:1–16. doi:10.1155/2017/6182503
4. Netto VM, Brigatti E, Meirelles J, Ribeiro FL, Pace B, Cacholas C, et al. Cities, from information to interaction. Entropy (2018) 20:834. doi:10.3390/e20110834
5. Ribeiro FL, Meirelles J, Netto VM, Neto CR, Baronchelli A. On the relation between transversal and longitudinal scaling in cities. PLoS ONE (2020) 15:e0233003. doi:10.1371/journal.pone.0233003
6. Meirelles J, Ribeiro FL, Cury G, Binder CR, Netto VM. More from less? Environmental rebound effects of city size. Sustainability (2021) 13:4028. doi:10.3390/su13074028
7. Operti FG, Moreira AA, Reis SDS, Gabrielli A, Makse HA, Andrade JS. Dynamics of racial residential segregation and gentrification in New York City. Front Phys (2022) 9:777761. doi:10.3389/fphy.2021.777761
8. Hayata K. Birth, annexation, and squeezing of cities in a prefecture: Can the ranking of competitive areas of municipalities obey the authentic power law? Front Phys (2022) 9:789571. doi:10.3389/fphy.2021.789571
9. Bassolas A, Gómez S, Arenas A. Diffusion and synchronization dynamics reveal the multi-scale patterns of spatial segregation. Front Phys (2022) 10:833426. doi:10.3389/fphy.2022.833426
10. Curiel RP, Cabrera-Arnau C, Bishop SR. Scaling beyond cities. Front Phys (2022) 10:858307. doi:10.3389/fphy.2022.858307
11. López-Sanz JM, Penelas-Leguía A, Gutiérrez-Rodriguez P, Cuesta-Valiño P. Rural tourism and the sustainable development goals. A study of the variables that most influence the behavior of the tourist. Front Psychol (2021) 12:722973. doi:10.3389/fpsyg.2021.722973
12. Wang Z, Zhao Y. Energy strategy for sustainable development of rural areas based on the analysis of sustainable digital economy. Front Psychol (2021) 12:788026. doi:10.3389/fpsyg.2021.788026
13. Singh GG, Cottrell RS, Eddy TD, Cisneros-Montemayor AM. Governing the land-sea interface to achieve sustainable coastal development. Front Mar Sci (2021) 8:709947. doi:10.3389/fmars.2021.709947
14. Codjoe SNA, Atiglo DY. The implications of extreme weather events for attaining the sustainable development goals in Sub-Saharan Africa. Front Clim (2020) 2:5926558. doi:10.3389/fclim.2020.592658
15. Hospers GJ, Reverda N. Managing population decline in Europe’s urban and rural areas. Cham: Springer (2015).
16. Skinner MW, Hanlon N, editors. Ageing resource communities: New Frontiers of rural population change, community development and voluntarism. London: Routledge (2016).
17. Tsutsumi K. Depopulation, aging, and living environments: Learning from social capital and mountainous areas in Japan. Singapore: Springer (2021).
18. Sjöberg K. The return of the Ainu: Cultural mobilization and the practice of ethnicity in Japan. Chur: Harwood Academic Publishers (1993).
21. Kaneko M, Iwata H, Shiotsu H, Masaki S, Kawamoto Y, Yamasaki S, et al. Radioactive Cs in the severely contaminated soils near the Fukushima Daiichi nuclear power plant. Front Energ Res (2015) 3:37. doi:10.3389/fenrg.2015.00037
22. Roggema R, Yan WL, editors. Tsunami and Fukushima disaster: Design for reconstruction. Cham: Springer (2017).
23. Takebayashi Y, Maeda M, Orui M, Nakajima S, Momoi M, Ito A, et al. Resilience factors contributing to mental health among people affected by the Fukushima disaster: Development of Fukushima resilience scale. Front Public Health (2020) 8:159. doi:10.3389/fpubh.2020.00159
24. Tsujiguchi T, Sakamoto M, Koiwa T, Suzuki Y, Ogura K, Ito K, et al. A simple survey of the preparation situation for resident’s evacuation in Japanese prefectures after the Fukushima Daiichi nuclear power plant accident. Front Public Health (2020) 8:496716. doi:10.3389/fpubh.2020.496716
25. Karácsonyi D, Taylor A, Bird D, editors. The demography of disasters: Impacts for population and place. Cham: Springer (2021).
26. Kobayashi T, Maeda M, Nakayama C, Takebayashi Y, Sato H, Setou N, et al. Disaster resilience reduces radiation-related anxiety among affected people 10 years after the Fukushima Daiichi nuclear power plant accident. Front Public Health (2022) 10:839442. doi:10.3389/fpubh.2022.839442
27. Church J, Woodworth PL, Aarup T, Wilson WS. Understanding sea-level rise and variability. Chichester: Wiley-Blackwell (2010).
28. Hine AC, Johnson S. Sea level rise in Florida: Science, impacts, and options. Gainesville, Fla: University Press of Florida (2016).
29. Alam M, Lee J, Sawhney P, editors. Status of climate change adaptation in Asia and the Pacific. Cham: Springer (2019).
30. Dubash NK, editor. India in a warming world: Integrating climate change and development. New Delhi: Oxford University Press (2019).
33. Hayata K. Statistical properties of extremely squeezed configurations: A feature in common between squared squares and neighboring cities. J Phys Soc Jpn (2003) 72:2114–7. doi:10.1143/jpsj.72.2114
34. Hayata K. A time-dependent statistical analysis of the large-scale municipal consolidation. Forma (2010) 25:37–44.
35. Vélez JI, Correa JC, Marmolejo-Ramos F. A new approach to the Box-Cox transformation. Front Appl Math Stat (2015) 1:12. doi:10.3389/fams.2015.00012
36. Moura NJ, Ribeiro MB. Zipf law for Brazilian cities. Physica A: Stat Mech its Appl (2006) 367:441–8. doi:10.1016/j.physa.2005.11.038
37. Benguigui L, Blumenfeld-Lieberthal E. A dynamic model for city size distribution beyond Zipf’s law. Physica A (2007) 83:036106.
38. Saichev A, Malevergne Y, Sornette D. Theory of Zipf’s law and beyond. Berlin: Springer-Verlag (2010).
39. Ghosh A, Chatterjee A, Chakrabarti AS, Chakrabarti BK. Zipf’s law in city size from a resource utilization model. Phys Rev E (2014) 90:042815. doi:10.1103/physreve.90.042815
40. Chen Y. The evolution of Zipf’s law indicative of city development. Physica A: Stat Mech its Appl (2016) 443:555–67. doi:10.1016/j.physa.2015.09.083
41. Arshad S, Hu S, Ashraf BN. Zipf’s law and city size distribution: A survey of the literature and future research agenda. Physica A: Stat Mech its Appl (2018) 492:75–92. doi:10.1016/j.physa.2017.10.005
42. Arshad S, Hu S, Ashraf BN. Zipf’s law, the coherence of the urban system and city size distribution: Evidence from Pakistan. Physica A: Stat Mech its Appl (2019) 513:87–103. doi:10.1016/j.physa.2018.08.065
43.Tsuneta Yano Commemorative Association. Kensei: The data book for the 47 prefectures in Japan. Tokyo: Tsuneta Yano Commemorative Association (2017).
44. Brown JDJ. Japan, Russia and their dispute: The northern delusion. New York, NY: Routledge (2016).
45. Bukh A. These islands are ours: The social construction of territorial disputes in Northeast Asia. Stanford, CA: Stanford University Press (2020).
46. Merton RK. The Matthew effect in science. Science (1968) 159:56–63. doi:10.1126/science.159.3810.56
47. Nelder JA, Mead R. A simplex method for function minimization. Comput J (1965) 7:308–13. doi:10.1093/comjnl/7.4.308
48. Noble JV. Geographic and temporal development of plagues. Nature (1974) 250:726–9. doi:10.1038/250726a0
49. Crank J, Nicolson P. A practical method for numerical evaluation of solutions of partial differential equations of the heat conduction type. Math Proc Camb Phil Soc (1947) 43:50–67. doi:10.1017/s0305004100023197
Keywords: sustainable development goals, social interaction, rank-size rule, municipal consolidation, rural depopulation, Fukushima Daiichi nuclear disaster, global warming
Citation: Hayata K (2022) Perturbation analysis of the rank-size rule for municipalities squeezed in a prefecture: Effects of the archipelagoes, rapidly increasing rural depopulation, ethnic minority issues, and future sea-level rise due to global warming. Front. Phys. 10:1022995. doi: 10.3389/fphy.2022.1022995
Received: 19 August 2022; Accepted: 20 September 2022;
Published: 14 October 2022.
Edited by:
Leonardo B. L. Santos, Cemaden, BrazilReviewed by:
Marcus Fernandes Da Silva, Bahia Federal Institute of Education, Science and Technology, BrazilVander L. S. Freitas, Universidade Federal de Ouro Preto, Brazil
Copyright © 2022 Hayata. This is an open-access article distributed under the terms of the Creative Commons Attribution License (CC BY). The use, distribution or reproduction in other forums is permitted, provided the original author(s) and the copyright owner(s) are credited and that the original publication in this journal is cited, in accordance with accepted academic practice. No use, distribution or reproduction is permitted which does not comply with these terms.
*Correspondence: Kazuya Hayata, aGF5YXRhQHNndS5hYy5qcA==