 Songjie Guo
 Yan Yang1
 Zhimin Lu
 Shunchun Yao
95% of researchers rate our articles as excellent or good
Learn more about the work of our research integrity team to safeguard the quality of each article we publish.
Find out more
ORIGINAL RESEARCH article
Front. Phys. , 03 October 2022
Sec. Optics and Photonics
Volume 10 - 2022 | https://doi.org/10.3389/fphy.2022.1020376
This article is part of the Research Topic State-of-the-Art Laser Spectroscopy and its Applications : Volume II View all 51 articles
The measurement of nitric oxide (NO) concentration in power plant flue gas by tunable diode laser absorption spectroscopy (TDLAS) is susceptible to fly ash particles. The presence of fly ash particles causes laser intensity fluctuations and leads to the second harmonic (2f) signal amplitude changes. In this manuscript, we analyzed the influence of particles on the 2f signal and corrected the measurement error of NO concentration by the wavelength modulation-second harmonic (WMS-2f) technique. Specifically, the 2f signal error caused by quartz sand and fly ash particles were measured, and the exponential function representing the peak-to-peak error of the 2f signal was obtained by fitting. Finally, the peak-to-peak value of the 2f signal and the NO concentration were corrected according to the exponential function. After correction, the NO concentration error under the fly ash influence (the particle size in the range of 10–200 μm and the mass concentration is less than 18.26 g/m3) was no more than 2%. This correction method effectively improves the measurement accuracy of NO concentration by the WMS-2f technique in the fly ash environment.
Nitrogen oxide (NOX) is an important air pollutant [1], and its primary source of emissions is coal-fired power plants. The main component of NOx in flue gas is nitric oxide (NO). Various optical techniques have been widely used in gas pollutant monitoring [2, 3]. In daily operation, the continuous emission monitoring system (CEMS) of flue gas is used to online monitor the NO emission concentration. Currently, the in-situ method is one of the primary forms of the CEMS system [4]. This method refers to directly measured in the flue, enables to obtain actual values more easily of flue gas concentrations, and has a short response time [5]. However, the environment in the flue is complex, and the mass concentration of fly ash is relatively high. The extinction effect caused by scattering and absorption by fly ash particles will greatly influence the detection of NO and other components concentration by optical technique [6].
TDLAS is one of the main measurement techniques of NO concentration in flue gas at present [7], including direct absorption spectroscopy (DAS) and wavelength modulation spectroscopy (WMS). DAS is susceptible to interference from low-frequency noise, and its detection sensitivity is limited. WMS can effectively restrain low-frequency noise by superimposing a high-frequency modulation signal on the basic low-frequency scanning signal and demodulating it at high frequency [8–11]. WMS technique has a high detection sensitivity, which can reach 10−5–10–6. It is widely used for trace gas detection, such as in industrial process control [12], environmental monitoring [13], and pathology diagnosis [14]. The peak value of the second harmonic (2f) signal of demodulated WMS signal corresponds to the central frequency of the gas absorption line, and the 2f signal has a larger amplitude than the higher-order harmonics. Therefore, it is suitable for gas concentration inversion. It was demonstrated that when the absorption is small, the 2f signal amplitude changes approximately linearly with gas concentration at constant laser intensity, absorption path, and modulation parameters [15, 16]. The target gas concentration can be directly calculated by comparison with the 2f signal amplitude of the standard gas. This method is referred to as the wavelength modulation-second harmonic (WMS-2f) technique and was widely implemented in industrial equipment.
However, the stability of laser intensity must be guaranteed to calculate gas concentration using the WMS-2f technique reliably. If the laser intensity fluctuates, the amplitude of demodulated 2f signal accordingly changes. Attenuation of laser intensity by non-gas absorption introduces errors to the calculated values of gas concentration, which limits the application of the WMS-2f technique in environments with drastic laser intensity fluctuation [17]. In particular, the laser intensity is inevitably affected by the extinction effect of fly ash during the in-situ measurements in coal-fired power plants’ flue, which results in small measurement values. Eliminating the influence of fly ash on calculated values of flue gas component concentrations is a difficult problem. Some researchers have proposed using a laser intensity reference signal to eliminate the effect of laser intensity fluctuation. The reference signals can be the filtered laser intensity signal or the first harmonic (1f) signal [18]. Although this method can somewhat eliminate the influence of laser intensity fluctuation, its calculation program is complicated. Moreover, drastic changes in laser intensity and electronic noise in the demodulation process can also result in some errors. Wang et al. discussed the effect of particles on the 2f signal based on the TDLAS technique. They used the transmitted laser intensity to calibrate the 2f signal to solve the problem of particle interference with gas measurements. A concentration of 20% carbon dioxide was measured, and the calibrated 2f peak error was less than 5% [19].
In order to eliminate the particle’s influence on the NO concentration measurement, we analyze the effect of particle mass concentration and particle size on the 2f signal. The law revealed can be used to correct NO concentration errors directly. This method is different from that of measuring laser reference intensity. Direct research on error sources can effectively improve the measurement accuracy of NO concentration in the particulate environment and simplify the computing system. The peak-to-peak error of the 2f signal caused by quartz sand and fly ash was measured in the manuscript. The error was normalized and fitted by the exponential function. Finally, the calculation error of NO concentration was corrected using the error exponential fitting function and the standard gas calibration function.
As mentioned above, when measuring NO in the flue gas environment with particles, it is the fundamental guarantee for accurate measurement to determine the extinction effect of particles and correct the measurement signal. The correction flow chart is shown in Figure 1.
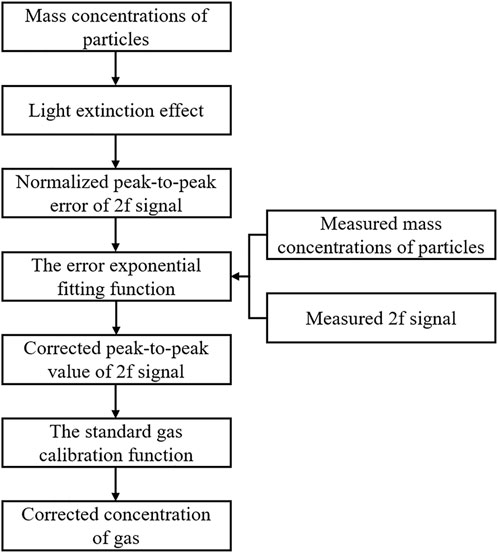
FIGURE 1. Correction flow chart of the peak-to-peak value of 2f signal and gas concentration.
As shown in Figure 1, the error exponential fitting function needs to be obtained in advance before correction. In the online measurement, as long as we correct the error of the 2f signal and the gas concentration according to the fitting function. The detailed principle is described as follows.
Due to scattering and absorption of particles, the laser intensity passing through a medium containing particles will attenuate. The attenuation degree is directly related to particles’ mass concentration and particle size. According to the Beer-Lambert law, when a monochromatic parallel light with intensity
where
where
For uniform particles of the same size, the relationship between their number concentration N and mass concentration
The effect of stable and uniformly distributed particles on the scattering and absorption of laser is constant. Therefore, the extinction effect caused by different mass concentrations of particles was measured through experiments and was fitted using Eq. 4. From this, the law describing the dependence of the extinction effect on particle mass concentration can be obtained. This law can be used to correct the measurement error of laser intensity at different mass concentrations of particles.
There are many ways to measure the laser intensity change, including direct and indirect measurements. Although the device for directly measuring the laser intensity is simple, it is necessary to keep the laser power stable, and it is difficult to avoid the interference of low-frequency noise, which will introduce significant errors [23]. TDLAS technique often measures gas concentration by scanning wavelength and also indirectly obtains the change in laser intensity. Noteworthily, correcting laser intensity changes can improve the TDLAS technique accuracy for measuring gas concentrations.
According to the Beer-Lambert law, when a laser beam of frequency
where
where
where
Here,
It can be seen from Eq. 9 that each harmonic component is proportional to the gas concentration. In practical measurements, the gas concentration is often calculated using the peak-to-peak value of the 2f signal. At the same time, the 2f peak-to-peak value is proportional to the laser intensity. When the laser intensity decreases by non-gas absorption, the 2f peak-to-peak value also decreases. Eq. 4 can be further expressed as follows:
where
where
In order to verify the feasibility and accuracy of the above correction method, we designed and built an experimental system. Firstly, we selected the absorption line of NO located at 1929.02 cm−1 as the target detection line, corresponding to a wavelength of 5.184 μm. Figure 2 shows the distribution of NO absorption lines between 1.5 and 5.5 μm. It can be seen that the absorption linestrength near 5–5.5 μm for NO is stronger. In particular, there are six very close absorption lines of NO at 5.184 μm, and they work together to produce a larger absorption peak, as shown in the black shaded area in Figure 2B.
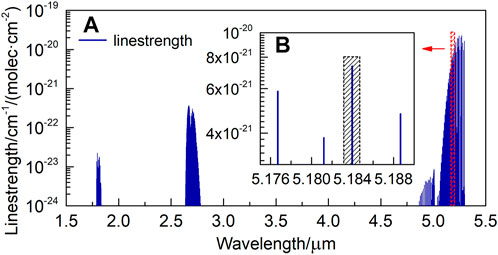
FIGURE 2. NO absorption lines distribution between (A) 1.5–5.5 μm. (B) 5.175–5.19 μm (From HITRAN Database).
The main components of the experimental system were the laser, the fly ash unit (as shown in the dashed box), the gas cell, and the signal processing section. A function generator was installed inside the lock-in amplifier (HPLIA, HEALTHY PHOTO), which generated a sawtooth signal with a frequency of 2 Hz and a sine wave signal with a frequency of 6 kHz. These signals were transmitted to the laser controller (HPTCD-Q, HEALTHY PHOTO) and controlled the current of a quantum cascade laser (HPQCL-Q, HEALTHY PHOTO). The modulation voltage was adjusted to keep the modulation coefficient at about 2.2. The QCL central wavelength is 5.184 μm. We used a self-designed fly ash unit system, which included a powder feeder, a fly ash pipe, a powder collector, and a vortex blower. Because the gas cell was closed and the fly ash pipe was open during measurements, it was inconvenient to combine them. Moreover, the effects of gas and fly ash on laser intensity could be considered independent, so we decided to separate them. In the experiment, the laser passed through the fly ash unit first and then through the gas cell. The powder feeder was located above the inlet of the fly ash pipe, so the fly ash reached the inlet of the fly ash pipe by free fall. The outlet of the fly ash pipe was connected to the powder collector and the vortex blower, and the suction force of the latter was used to suck the fly ash into the powder collector. This way, a stable flow fly ash environment was formed inside the fly ash pipe. In order to form a relatively stable gas-solid two-phase flow atmosphere, the fly ash pipe included two parts. The fly ash flowed into the second part of the pipe after being evenly mixed in the first part. In order to ensure the same effect distance between particles and NO on the laser, the length of the second part of the pipe was the same as that of the gas cell, both equal to 0.38 m. The laser beam passed through the second part of the pipe. The measurements were carried out on NO gas in the closed gas cell at the stable pressure of 0.99 atm. The laser beam passed through the gas cell once and entered the photodetector (HPPD-M-A, HEALTHY PHOTO). The laser intensity signal detected by the detector was input to the lock-in amplifier for demodulation to obtain the 2f signal. The latter was recorded and transmitted to the computer by a data acquisition card (USB-6363, NI). The experimental setup is schematically shown in Figure 3.
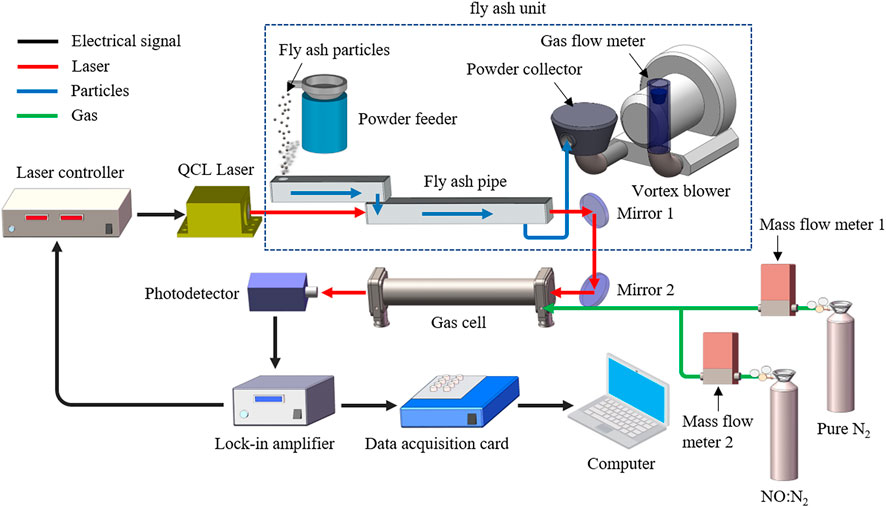
FIGURE 3. Schema of the experimental setup.
The particle amount was controlled by controlling the vibration frequency of the powder feeder. The particle mass concentration was calculated by measuring their mass per unit of time and the real-time volume of air in the vortex blower. When there were only fly ash particles smaller than 100 μm, agglomeration easily occurred in the powder feeder, and it was difficult to generate a uniform flow of fly ash. The intensity of the laser beam passed through the fly ash pipe considerably fluctuates, causing a measurement error. We first used quartz sand to simulate fly ash. The main component of fly ash is SiO2, which is the same as quartz sand. However, the stacking density of quartz sand particles is slightly higher than that of fly ash, and their agglomeration is not easy to occur. Firstly, the mass concentration of quartz sand was measured and calculated by measuring the particle mass in the powder feeder per unit time (unit: g/h) and the air volume in the fly ash pipe in real-time. The air volume was measured using a gas flow meter installed at the outlet of the vortex blower. The air volume of the vortex blower was about 65 m3/h in these experiments. The mass concentration of particles could be obtained by dividing the particle mass by the air volume. In this experiment, the effects of different mass concentrations of particles on the NO 2f signal were analyzed. A higher volume fraction of NO for the measurement was chosen to ensure that the 2f signal has a high amplitude. Firstly, the gas cell was filled with a gas mixture of NO and N2, the volume fraction of the former being 9.06 × 10⁻⁵. After particles flow in the fly ash pipe was stable, the NO 2f signal was recorded, and the experiment was repeated at different particle mass concentrations. Next, the gas cell was flushed with pure N2. Then, five volume fractions of NO, namely 2 × 10⁻⁵, 4 × 10⁻⁵, 6 × 10⁻⁵, 8 × 10⁻⁵, and 1 × 10⁻⁴, were formulated by NO standard gas of volume fraction 1 × 10⁻⁴ in order to quantify and calibrate the errors caused by different mass concentrations of fly ash on the measured values of NO concentration. Two mass flow meters (S48 32/HMT, HORIBA METRON) were used in this process. Finally, these five volume fractions of NO were injected into the gas cell, and their 2f signals were recorded.
As we known, the fly ash particles produced by coal-fired power plants vary in size and have broad size distributions, usually ranging from several to two hundred microns. In order to study the influence of particle size on the NO 2f signal, we used quartz sand with different particle sizes for experiments. It was found after testing that the quartz sand particles smaller than 54 μm tend to agglomerate. Therefore, three particle sizes were chosen for the experiments, namely 54–76 μm, 97–105 μm, and 105–135 μm.
The measurement results of the NO 2f signal influenced by quartz sand with particle sizes of 54–76 μm are shown in Figure 4. Figure 4A presents the NO 2f signals with the removed background at different mass concentrations of particles. The 2f signal was averaged 10 times, and Figure 5, Figure 8 and Figure 10 were also operated in this way. According to Eq. 10, the 2f peak-to-peak value of NO corresponding to different mass concentrations of quartz sand particles was subtracted from the respective value obtained without quartz sand and normalized to obtain the 2f peak-to-peak error of NO. Figure 4A shows that the 2f peak-to-peak value of NO gradually decreased with the increased mass concentration of quartz sand particles. Then the 2f peak-to-peak error of NO and the mass concentration of quartz sand were fitted by an exponential function in the following form:
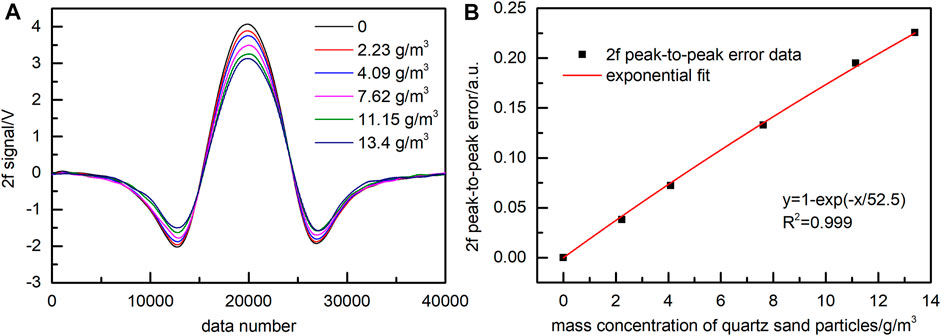
FIGURE 4. Effect of quartz sand (54–76 μm) on the NO 2f signal. (A) 2f signal with removed background. (B) Exponential fitting function of 2f peak-to-peak error.
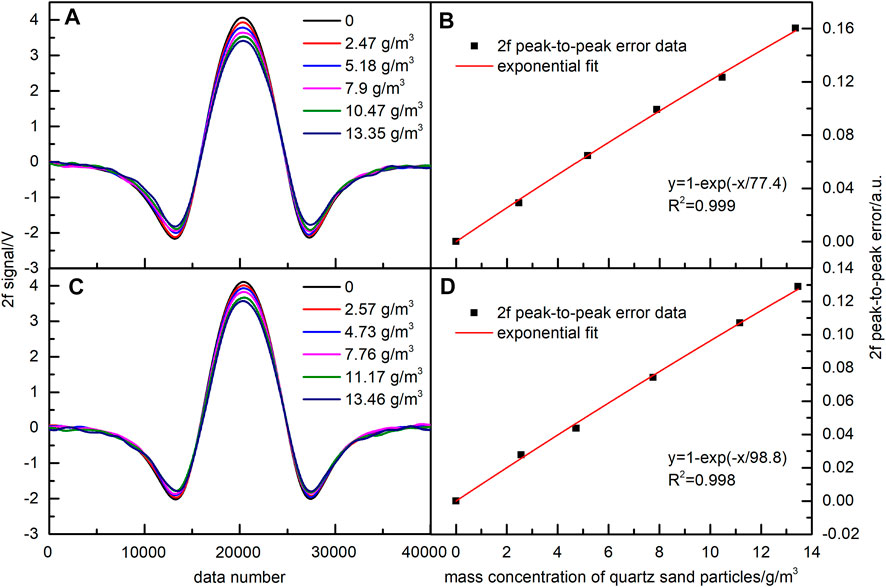
FIGURE 5. Effect of quartz sand on the NO 2f signal. (A) 2f signal with removed background (97–105 μm). (B) Exponential fitting function of 2f peak-to-peak error corresponding to Figure 5A. (C) 2f signal with removed background (105–135 μm). (D) Exponential fitting function of 2f peak-to-peak error corresponding to Figure 5C.
In the same way, quartz sands with particle sizes of 97–105 and 105–135 μm were used for experiments. Obtained results are shown in Figure 5. Similar to the previous case, the 2f peak-to-peak errors of NO were fitted by exponential functions. The values of R2 were 0.999 and 0.998. The obtained results demonstrated that for three different particle sizes, the 2f peak-to-peak error of the NO signal and the quartz sand mass concentration all satisfied a good exponential relationship. The mass concentration of quartz sand particles was calculated by their mass and the air volume of the vortex blower, and there were some differences in the particle amounts between the experiments. Therefore, the quartz sand mass concentrations in the three groups of particle sizes were not exactly the same.
The comparison of the 2f peak-to-peak error exponential fitting functions corresponding to three different sizes of quartz sand particles shown in Figure 4 and Figure 5 demonstrated different t-values for these functions. The t-values gradually increased with particle size, which was consistent with Eq. 10. It indicated that at a constant mass concentration of the same-material particles, the 2f signal error increased with the decrease of average particle size. The reason for this phenomenon was that for the particles with the same mass concentration, under the same action distance with the laser beam, the smaller the particle size, the stronger the extinction effect. Therefore, the laser transmittance and the peak-to-peak value of the 2f signal were also smaller, and the NO concentration error was more significant.
The relationship between the 2f peak-to-peak errors of NO and the mass concentration and particle size of quartz sand could be obtained from the error exponential fitting functions for quartz sand with three different particle sizes results are shown in Figure 6. For quartz sands with three particle sizes, the number of particles obeyed normal size distributions. Therefore, the median values of 65, 101, and 120 μm were taken as the representative ones of the particle size range. It can be seen from Figure 6 that there were some differences in the exponential fitting function of the 2f peak-to-peak error caused by different particle sizes of quartz sand. When the mass concentration of quartz sand was constant, the 2f peak-to-peak error of NO increased rapidly with the decrease of particle size, which is also consistent with Eq. 10.
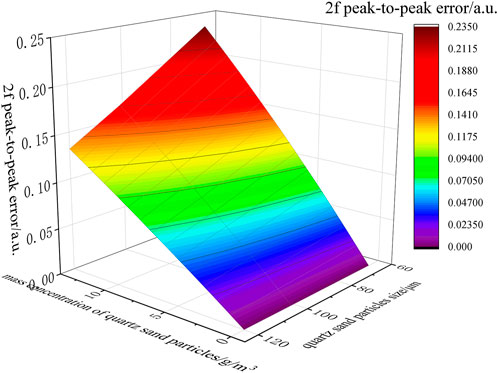
FIGURE 6. Relationship between the 2f peak-to-peak error of NO and the quartz sand mass concentration and size.
Based on the error exponential fitting function of quartz sand with three particle sizes, the mass concentration of quartz sand was changed to make it different from the value in the error exponential fitting function. The changed mass concentrations are shown in Table 1. The 2f peak-to-peak error caused by them was measured again. The 2f peak-to-peak error was corrected with the error exponential fitting function obtained above, and the correction result is shown in Figure 7. Among them, the black line corresponds to the quartz sand of 54–76 μm, the blue line corresponds to the quartz sand of 97–105μm, and the red line corresponds to the quartz sand of 105–135 μm. The square represents the 2f peak-to-peak error before correction, and the circle represents the corrected value 2f peak-to-peak error. The corrected 2f peak-to-peak errors were all less than 0.8%, indicating that the correction effect was good.
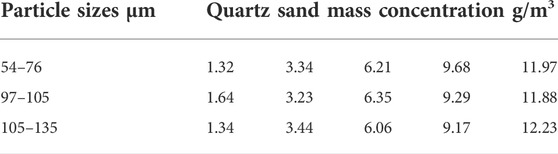
TABLE 1. Mass concentration of three particle sizes of quartz sand.
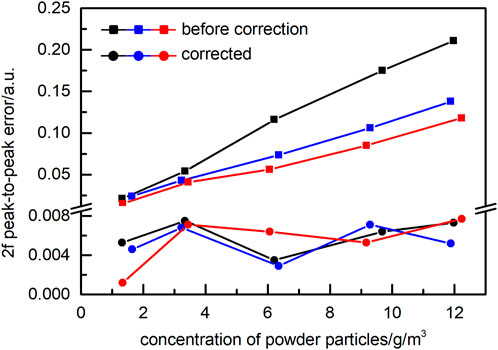
FIGURE 7. 2f peak-to-peak errors and correction results.
To verify the applicability of the above conclusions to fly ash samples, we carried out the same experiments using real flue fly ash produced by a coal-fired power plant. The mass concentration of flue fly ash produced by domestic coal-fired power plants is usually between 10 and 20 g/m3. The size range of fly ash particles used in the experiments was 10–200 μm. Similar to the quartz sand experiments described above, five fly ash mass concentrations were selected. The NO 2f signals corresponding to different mass concentrations were recorded, and the exponential function fitted the 2f peak-to-peak error data of NO. The fitting result shown in Figure 8 reveals the value of R2 equal to 0.995.
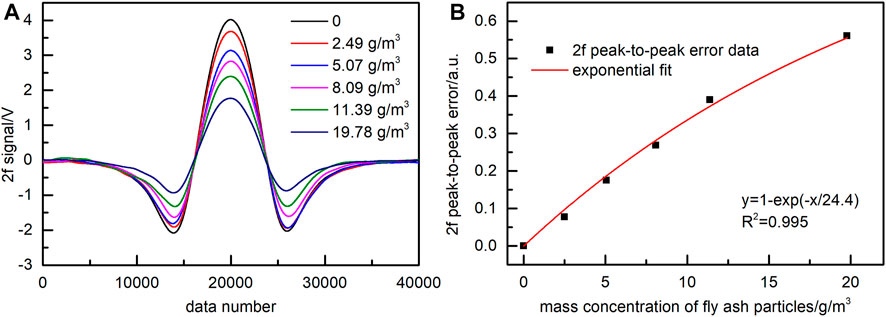
FIGURE 8. Effect of fly ash with particle sizes in the range of 10–200 μm on the NO 2f signal. (A) 2f signal with removed background. (B) Exponential fitting function of 2f peak-to-peak error.
The 2f signals of NO were measured for five volume fractions of 2 × 10⁻⁵, 4 × 10⁻⁵, 6 × 10⁻⁵, 8 × 10⁻⁵, and 1 × 10⁻⁴. The relationship between the 2f peak-to-peak value and the volume fraction of NO was obtained by linear fitting of measurement data, as shown in Figure 9. It can be seen from Figure 9 that the 2f peak-to-peak value and the NO volume fraction satisfied a linear dependence, and the linearity R2 reached 0.999.
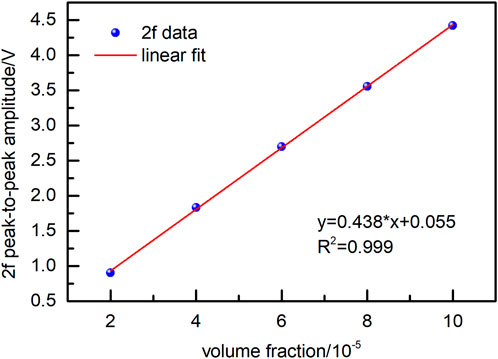
FIGURE 9. Relationship between 2f signal and volume fraction of NO.
To verify the accuracy of the determination of NO concentration using the described error correction method, the fly ash mass concentrations different from the five mass concentrations present in Figure 8 were selected. The values of these mass concentrations were 1.87, 3.95, 7.95, 15.8, and 18.26 g/m3. The peak-to-peak value of the NO 2f signal was recorded at each fly ash mass concentration, and the NO concentration was calculated using the calibration function. After that, the NO concentration was corrected by Eq. 11 and using the 2f peak-to-peak error exponential fitting function presented in Figure 8B. The 2f peak-to-peak error and the NO concentration error caused by different mass concentrations of fly ash, together with the corrected results, are shown in Table 2. It can be seen from this table that the NO concentration error reached 54.6% at the fly ash mass concentration of 18.26 g/m3. The maximum error of NO concentration after the correction was less than 2%, which indicated an effective improvement in measurement accuracy.
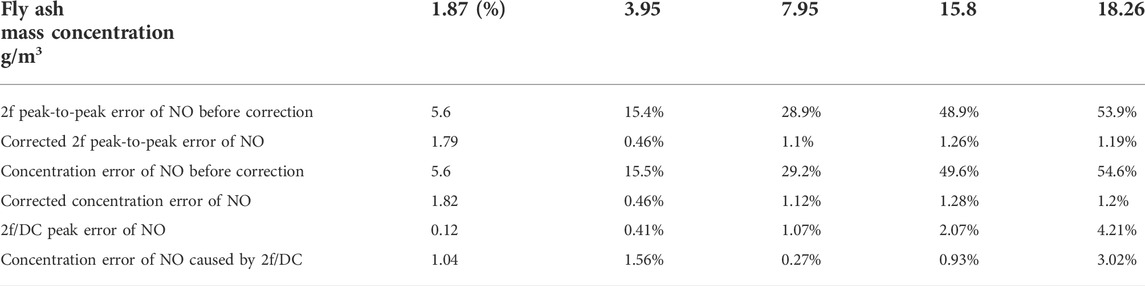
TABLE 2. 2f peak-to-peak error and concentration error of NO before and after correction.
In order to compare with the method of measuring the laser reference intensity, we used a low-pass filter to filter the transmitted laser intensity to obtain the direct current (DC) signal. Then, the 2f/DC signal of NO sample gas with a volume fraction of 9.06 × 10⁻⁵ at the effect of fly ash was measured, and the results are shown in Figure 10. It can be seen that the 2f/DC signal peak value of the same NO concentration was still different at the effect of different concentrations of fly ash. The 2f/DC peak error became more significant as the fly ash concentration increased. At the same time, the 2f/DC signals of five groups of standard NO gases with volume fractions of 2 × 10⁻⁵, 4 × 10⁻⁵, 6 × 10⁻⁵, 8 × 10⁻⁵, and 1 × 10⁻⁴ were measured. The relationship between the peak value of the 2f/DC signal and the gas volume fraction was obtained by linear fitting, and the linearity was good, as shown in Figure 10B.
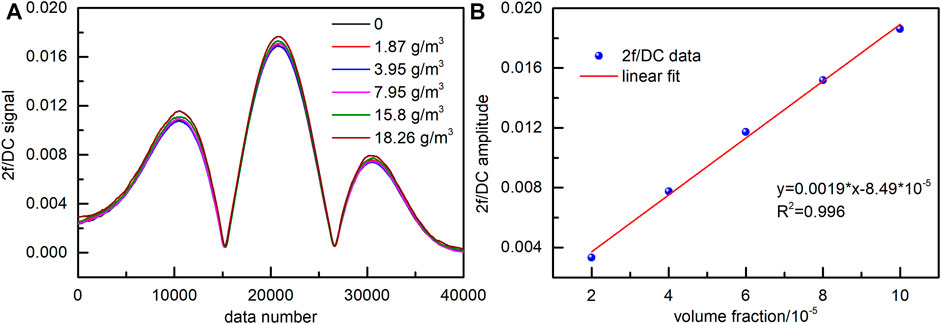
FIGURE 10. 2f/DC signal of NO (A) Effect of fly ash (10–200 μm) on the 2f/DC signal. (B) Relationship between 2f/DC signal and volume fraction.
The 2f/DC peak error and the NO concentration error caused by different mass concentrations of fly ash are shown in the last two rows of Table 2. The maximum error of the 2f/DC peak value exceeded 4%, and the corresponding NO concentration error was 3.02%. It can be seen that compared with the method of measuring the laser reference intensity, the errors of the two methods were roughly equal when the mass concentration of fly ash was low. But if the mass concentration of fly ash was high, the corrected 2f peak-to-peak error was significantly smaller than the 2f/DC peak error. Therefore, without measuring the laser reference laser intensity, the WMS-2f signal could be directly corrected using the error exponential fitting function presented in the experiment.
In this paper, we analyzed the fly ash influence on the peak-to-peak value of the WMS-2f signal and the NO concentration. The study results are as follows: 1) The peak-to-peak value of the WMS-2f signal satisfied an exponential relationship with the mass concentration of uniformly distributed particles; 2) For the same kind of particles, different particle sizes had different effects on the peak-to-peak value of WMS-2f signal. At constant particle mass concentration, the 2f peak-to-peak error of NO was negatively correlated with the particle size. This conclusion also provided a new idea for obtaining fly ash particle size by optical techniques. The 2f peak-to-peak error and NO concentration error caused by fly ash particles were less than 2% after correction. Therefore, we could measure the exponential relationship between the 2f peak-to-peak error of NO and the fly ash mass concentration in advance. Then, the relationship was input into the calculation program of the gas concentration to introduce necessary corrections and to obtain the actual NO concentration. In conclusion, without measuring the laser reference laser intensity, the WMS-2f signal can be directly corrected by the error exponential fitting function presented in the paper. Such a procedure can effectively eliminate the fly ash influence on the flue gas concentration measurement. Obtained results provide a theoretical basis for fly ash error correction and flue gas concentration inversion in complex working environments.
The raw data supporting the conclusion of this article will be made available by the authors, without undue reservation.
All authors listed have made a substantial, direct, and intellectual contribution to the work and approved it for publication.
The study was supported by the National Key R&D Program Intergovernmental International Science and Technology Innovation Cooperation Project (2019YFE0109700), the Science and Technology Project of Guangdong Province (2020A0505140001), the Natural Science Foundation of Guangdong Province-Outstanding Youth Project (2021B1515020071), the Fok Ying Tung Education Foundation 17th Foundation for Young Teachers in Higher Education (171,047), and Innovation and Technology Commission (MHP/049/19), Hong Kong SAR, China.
JM is employed by Cntest Intelligent scien-tech Co., LTD.
The remaining authors declare that the research was conducted in the absence of any commercial or financial relationships that could be construed as a potential conflict of interest.
All claims expressed in this article are solely those of the authors and do not necessarily represent those of their affiliated organizations, or those of the publisher, the editors and the reviewers. Any product that may be evaluated in this article, or claim that may be made by its manufacturer, is not guaranteed or endorsed by the publisher.
1. Pan Y, Dong L, Yin X, Wu H. Compact and highly sensitive NO2 photoacoustic sensor for environmental monitoring. Molecules (2020) 25:1201. doi:10.3390/molecules25051201
2. Zhang Z, Zhang F, Xu B, Xie H, Fu B, Lu X, et al. High-sensitivity gas detection with air-lasing-assisted coherent Raman spectroscopy. Ultrafast Sci (2022), 2022, 1–8. doi:10.34133/2022/9761458
3. Fu Y, Cao J, Yamanouchi K, Xu H. Air-laser-based standoff coherent Raman spectrometer. Ultrafast Sci (2022), 2022, 1–9. doi:10.34133/2022/9867028
4. Zheng H, Tang G. Developing Data Acquisition and Handling System for continuous emission monitoring system from coal-fired power plant. In: 2008 Chinese Control and Decision Conference; 02-04 July 2008; Yantai, China. p. 3616–9. doi:10.1109/CCDC.2008.4598004
5. Li J, Zhang C, Wei Y, Du Z, Sun F, Ji Y, et al. In situ, portable and robust laser sensor for simultaneous measurement of ammonia, water vapor and temperature in denitrification processes of coal fired power plants. Sensors Actuators B: Chem (2020) 305:127533. doi:10.1016/j.snb.2019.127533
6. Chao X, Jeffries JB, Hanson RK. Real-time, in situ, continuous monitoring of CO in a pulverized-coal-fired power plant with a 2.3 μm laser absorption sensor. Appl Phys B (2013) 110:359–65. doi:10.1007/s00340-012-5262-8
7. Wysocki G, Kosterev AA, Tittel FK. Spectroscopic trace-gas sensor with rapidly scanned wavelengths of a pulsed quantum cascade laser for in situ NO monitoring of industrial exhaust systems. Appl Phys B (2005) 80:617–25. doi:10.1007/s00340-005-1764-y
8. Peng Z, Du Y, Ding Y. Highly sensitive, calibration-free WM-DAS method for recovering absorbance-Part I: Theoretical analysis. Sensors (2020) 20:681. doi:10.3390/s20030681
9. Ma Y, Feng W, Qiao S, Zhao Z, Gao S, Wang Y. Hollow-core anti-resonant fiber based light-induced thermoelastic spectroscopy for gas sensing. Opt Express (2022) 30:18836–44. doi:10.1364/OE.460134
10. Pan Y, Zhao J, Lu P, Sima C, Zhang W, Fu L, et al. All-optical light-induced thermoacoustic spectroscopy for remote and non-contact gas sensing. Photoacoustics (2022) 27:100389. doi:10.1016/j.pacs.2022.100389
11. Qiao SD, Sampaolo A, Patimisco P, Spagnolo V, Ma YF. Ultra-highly sensitive HCl-LITES sensor based on a low-frequency quartz tuning fork and a fiber-coupled multi-pass cell. Photoacoustics (2022) 27:100381. doi:10.1016/j.pacs.2022.100381
12. Lackner M. Tunable diode laser absorption spectroscopy (TDLAS) in the process industries-A review. Rev Chem Eng (2007) 23:65–147. doi:10.1515/REVCE.2007.23.2.65
13. Li J, Deng H, Sun J, Yu B, Fischer H. Simultaneous atmospheric CO, N2O and H2O detection using a single quantum cascade laser sensor based on dual-spectroscopy techniques. Sensors Actuators B: Chem (2016) 231:723–32. doi:10.1016/j.snb.2016.03.089
14. Ghorbani R, Schmidt FM. ICL-based TDLAS sensor for real-time breath gas analysis of carbon monoxide isotopes. Opt Express (2017) 25:12743–52. doi:10.1364/OE.25.012743
15. Reid J, Labrie D. Second harmonic detection with tunable diode lasers comparison of experiment and theory. Appl Phys B (1981) 26:203–10. doi:10.1007/BF00692448
16. Li C, Dong L, Zheng C, Tittel FK. Compact TDLAS based optical sensor for ppb-level ethane detection by use of a 3.34μm room-temperature CW interband cascade laser. Sensors Actuators B: Chem (2016) 232:188–94. doi:10.1016/j.snb.2016.03.141
17. Sun K, Chao X, Sur R, Goldenstein CS, Jeffries JB, Hanson RK. Analysis of calibration-free wavelength-scanned wavelength modulation spectroscopy for practical gas sensing using tunable diode lasers. Meas Sci Technol (2013) 24:125203. doi:10.1088/0957-0233/24/12/125203
18. Rieker GB, Jeffries JB, Hanson RK. Calibration-free wavelength-modulation spectroscopy for measurements of gas temperature and concentration in harsh environments. Appl Opt (2009) 48:5546–60. doi:10.1364/ao.48.005546
19. Wang F, Cen K, Li N, Huang Q, Chao X, Yan J, et al. Simultaneous measurement on gas concentration and particle mass concentration by tunable diode laser. Flow Meas Instrum (2010) 21:382–7. doi:10.1016/j.flowmeasinst.2010.04.009
20. Uhlig EM, Hoyningen-Huene W. Correlation of the atmospheric extinction coefficient with the concentration of particulate matter for measurements in a polluted urban area. Atmos Res (1993) 30:181–95. doi:10.1016/0169-8095(93)90022-G
21. Wang RT, Hulst HC. Rainbows: Mie computations and the airy approximation. Appl Opt (1991) 30:106–17. doi:10.1364/AO.30.000106
22. Fu Q, Sun W. Mie theory for light scattering by a spherical particle in an absorbing medium. Appl Opt (2001) 40:1354–61. doi:10.1364/AO.40.001354
23. Mohammad IL, Anderson GT, Chen Y. Noise estimation technique to reduce the effects of 1/f noise in open path tunable diode laser absorption spectrometry (OP-TDLAS). Proc SPIE (2014) 9113:91130S. doi:10.1117/12.2063662
24. Zhu X, Yao S, Ren W, Lu Z, Li Z. TDLAS monitoring of carbon dioxide with temperature compensation in power plant exhausts. Appl Sci (Basel) (2019) 9:442. doi:10.3390/app9030442
25. Goldenstein CS, Spearrin RM, Jeffries JB, Hanson RK. Wavelength modulation spectroscopy near 2.5μm for H2O and temperature in high-pressure and temperature gases. Appl Phys B (2014) 116:705–16. doi:10.1007/s00340-013-5754-1
Keywords: TDLAS, wavelength modulation, particles, extinction effect, NO concentration, error correction
Citation: Guo S, Yang Y, Shao G, Li Z, Ren W, Mo J, Lu Z and Yao S (2022) Correcting the light extinction effect of fly ash particles on the measurement of NO by TDLAS. Front. Phys. 10:1020376. doi: 10.3389/fphy.2022.1020376
Received: 16 August 2022; Accepted: 31 August 2022;
Published: 03 October 2022.
Edited by:
Yufei Ma, Harbin Institute of Technology, ChinaCopyright © 2022 Guo, Yang, Shao, Li, Ren, Mo, Lu and Yao. This is an open-access article distributed under the terms of the Creative Commons Attribution License (CC BY). The use, distribution or reproduction in other forums is permitted, provided the original author(s) and the copyright owner(s) are credited and that the original publication in this journal is cited, in accordance with accepted academic practice. No use, distribution or reproduction is permitted which does not comply with these terms.
*Correspondence: Shunchun Yao, ZXBzY3lhb0BzY3V0LmVkdS5jbg==
Disclaimer: All claims expressed in this article are solely those of the authors and do not necessarily represent those of their affiliated organizations, or those of the publisher, the editors and the reviewers. Any product that may be evaluated in this article or claim that may be made by its manufacturer is not guaranteed or endorsed by the publisher.
Research integrity at Frontiers
Learn more about the work of our research integrity team to safeguard the quality of each article we publish.