 Chen Shen1†
 Liang Chi
 Ximeng Wang
 Mengshuai Zhu
95% of researchers rate our articles as excellent or good
Learn more about the work of our research integrity team to safeguard the quality of each article we publish.
Find out more
ORIGINAL RESEARCH article
Front. Phys. , 05 October 2022
Sec. Social Physics
Volume 10 - 2022 | https://doi.org/10.3389/fphy.2022.1019643
This article is part of the Research Topic Network Mining and Propagation Dynamics Analysis View all 17 articles
The spatial difference in agricultural product prices is a crucial factor affecting the benefits of related stakeholders. This study aims to analyze the mechanisms of spatial price transmission. In this paper, taking garlic as an example, we present a vector autoregression model analyzing relations of the price transmission between producing and selling cities. The partial Granger causality test is used to determine the direction and path of price transmission between the main producing areas and the main consuming areas. We find that the prices in different areas have a complex transmission network and fluctuate in correlation with each other. The results reveal the characteristics of agricultural product price transmission in China and provide reasons and evidence for market regulation.
Analyzing price forming mechanism is a critical means to guide farmers’ behaviors, regulate economic activities and reduce risks, and price transmission is one important reason to affect marketing prices. Asymmetric price transmission is a rule in economic activity [1] and it is of great meaning to analyze price transmission. The main forms of price transmission include vertical and horizontal types. Vertical price transmission is the price linkage through value chains, and horizontal price transmission is spatial and cross-commodity price connections [2], both of which are common in markets.
Scholars have studied price transmission in the agricultural market for decades. Many people analyze agricultural market price transmission at the national level such as pork, beef, maize, rice, and pangasius in the US, Ghana, Vietnam, China, etc., [3–8]. Some other people, such as Bekkers [9] and Luo [10], also study international price transmission. Kim [11] use recursive methods across 100 food commodities and conclude that price linkages are strong. They all conclude that price transmission is universal in the market.
Price transmission could also link with other factors to affect prices. Information propagation is thought greatly important for relationships [12]. Food inflation and price transmission are critical on macroeconomic dimensions [13]. Market integration and structure are linked with price transmission in consumer markets of developing countries [14, 15]. Distance and border have a great effect on price transmission [16]. Improving marketing, information, and transportation technology have strengthened the links between prices [17]. Oligopoly and oligopsony power do not necessarily lead to imperfect price transmission [18].
Researchers should study price transmission with caution about methodologies [19, 20]. There is a wider range of methods to assess linkages and connections [21–23]. Also, the methods to measure price transmission has been progressing, and the econometric model is the most used method in past years, such as the error correction model (ECM), stationarity and integration tests, and autoregressive distributed lag (ARDL) models, generalized autoregressive conditional heteroskedasticity (GARCH). Table 1 lists some examples of measuring price transmission with different methodologies.
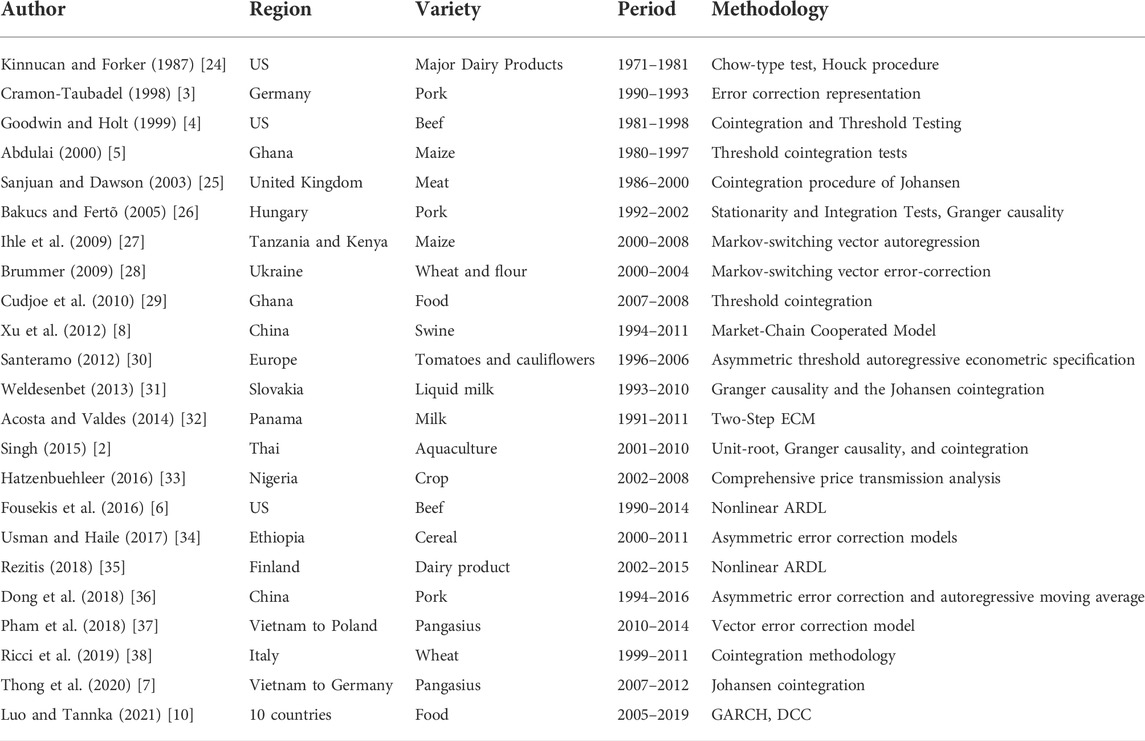
TABLE 1. Literature review of price transmission methods.
In this paper, we focus on vegetable price transmission in China. China is the biggest vegetable producer and consumer. Vegetable prices have attracted a lot of attention over the years because vegetable plays a vital role in daily life while their prices fluctuate greatly. The violent fluctuations of vegetable prices influence farmers’ income and affect consumers’ benefits. In recent years, the Chinese government issued various policies to keep vegetable prices within a reasonable range [39], but still did not solve the problem. Especially for some small varieties, like scallion, ginger, and garlic [40, 41], the total output value is relatively low, so the production guidance and price prediction are quite difficult.
We choose garlic as an example to analyze the price transmission of vegetables in China. On the one hand, the research on garlic price transmission in China is of great significance for the garlic industry both domestically and internationally. China plants about 800,000 ha and produces more than 19 million tons of garlic, with more than 70% output and 62.8% international market share. As the main producing, consuming and exporting country, the relative stability of the garlic planting scale is the basis for the sustainable development of the garlic industry. Studying the characteristics of garlic price transmission is of great significance in guiding farmers to make scientific decisions, stabilizing garlic prices and promoting the stable development of the garlic industry. On the other hand, the special trait of garlic makes its price a hot issue in China. Garlic could be kept for a few months in storage, so it is always processed and refrigerated by dealers after being harvested and sold out at a high market price. In practice, market information such as supply and demand, price trends, circulation costs, and information transmission can all have an impact on price transmission.
Before determining the research area, we comprehensively analyzed the distribution of the garlic industry in China. In terms of production, according to the statistics of 2016, the garlic output of Shandong, Henan and Jiangsu provinces accounted for 57.58% of the total national output. The garlic output of Shandong, Henan and Jiangsu provinces accounted for 27.83%, 18.90%, and 10.86% of the total national output, respectively. The garlic output of Sichuan, Yunnan and Guizhou provinces accounted for 7.74% of the total national output, accounting for less than 1/10 of the total national output. The garlic output of Sichuan, Yunnan and Guizhou provinces accounted for 3.51%, 2.77%, and 1.45% of the total national output, respectively. In terms of planted area, the area of garlic in Shandong, Henan and Jiangsu provinces accounted for 52.64% of the total area of China, accounting for more than half of the total area. The area of garlic in Shandong, Henan and Jiangsu provinces accounted for 25.25%, 14.91%, and 12.48% of the total area of China, respectively. The area of garlic in Sichuan, Yunnan and Guizhou provinces accounted for 12.01% of the total area of China, accounting for only about 1/10 of the total area. The area of garlic in Sichuan, Yunnan and Guizhou provinces accounted for 4.59%, 3.78%, and 3.64% of the total area of China, respectively.
The main purpose of price transmission is to study the relationship between prices. At first, we introduce a methodology to measure price transmission, which is proposed by Krishna [42] and shows great appropriateness in results. Secondly, we analyze the mechanism of vegetable price transmission in China and take garlic as an example. The results reveal that the garlic market in northern China has been highly integrated. There is a causal relationship in the garlic wholesale prices between the main producing areas and important consuming areas. The change of the price in one region will cause the change of garlic wholesale prices in other regions. We also find that the wholesale prices of garlic in China show the characteristics of the bidirectional transmission.
The rest of the paper is organized as follows. In Section 2 we provide materials and methods. In Section 3 we demonstrate the results. In Section 4, we summarize and discuss the results, and analyze these conclusions in combination with the actual situation of the industry.
In this study, we have collected and aggregated ten-day prices from 2015 to 2019 in the wholesale markets of China’s main garlic-producing areas and important consuming cities in northern China. The producing areas include Jinxiang County in Shandong Province, Qixi County in Henan Province, and Pizhou City in Jiangsu Province. The consuming cities include Beijing, Shijiazhuang, Taiyuan, Zhengzhou, and Qingdao, which are all big cities with huge populations.
Figure 1 depicts the trend of wholesale garlic prices. The garlic prices not only vary greatly from year to year but also show relatively seasonal characteristics. The wholesale price data of garlic in Beijing, Shijiazhuang, Taiyuan, Zhengzhou, and Qingdao are from China Agricultural Information Network. And the wholesale price data of Jinxiang County, Qixi County, and Pizhou City are from China Vegetable Association. We take Logarithmic processing of the original price sequences in order to eliminate the heteroscedasticity.
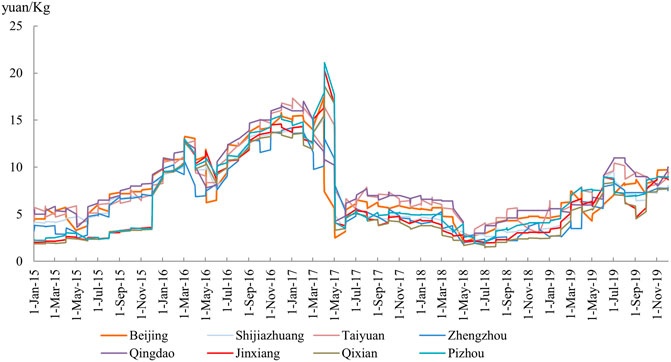
FIGURE 1. Prices of several cities in China from 2015–2019.
Granger causality has been widely used in economic analyses nowadays. According to the Granger causality theory, if the prediction of one process can be improved by incorporating its past information as well as the past information of the other process, then the second process is said to cause the first process. Granger causality test could be demonstrated as follows in Eqs 1, 2.
For a network having multiple entities, one entity can be influenced by another directly or indirectly. Thus, a multivariate model using information from all entities in the system, makes it possible to verify whether two entities share direct causal influence while considering the effect of other entities. Krishna and Guo proposed a partial Granger causality test approach [42].
Now consider two processes
Let
Now let
Then we use the VAR model (vector autoregressive model) including multiple entities in Eq. 10.
To build VAR model, time-series should be weakly stationary. We use the ADF unit root test to test stationarity and Akaike Information Criterion (AIC) to determine the optimal lag order.
Table 2 shows the results of the ADF unit root test for each price series. In the variables, let bj, sjz, qd, zz, ty, jx, pz, qx denote the cities of Beijing, Shijiazhuang, Qingdao, Zhengzhou, Taiyuan, Jinxiang, Pizhou, Qixian, p denote price, and t denote current period. We use AIC statistics with the minimum point for examination. The null hypothesis of the ADF test is that the series is stationary. The p-value of the price series test statistics is more than 0.05, so we reject the null hypothesis. This indicates that none of the garlic wholesale price series examined is stationary. So, the original price series is differenced and then tested for stationarity. The results show that the p-value are less than 0.01. It indicates that the differenced series are all stationary and match the criteria for building the VAR model.
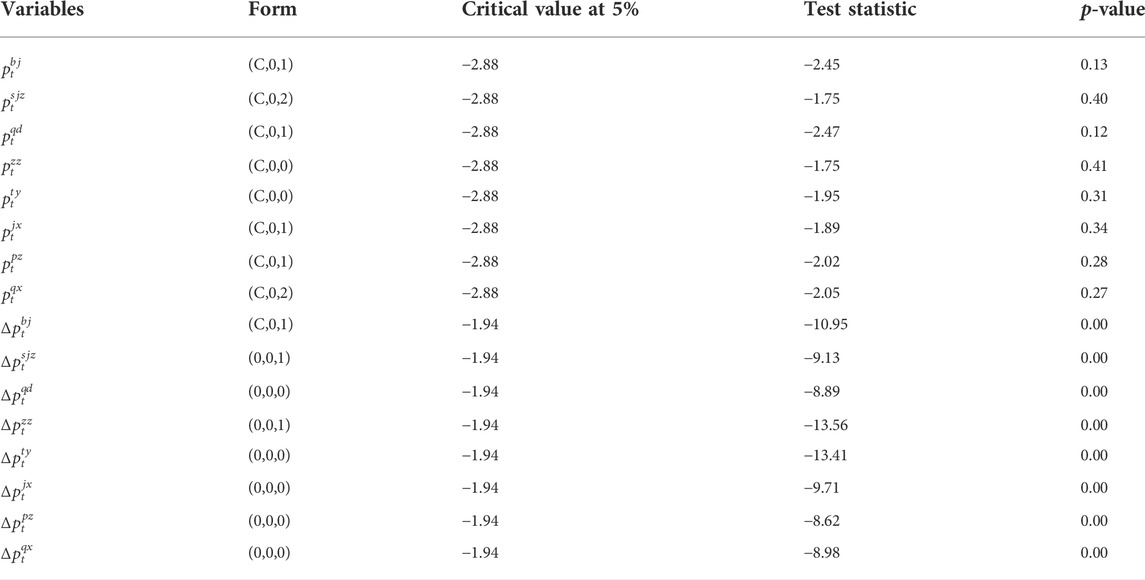
TABLE 2. Results of the ADF unit root test for price series.
After testing the series’ stationarity, we build a VAR model using the post-differential price series. We use AIC criterion to determine the optimal lag order and set the maximum lag time at 6. Table 3 displays the optimal lag order for several criteria, with the findings indicating that the 2-lags model fits best.
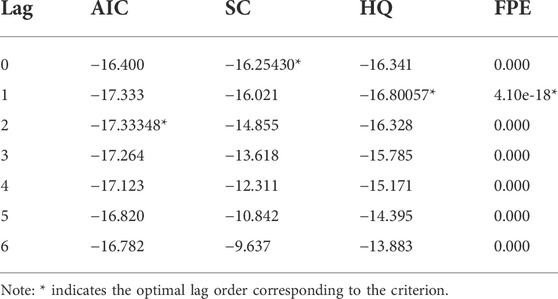
TABLE 3. Criterion of optimal lag order in model.
The VAR (2) model is constructed and estimated. Table 4 shows the results. The variable in the top row of the table represents the current period’s wholesale price for each location, which is assigned as the dependent variable in the VAR model. The values in each column represent the coefficients of the relevant varibles’ regression. For all equations, the p-value of the F-statistic is less than 0.05. It shows that the variables are statistically significant and can provide a better fit for each local price change.
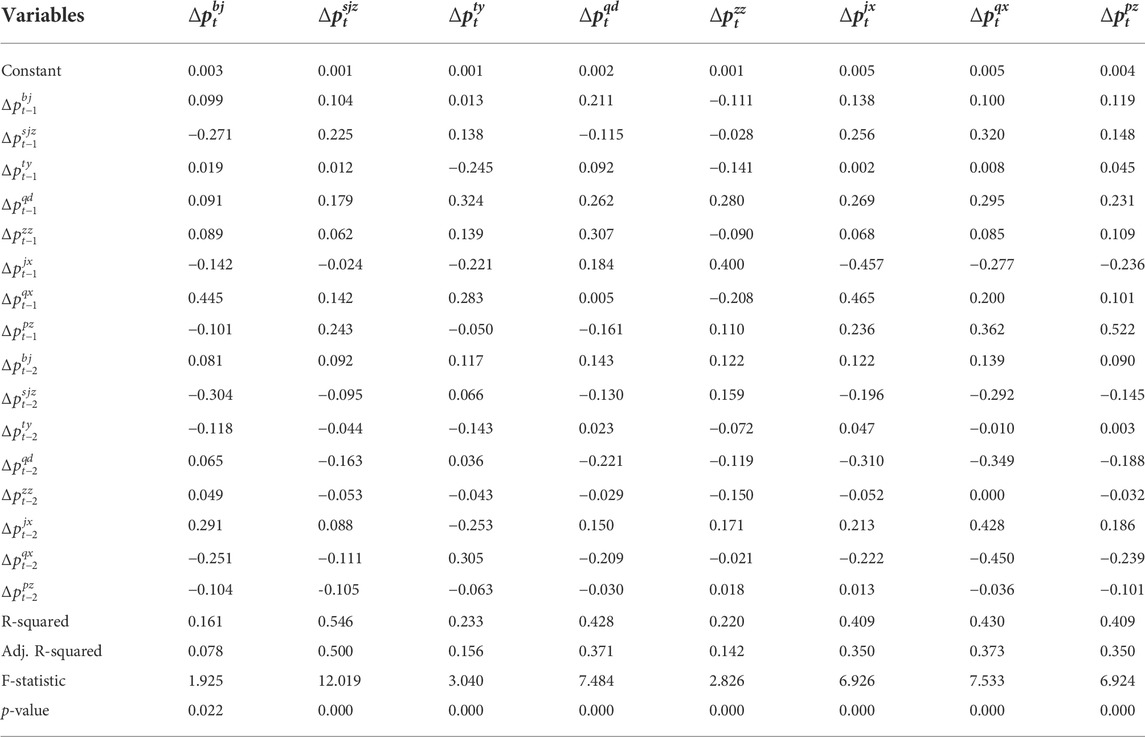
TABLE 4. Results of VAR model.
The partial Granger causality test requires the construction of the VAR model. According to Krishna [42], the partial Granger causality test statistic between two variables could be obtained by using regression residuals for each equation which can be derived using the VAR model. Table 5 shows the results of the partial Granger causality test for garlic. The values in the table represent the partial Granger causality test value for the effect of the row price on the column price. If the value is bigger than zero, the column price with change following the row price. Figure 2 describes the direction of garlic price transmission according to the magnitude of the test statistic used.
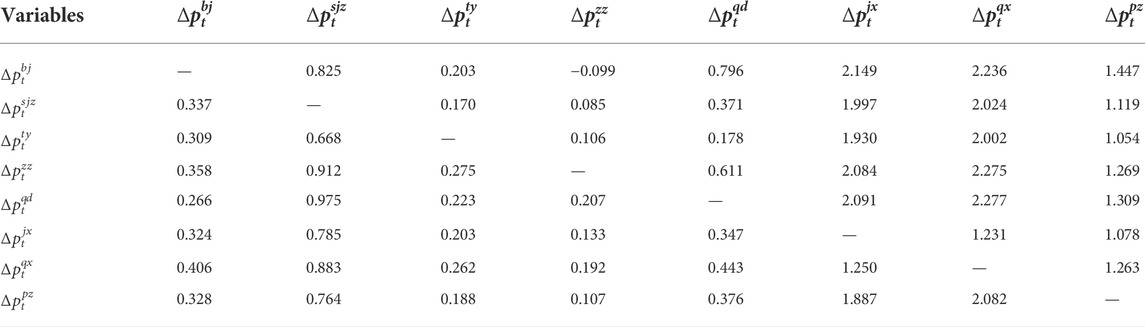
TABLE 5. Values of the partial Granger causality test statistics for garlic prices.
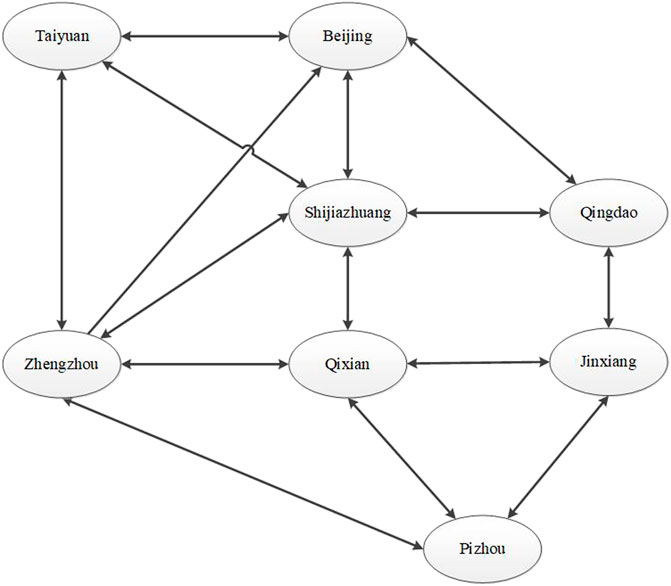
FIGURE 2. Directions of garlic price transmission.
Using the stationarity test and the VAR model, we conducted a partial Granger causality test on wholesale price series in the major garlic-producing regions and the important northern cities in China from 2015 to 2019. The primary conclusions are as follows.
The Northern garlic market in China has been highly consolidated. Garlic wholesale prices are all causally connected between the major producing areas and the major consumption areas. Changes in the wholesale price of garlic in one place can induce price changes in another, which we think is resulted from the improvement of transportation and communication conditions in China in recent years. The ever-improving highway network has linked the main garlic production areas with major consumption areas, which promotes the spread of garlic circulation.
The wholesale prices of garlic show the characteristic of bidirectional transmission. The wholesale prices in producing areas could affect that of the consuming areas, and vice versa. The causal effect of wholesale price in important consuming areas on the main producing areas and the causal effect among the main producing areas are more significant, just as the value of the partial Granger causality test statistic shows. Only one unidirectional connection is the transmission from Zhengzhou to Beijing, which means that the price changes in Zhengzhou could affect the price in Beijing, but not vice versa.
Also, there are some limitations in our analysis. The first shortcoming is that we only choose some big producing areas and consuming cities in northern China. Price transmission exists in every city and the linkages should be much more complex. Secondly, we only consider spatial price transmission among cities and do not examine vertical price transmission along supply chains. Vertical and horizontal price transmissions may interact and lead to various results. Besides, just as Von Cramon-Taubadel and Meyer’s view [19], the method should be considered with caution. People using different methods may get contrary outcomes. The method innovation is very important when studying price transmission.
The original contributions presented in the study are included in the article/Supplementary Material, further inquiries can be directed to the corresponding authors.
Conceptualization, MZ and CS; Data curation, CS and LC; Formal analysis, LC and XW; Methodology, CS, LC, and JZ; Validation, LC, XW, and SH; Writing–MZ and LC; draft, MZ and JZ; Writing–review and editing, SH and JZ.
This research was funded by National Natural Science Foundation, Grant Number 71703159 and Central Public interest Scientific Institution Basal Research Fund of China, Grant Number JBYW-AII-2022-13 and JBYW-AII-2022-40.
The authors declare that the research was conducted in the absence of any commercial or financial relationships that could be construed as a potential conflict of interest.
All claims expressed in this article are solely those of the authors and do not necessarily represent those of their affiliated organizations, or those of the publisher, the editors and the reviewers. Any product that may be evaluated in this article, or claim that may be made by its manufacturer, is not guaranteed or endorsed by the publisher.
The Supplementary Material for this article can be found online at: https://www.frontiersin.org/articles/10.3389/fphy.2022.1019643/full#supplementary-material
1. Peltzman S. Prices rise faster than they fall. J Polit Economy (2000) 108:466–502. doi:10.1086/262126
2. Singh K, Dey MM, Laowapong A, Bastola U. Price transmission in Thai aquaculture product markets: An analysis along value chain and across species. null (2015) 19:51–81. doi:10.1080/13657305.2015.994236
3. Cramon-Taubadel SV. Estimating asymmetric price transmission with the error correction representation: An application to the German pork market. Eur Rev Agric Econ (1998) 25:1–18. doi:10.1093/erae/25.1.1
4. Goodwin B K, Holt M T. Price transmission and asymmetric adjustment in the U.S. Beef sector. Am J Agric Econ (1999) 81:630–7. doi:10.2307/1244026
5. Abdulai A. Spatial price transmission and asymmetry in the Ghanaian maize market. J Develop Econ (2000) 63:327–49. doi:10.1016/S0304-3878(00)00115-2
6. Fousekis P, Katrakilidis C, Trachanas E. Vertical price transmission in the US beef sector: Evidence from the nonlinear ARDL model. Econ Model (2016) 52:499–506. doi:10.1016/j.econmod.2015.09.030
7. Thong NT, Ankamah-Yeboah I, Bronnmann J, Nielsen M, Roth E, Schulze-Ehlers B. Price transmission in the pangasius value chain from Vietnam to Germany. Aquacult Rep (2020) 16:100266. doi:10.1016/j.aqrep.2019.100266
8. Xu S, Li Z, Cui L, Dong X, Kong F, Li G. Price transmission in China’s swine industry with an application of MCM. J Integr Agric (2012) 11:2097–106. doi:10.1016/S2095-3119(12)60468-7
9. Bekkers E, Brockmeier M, Francois J, Yang F Local Food Prices and International Price Transmission. World Development (2017). Amsterdam, 96. p. 216–30. doi:10.1016/j.worlddev.2017.03.008
10. Luo P, Tanaka T. Food import dependency and national food security: A price transmission analysis for the wheat sector. Foods (2021) 10:1715. doi:10.3390/foods10081715
11. Kim H, Ward R W. Price transmission across the U.S. food distribution system. Food Policy (2013) 41:226–36. doi:10.1016/j.foodpol.2013.05.006
12. Xiong F, Shen W, Chen H, Pan S, Wang X, Yan Z. Exploiting implicit influence from information propagation for social recommendation. IEEE Trans Cybernetics (2020) 50:4186–99. doi:10.1109/TCYB.2019.2939390
13. Lloyd T. Forty years of price transmission research in the food industry: Insights, challenges and prospects. J Agric Econ (2017) 68:3–21. doi:10.1111/1477-9552.12205
14. Baquedano FG, Liefert WM. Market integration and price transmission in consumer markets of developing countries. Food Policy (2014) 44:103–14. doi:10.1016/j.foodpol.2013.11.001
15. Bakucs Z, Fałkowski J, Fertő I. Does market structure influence price transmission in the agro-food sector? A meta-analysis perspective. J Agric Econ (2014) 65:1–25. doi:10.1111/1477-9552.12042
16. Mengel C, von Cramon-Taubadel S. Distance and border effects on price transmission: A meta-analysis. J Agric Econ (2016) 67:255–71. doi:10.1111/1477-9552.12145
17. von Cramon-Taubadel S, Goodwin BK. Price transmission in agricultural markets. Annu Rev Resource Econ (2021) 13:65–84. doi:10.1146/annurev-resource-100518-093938
18. Weldegebriel HT. Imperfect price transmission: Is market power really to blame? J Agric Econ (2004) 55:101–14. doi:10.1111/j.1477-9552.2004.tb00082.x
19. Von Cramon-Taubadel S, Meyer J. Asymmetric price transmission: Fact or artefact? (2000).Citeseer
20. Meyer J, Cramon-Taubadel S. Asymmetric price transmission: A survey. J Agric Econ (2004) 55:581–611. doi:10.1111/j.1477-9552.2004.tb00116.x
21. Xiong F, Wang X, Pan S, Yang H, Wang H, Zhang C. Social recommendation with evolutionary opinion dynamics. IEEE Trans Syst Man, Cybernetics: Syst (2020) 50:3804–16. doi:10.1109/TSMC.2018.2854000
22. Li Z, Xiong F, Wang X, Chen H, Xiong X. Topological influence-aware recommendation on social networks. Complexity (2019) 2019:e6325654. doi:10.1155/2019/6325654
23. Zhu M, Chen H, Wang X, Wang Y, Shen C, Zhu C. Firms’ investment behaviours in temperature-controlled supply chain networks. Complexity (2021) 20211–1. doi:10.1155/2021/5359819
24. Kinnucan HW, Forker OD. Asymmetry in farm-retail price transmission for major dairy products. Am J Agric Econ (1987) 69:285–92. doi:10.2307/1242278
25. Sanjuán AI, Dawson PJ. Price transmission, BSE and structural breaks in the UK meat sector. Eur Rev Agric Econ (2003) 30:155–72. doi:10.1093/erae/30.2.155
26. Bakucs LZ, Fertõ I. Marketing margins and price transmission on the Hungarian pork meat market: Marketing Margins and Price Transmission. Agribusiness (2005) 21:273–86. doi:10.1002/agr.20047
27. Ihle R, von Cramon-Taubadel S, Zorya S, Zonya S. Markov-switching estimation of spatial maize price transmission processes between Tanzania and Kenya. Am J Agric Econ (2009) 91:1432–9.
28. Brümmer B, von Cramon-Taubadel S, Zorya S. The impact of market and policy instability on price transmission between wheat and flour in Ukraine. Eur Rev Agric Econ (2009) 36:203–30. doi:10.1093/erae/jbp021
29. Cudjoe G, Breisinger C, Diao X. Local impacts of a global crisis: Food price transmission, consumer welfare and poverty in Ghana. Food Policy (2010) 35:294–302. doi:10.1016/j.foodpol.2010.01.004
30. Santeramo FG. Price transmission in the European tomatoes and cauliflowers sectors: Price transmission in the EUROPEAN tomatoes and cauliflowers sectors. Agribusiness (2015) 31:399–413. doi:10.1002/agr.21421
31. Weldesenbet T. Asymmetric price transmission in the Slovak liquid milk market. Agric Econ (20132013) 59:512–24. doi:10.17221/150/2012-AGRICECON
32. Acosta A, Valdés A. Vertical price transmission of milk prices: Are small dairy producers efficiently integrated into markets?: Vertical price transmission of milk prices. Agribusiness (2014) 30:56–63. doi:10.1002/agr.21357
33. Hatzenbuehler PL, Abbott PC, Abdoulaye T. Price transmission in Nigerian food security crop markets. J Agric Econ (2017) 68:143–63. doi:10.1111/1477-9552.12169
34. Usman MA, Haile MG. Producer to retailer price transmission in cereal markets of Ethiopia. Food Sec (2017) 9:815–29. doi:10.1007/s12571-017-0692-0
35. Rezitis AN. Investigating price transmission in the Finnish dairy sector: An asymmetric NARDL approach. Empir Econ (2019) 57:861–900. doi:10.1007/s00181-018-1482-z
36. Dong X, Brown C, Waldron S, Zhang J. Asymmetric price transmission in the Chinese pork and pig market. BFJ (2018) 120:120–32. doi:10.1108/BFJ-02-2017-0056
37. Pham TAN, Meuwissen MPM, Le TC, Bosma RH, Verreth J, Lansink AO. Price transmission along the Vietnamese pangasius export chain. Aquaculture (2018) 493:416–23. doi:10.1016/j.aquaculture.2017.04.028
38. Ricci EC, Peri M, Baldi L. The effects of agricultural price instability on vertical price transmission: A study of the wheat chain in Italy. Agriculture (2019) 9:36. doi:10.3390/agriculture9020036
39. Lu H, Bai Y, Ren H, Campbell DE. Integrated emergy, energy and economic evaluation of rice and vegetable production systems in alluvial paddy fields: Implications for agricultural policy in China. J Environ Manage (2010) 91:2727–35. doi:10.1016/j.jenvman.2010.07.025
40. Wang B, Liu P, Zhang C, Wang J, Peng L. Prediction of garlic price based on ARIMA model. In: Cloud computing and security. p. 731–9. doi:10.1007/978-3-030-00006-6_66
41. Zhang X-X, Liu L, Su C-W, Tao R, Lobonţ O-R, Moldovan N-C. Bubbles in agricultural commodity markets of China. Complexity (2019) 2019:e2896479. doi:10.1155/2019/2896479
Keywords: spatial network, agricultural product price, vector autoregression, vegetable, garlic, price transmission
Citation: Shen C, Chi L, Wang X, Han S, Zhang J and Zhu M (2022) A spatial network analysis of vegetable prices based on a partial granger causality approach. Front. Phys. 10:1019643. doi: 10.3389/fphy.2022.1019643
Received: 15 August 2022; Accepted: 07 September 2022;
Published: 05 October 2022.
Edited by:
Xuzhen Zhu, Beijing University of Posts and Telecommunications (BUPT), ChinaReviewed by:
Yong Wang, Beijing Technology and Business University, ChinaCopyright © 2022 Shen, Chi, Wang, Han, Zhang and Zhu. This is an open-access article distributed under the terms of the Creative Commons Attribution License (CC BY). The use, distribution or reproduction in other forums is permitted, provided the original author(s) and the copyright owner(s) are credited and that the original publication in this journal is cited, in accordance with accepted academic practice. No use, distribution or reproduction is permitted which does not comply with these terms.
*Correspondence: Jing Zhang, emhhbmdqaW5nMDFAY2Fhcy5jbg==; Mengshuai Zhu, emh1bWVuZ3NodWFpQGNhYXMuY24=
†These authors have contributed equally to this work and share first authorship.
Disclaimer: All claims expressed in this article are solely those of the authors and do not necessarily represent those of their affiliated organizations, or those of the publisher, the editors and the reviewers. Any product that may be evaluated in this article or claim that may be made by its manufacturer is not guaranteed or endorsed by the publisher.
Research integrity at Frontiers
Learn more about the work of our research integrity team to safeguard the quality of each article we publish.