- School of Science, Beijing University of Posts and Telecommunications, Beijing, China
Social platforms make information propagation anywhere anytime. Large quantity data recording information spreading is available for further understanding the intrinsic mechanism within these stochastic processes. Based on the empirical spreading trees of tweets on Twitter, the heterogeneity of Twitter users is explored, turning out the burstiness in the spreading process. A few super spreaders can significantly change the trends of information spreading. Moreover, an improved Hawkes process is designed in this study to better investigate users’ heterogeneity during information propagation. Verification is provided for accuracy and stability of the improved Hawkes model in simulating propagation patterns revealed in empirical sequential data, predicting spreading trends, and predicting probability of information outbreaks. Our improved Hawkes model is an effective spreading model for detecting and quantifying super spreaders during the propagation process, which may shed light on the control and prediction of information spreading in social media.
Introduction
In modern society, information develops at a high speed. Online social networks such as Twitter, Micro-blog, and WeChat provide a free and fast access to all kinds of information, allowing all users to produce and propagate contents. As a result, information today is propagated regardless of any temporal and spatial factors and will have a great influence on individuals and society. Therefore, understanding the patterns and mechanisms within information propagation is of crucial importance nowadays. However, it is challenging to describe and investigate all ingredients during the spreading, such as network topology, features of information, and characteristics of various users.
Information propagation is a rich and active research area. Research perspectives mainly include three aspects: mining spreading patterns, predicting spreading popularity, and information traceability. The methodology is mainly based on a descriptive analysis and construction of models based on data. There are mainly three ways for modeling propagation: network topology–based, user state–based, and stochastic process–based models [1, 2].
The classical user state–based models are mainly borrowed from the infectious disease models aiming at modeling the epidemiological processes. The two common models are SIR and SIS [3, 4], where S stands for susceptibility, I for infection, and R for recovery. In both models, nodes in class S switch to class I with a fixed probability β. However, the SIS model and the SIR model assume that each node connects to another node with the same probability so that the connections within the population are made randomly. The relationship between nodes, that is, between users, is very important for information propagation, so the assumption made by the contagion model is unrealistic.
To investigate the influence of topology on information propagation, the Independent Cascade (IC) [5]or Linear Threshold (LT) [6] models are commonly used. These models utilize directed graphs on which there are two types of node states, namely, active and inactive and assume that node states can only be transferred from inactive to active states. When applied to analyze the information propagation process, a node transferring from an inactive state to an active state indicates that the user node has propagated information and can propagate information to surrounding users. The model based on network topology has some shortcomings. One is that the weights between nodes in the model are usually assumed to be the same or identically distributed values, but the relationship between users in the actual situation is difficult to be described uniformly, which is the same as the shortcoming of the contagion model. The second is that it obtains the static structure at a certain moment, which cannot keep up with the rapid changes of information propagation, so the timeliness of the model is insufficient.
The Hawkes process, first defined by Hawkes, is a class of point processes whose intensity depends on the history of the process [7]. It has been widely used in recent years to model earthquakes, terrorist attacks, finance, and so forth. [8, 9, 10, 11, 12]. They are ideal models to describe information cascades because each new retweet of a certain piece of tweet not only increases its cumulative retweet count by one but also gains new followers who may further retweet the tweet. In comparison with the aforementioned topology-based and user state–based models, the Hawkes process makes up for the shortcomings of the aforementioned models by not making assumptions about user relationships and by obtaining the complete tweet propagation state.
Research on spreading patterns, prediction of spreading trends, and information traceability by the Hawkes process has been fruitful in the analysis. However, there are still some limitations in the research. One of the most noteworthy is the phenomenon of information bursts, which is the main reason for the significant impact of information propagation on individuals and society. Therefore, the causes of the burst phenomenon, its fitting, and prediction need to be urgently considered and solved.
Based on Hawkes processes, this study provides an empirical analysis and modeling of information propagation and the exploration and analysis of the information burst phenomenon. In terms of empirical analysis, we analyze the spreading process from micro to macro based on real spreading data, obtain the emergence of the information propagation process, and focus on the heterogeneity of spreading users. To better portray the burst of the spreading process, an improved Hawkes model is constructed to simulate and predict the development trend and burst phenomenon of the information spreading process, to restore the real spreading process.
Characterization of the propagation process
In this section, the dataset used in this study is described first, and then the characteristics within the empirical propagation process from micro to macro are illustrated and ended up with well-founded reasoning of peaks in the propagation sequence, which is the inspiration of our improved Hawkes processes.
Data description and processing
The data in our study is based on a set of 4626 tweets on Twitter in 2015 and 2016, with their complete retweet trees. Each retweet item includes tweet ID, ID of the retweeted, ID of the retweeter, posting time, and retweeting time, where the posting time refers to the time when the retweeters retweeted the tweet.
Tweets with at least 300 retweets are picked for further analysis and modeling to obtain a sufficient amount of data to study the propagation and to eliminate the noise in the data. Finally, 150 tweets are selected for exploratory analysis, and four of them are chosen as representative tweets for illustration and visualization.
User heterogeneity analysis
The whole process of information propagation is formed by users’ secondary transmission on social platforms. Therefore, the features of different users greatly affect the propagation process. The influence of a certain user can be expressed by the speed and range of information propagation stimulated. Highly influential users can make the content, read, and re-post fast and vast; therefore, the information is highly propagated. In topology-based models, the degree centrality, the proportion of users who are directly connected to the user node, is widely used to measure the average influence of an individual on his/her friends [13].
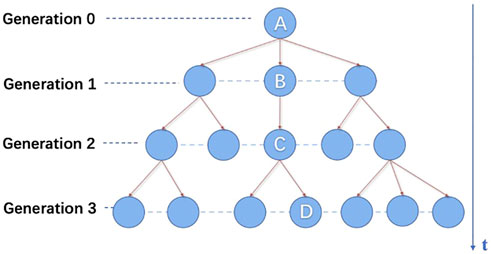
The retweeting relationship is illustrated in Figure 1. User A created the origin tweet. Then it was retweeted by User A’s direct followers, User B is one of them, as shown in Figure 1. User C retweeted the content directly after User B and so forth.
Based on the characteristics of our dataset, the influence of a user is measured by the number of times he or she directly retweeted. If User B retweets User A directly, it means that User A and User B are connected on the social platform, that is, User B is a follower of User A or they follow each other. If User A’s influence is high, more users will see that A retweeted a tweet and will retweet this tweet with relatively high probability, resulting in more direct retweets of User A’s tweet.
The number of time that each user’s tweet was directly retweeted is analyzed to investigate users’ influence. Figure 2 shows the distribution of the number of time users’s tweets were directly retweeted, indicating that the users’ influence is highly skewed distributed, where 99% of the users’s tweets were directly retweeted less than 100 times. The inset figure shows the distribution in the log-log scale, and the fitting line for the tail has slope −0.3664 and R2 = 0.8853, respectively. The straight line fitted in the log-log scale provides the power law tail of user influence in a linear scale. The power–law distribution is highly uneven, that is, the scale of direct retweets varies widely, meaning most direct retweets are small and a few are quite large. Therefore, the fitted straight line indicates that there is significant variation in user influence during the dissemination process, with most of the users having low influence and a few users having high influence, and users being heterogeneous. Moreover, as shown in Table 1, 80% of the users’ tweets were directly retweeted only twice. However, there are a few users who get many retweets, even up to 2000. Therefore, there are a few “super spreaders” with great influence in the spreading process, and their influence is much higher than that of ordinary users, showing high heterogeneity among spreaders.
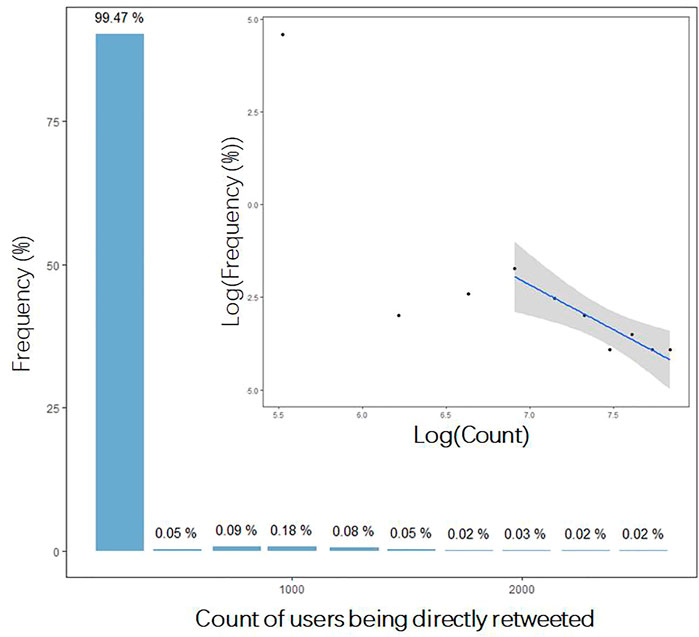
FIGURE 2. Distribution of the count of users being directly retweeted. The inserted is the distribution in log-log scale. The fitted line is log(frequency) = 6.256−0.3664*log(count), with R2 = 0.8853.
Peak analysis
Due to various influence factors, the sequential data of information propagation shows different characteristic patterns. Yasuko et al. investigated the rise and fall patterns of information propagation through clustering [14]. Inspired by their results, four representative time sequences are selected from our sequential data. Figure 3 shows the four propagation sequences of information (a), (b), (c), and (d).
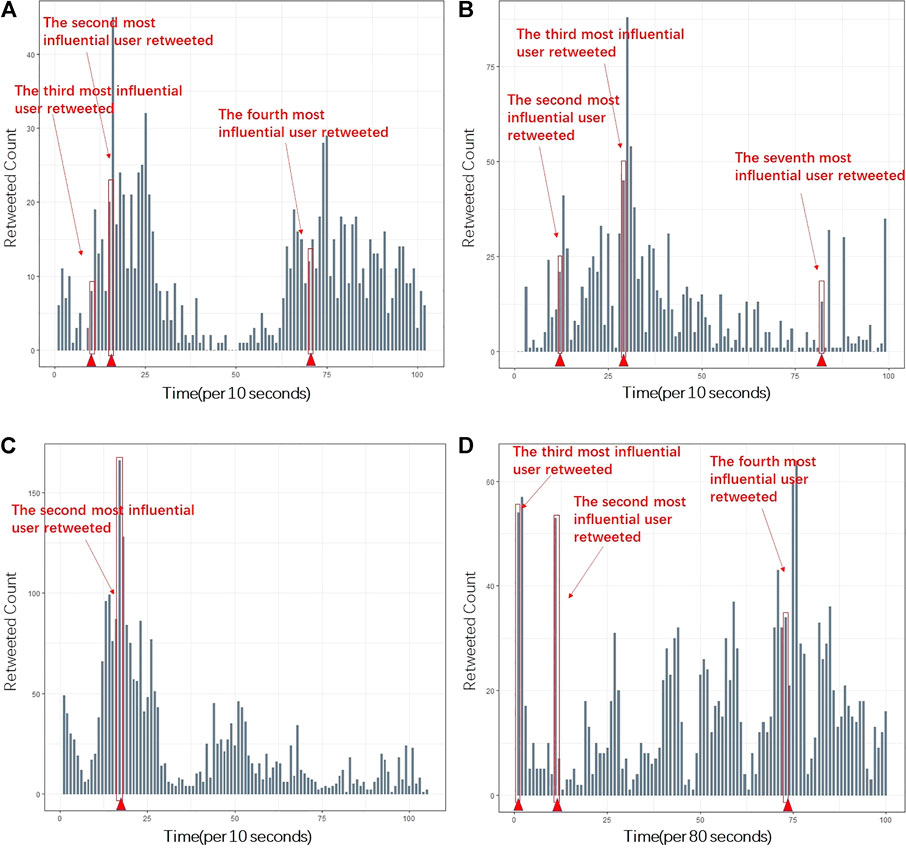
FIGURE 3. Four representative sequences of tweets propagation with top super spreaders marked. Panel (A), (B), (C), and (D) corresponds to tweet (a), (b), (c), (d) respectively. Due to different total time lengths of the tweets under consideration, the unit of the horizontal axes in A, B, C, and D are 10 s, 10 s, 10 s, and 80 s, respectively. (A) shows stable propagation and slight fluctuations. The relative silence period may be due to circadian. (B) illustrates a burst due to the third most influential user. (C) is similar to (B) with only one burst appearing at early stage of the transmission. (D) consists of multiple bursts, which may appear at any stage during the spreading.
The peaks within one sequence are significant for the overall trend and hotness of information propagation. Reasons leading to the peaks in the information propagation sequence come from the heterogeneity of users’ influence. In Figure 3, top influential users are labeled referring to the time they retweeted the tweet, which is at or right before the time intervals bursts appeared. Therefore, the posting or retweeting of information by high-influential users during the propagation process can significantly impact the hotness and trend of the information, which is the main reason for a large fluctuation phenomenon within information propagation.
Modeling information propagation by Hawkes processes
In order to quantify the burstiness and further predict and control the propagation process, standard Hawkes processes are introduced and then improved in this section. We will describe how to build an information propagation model based on the Hawkes process, and introduce a Hawkes process simulation method and parameter estimation. Furthermore, the Hawkes model is improved according to the characteristics of real propagation data, and the steps of the improved Hawkes model to simulate the propagation process are given.
Model description
Information propagation is considered as a random process of users’ retweeting information. User’ retweeting is influenced by two factors. One is the background factor, that is, different content of information has different intensity of attraction to users. The other is the self-exciting effect, that is, if the retweet counts in the previous period is high, the popularity of the spread increases and users will see and retweet the tweet with a higher probability. Thus, information spreads as a random process whose intensity varies with time, and the intensity consists of background factors and self-exciting effects, which is in line with the Hawkes process.
We refer to the point process whose future evolution depends on its own history as the self-exciting point process, that is, the Hawkes process [7]. The Hawkes process can be defined in two ways: one by defining it as a marked Poisson cluster process, where the clusters are generated by a certain branching structure, and the other by using conditional intensity function. The conditional intensity is defined as shown in the following equation:
Here, the exponential kernel Hawkes process proposed by Hawkes is used to model the process [7]. Assume that
The parameter
Moreover, the branching structure in Figure 1 and the Hawkes process can be viewed as the duality of each other. They are both continuous time stochastic processes with non-negative integers as the state space. In the Hawkes process, each point may excite future point, as the retweeting events do. Therefore, the intensity at time t is defined in Eq. 1. Meanwhile, in the branching process, each retweet may cause further retweets, which can be regarded as its children.
Model simulation algorithm
There are two simulation methods for the Hawkes model: intensity-based methods and clustering-based methods [15]. Here, intensity methods for simulation are adopted.
The main idea of the simulation algorithm is to first initialize the intensity
Model parameters solving
There are two types of methods for estimating the parameters of the Hawkes model: kernel density method and maximum likelihood method. Here, the maximum likelihood estimation method is used to estimate the model parameters in this study [16].
For the Hawkes process with a trigger intensity function of
The maximum likelihood estimation of the parameters is obtained by solving the parameter values in Eq. 3 by finding the partial derivatives of
Improved Hawkes information propagation model
It is revealed that the overall pattern of the real information propagation process is consistent with the smooth Hawkes model, but the Hawkes model lacks consideration of peaks, resulting in some peaks in the propagation sequence that cannot be fitted by the smooth Hawkes model. Since peaks play a crucial role during the spreading process, the standard Hawkes model needs improvement to model high peaks, and then modeling the heterogeneity in the stochastic process.
It is found in Figure 3 that peaks are information bursts generated by high-influential users who have retweeted the tweet. Based on this, the propagation process is divided into two propagation sub-processes: one is the “burst” propagation process, which consists of the peak data that cannot be fitted by the smooth Hawkes process, and the other is the “smooth” propagation process, which consists of the remaining propagation data. The propagation process is the superposition of these two processes. The parameters of the sub-processes are estimated separately by the maximum likelihood estimation method, and then the simulated points are obtained by simulating the real propagation data. Finally, the fitted points are combined to obtain the fitted results. If the propagation process simulated after dividing the data is still unable to simulate the retweeting peak continue the process of “divide→ simulate→ combine→ check” until the highest point of the retweeting sequence can be simulated. The algorithm is listed in Algorithm 1, and the algorithm flow chart is shown in Figure 4
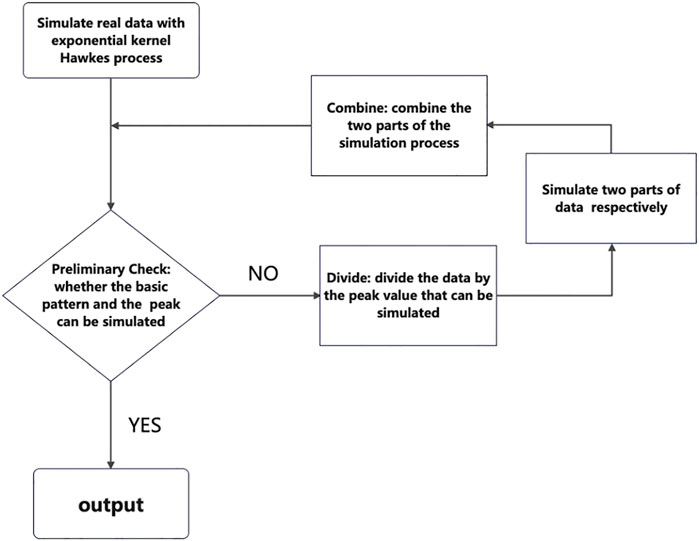
FIGURE 4. Flow chart of Algorithm 1.
The microscopic user heterogeneity characteristics in the real propagation process make the propagation process show the macroscopic characteristics of non-smooth peaks, which are not consistent with the smooth Hawkes model. Therefore, according to the characteristics of the real propagation process, we innovatively divide the propagation process and use the Hawkes process to simulate different parts of the propagation process separately to obtain the improved Hawkes process. Compared with the Hawkes process, in terms of data, the improved Hawkes process overcomes the drawback that the Hawkes process cannot fit the non-smooth peaks and makes the simulation process fit the real propagation process to the maximum extent. In a practical sense, it takes into account the heterogeneity of users and portrays the pattern characteristics of the propagation process, which is important for us to understand and grasp the intrinsic nature of the propagation process.
The improved Hawkes process that we propose has the following advantages in modeling the propagation process:
(1) Unified capability: Information propagation is a stochastic process whose intensity varies with time. Moreover, there are a few “super spreader” in the communication process, and their retweets can significantly change the trend and heat of information dissemination, so the real propagation process is non-stationary. By using the improved Hawkes process to build a model, the non-smoothness of the real communication process is depicted, and the stationary and bursty parts during propagation are simulated, respectively, resulting in more accurate description of the propagation process.
(2) Flexibility and scalability: The improved Hawkes process considers the random outbursts in the propagation process. Moreover, it simulates and predicts the varying density and outbursts through the four steps procedure: “divide→ simulate→ combine→ check”.
(3) Practicality: By controlling the participation of detected “super spreaders” in the propagation process, the dissemination of information can be facilitated or inhibited; the improved Hawkes model has a high prediction rate for the trend of the propagation process and the information outburst, which is conducive to the identification of information outburst, timely detection of abnormalities, and scientific intervention.
(4) Simplicity: It only needs three model parameters, and then the propagation process can be simulated and predicted.
Experimental results and analysis
The effectiveness of the improved Hawkes model is validated in this section. Moreover, the evaluation index is defined to test the effectiveness of our improved model. Finally, the prediction ability of the improved Hawkes model for the information burst phenomenon is discussed and compared with the standard one.
Algorithm 1. Improved Hawkes model simulation propagation process.
1. Input: input the time point of each retweet in the real propagation process:
2. Model the propagation process with an exponential kernel Hawkes process to obtain simulated event points:
3. Preliminary check simulation effect: check the current simulation situation, whether the basic pattern of the propagation process and the highest peak value can be simulated, if it fails, go to step 3, if it passes, go to step 6;
4. Divide data: If the current model does not simulate the mode and peak of the propagation process, the data will be divided by the peak that can be simulated, and the propagation will be divided into the superposition of two propagation processes
5. Simulate the propagation process respectively, and the parameters are estimated by maximum likelihood method for the divided data, and the simulation points are generated by model simulation
6. Combine process: Combine simulation points to generate propagation process
7. Output: Output the parameters of the model and the simulated propagation process.
Evaluation index
In order to analyze the improved Hawkes model and the simulation algorithm, an evaluation index of model fitting, APE (Absolute Percentage Error) is introduced in the SEISMIC model constructed by Zhao et al. as a metric to evaluate the fitting degree of the model to the final popularity count [18]. APE is defined as follows:
where R is the number of retweets, and Eq. 4 is the ratio of the absolute error of the final number of retweets to the true value, that is, the relative error of the number of retweets.
When simulating the propagation process, the most direct way to test the simulation effect is to consider the average intensity of propagation. Here. the error of the model simulation is defined according to the same pattern as APE, and the final retweet numbers are replaced by the average intensity of the propagation process for further accurate measurement of the simulation effect. The average intensity of the real propagation process is as follows:
The average intensity of the simulated propagation process is as follows:
Simulation error is defined as follows:
Error represents the error of the simulation, which is actually relative error of intensity. Here,
Model simulation experiment
The purpose of simulation experiments is to evaluate whether the improved Hawkes model can fit the real information propagation process and simulate different patterns of information propagation. Algorithm 1 is applied to simulate the four selected representative tweets, and Figure 5 shows the fitting results by the improved Hawkes model. Tweet (a) needs no division, and the peak of information can be simulated by Hawkes model. (b), (c) and (d) are divided once. Parameters for the four empirical sequences are shown in Table 2.
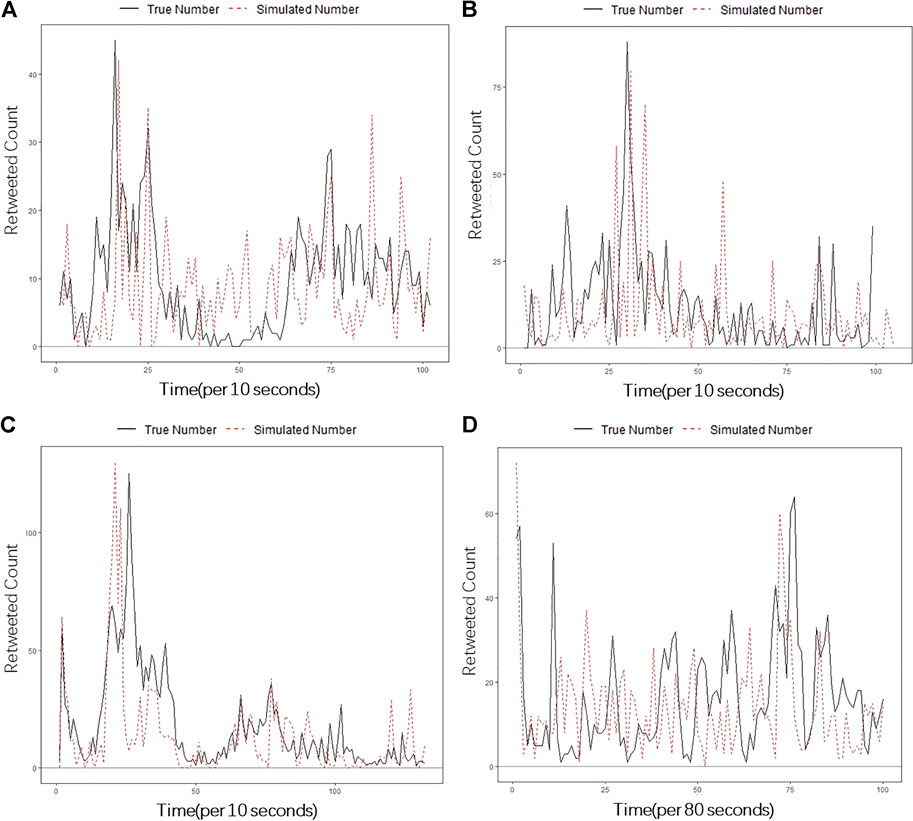
FIGURE 5. Fitting results for the four representative tweets by the improved Hawkes model. Panel (A), (B), (C), and (D) corresponds to the fitting results of tweet (a), (b), (c), (d) respectively.
The improved Hawkes model can better describe the overall trend and represent the fluctuations in the propagation process. In addition, our model can simulate the bursts of information propagation. (b), (c), and (d) in Figure 4 are the results of simulating with two sub-models after one division, that is, there are peaks in the information propagation process that cannot be fitted by standard Hawkes model. It can be seen that almost all the peaks appear during the propagation of (b), (c), and (d) are simulated by the improved Hawkes model, and the rising and falling patterns of the peaks can be well simulated.
Accuracy and stability of model simulation
For the model simulation results, it is described from two aspects of simulation accuracy and simulation stability. Simulation accuracy can be reflected by the numerical value of the simulation error. The smaller the error value is, the closer the simulated average propagation intensity is to the real average intensity, the more the simulated propagation process fits the real propagation process, the higher the simulation accuracy. The stability of the simulation can be described by the fluctuation range of the simulation error, the larger the fluctuation range of the error, the greater the difference in the simulation effect, the higher the instability of the simulation.
In order to measure the simulation effect of the improved Hawkes model and compare it with standard Hawkes model, 100 simulations were performed for tweets (a), (b), (c), and (d) based on standard Hawkes model and the improved Hawkes model, respectively, where (a) does not need to be divided and does not need the improved Hawkes. The simulation errors of the four tweets are calculated, and the error scatter plots (Figure 6) and box plots (Figure 7) of the four tweets are plotted to evaluate the simulation accuracy and simulation stability, and the dashed lines in Figure 6 are the mean error values.
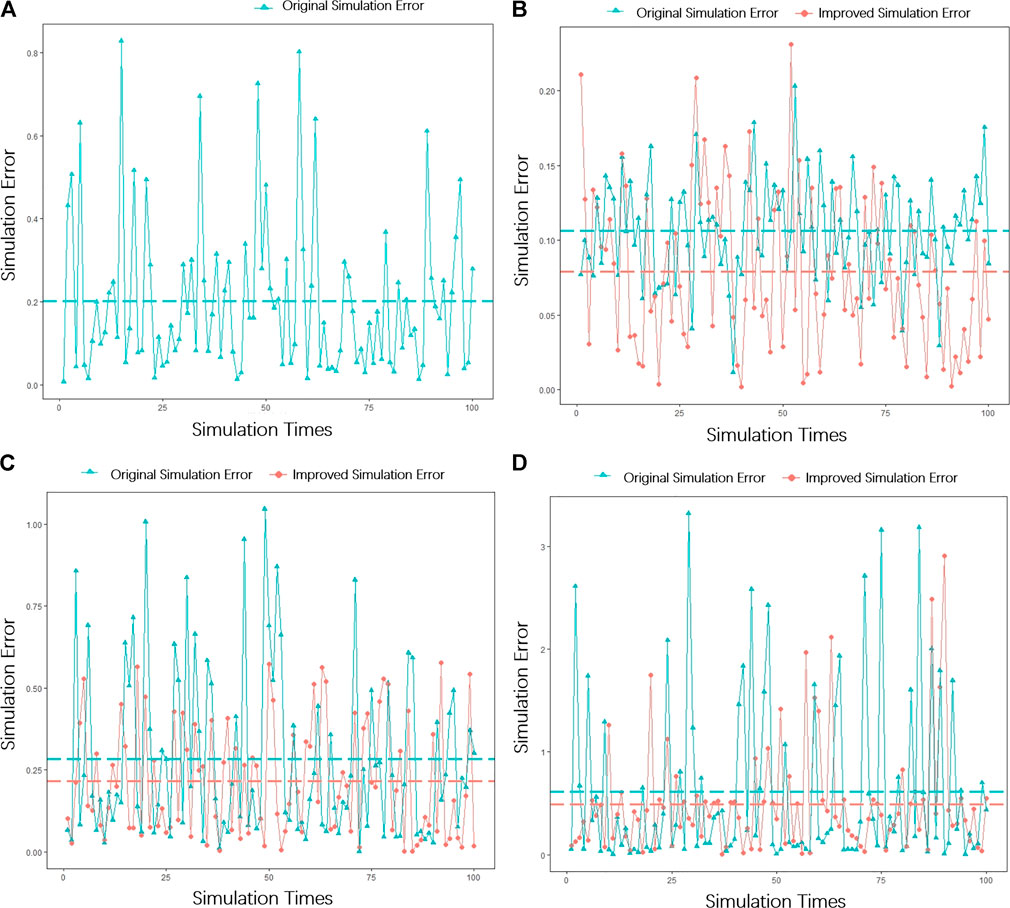
FIGURE 6. Scatter plot of simulation error. Panel (A), (B), (C), and (D) corresponds to the scatter plot of simulation error of tweet (a), (b), (c), (d) respectively.
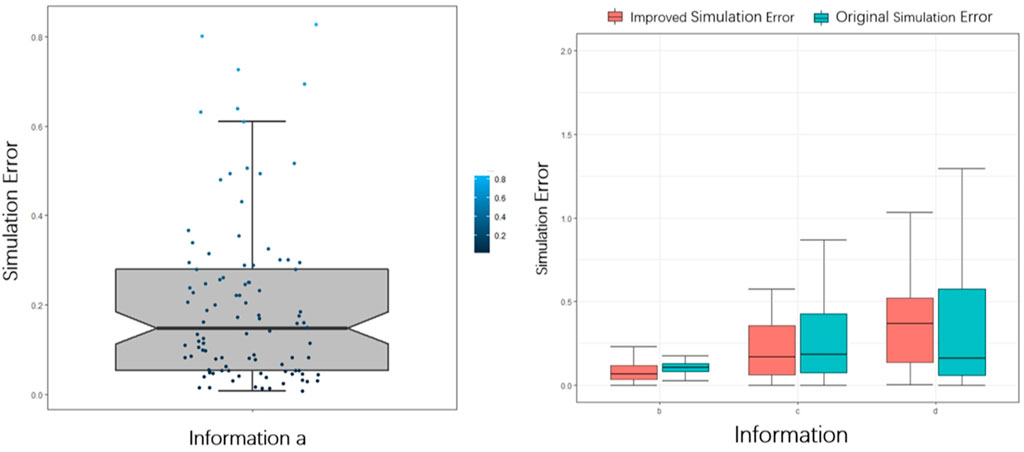
FIGURE 7. Box plots of simulation errors of tweet (a), (b), (c), and (d). The left figure corresponds to the box plot of simulation error of tweet (a), and the right figure corresponds to the box plot of simulation error of tweet (b), (c), (d) respectively. The distribution of the intensity error of tweet (a) simulated by the improved Hawkes model ranges from 0.1 to 0.3, with a mean value of about 0.2; the distribution of the simulation error of tweet (b) ranges from 0.1 to 0.2, with a mean value of about 0.1; the distribution of the simulation error of tweet (c) ranges from 0.1 to 0.4, with a mean value of about 0.26; for tweet (d), which has more burst peaks in the information propagation, the simulation error is enlarged, and it is mainly concentrated between 0.1 and 0.4, but the simulation error still maintains the mean value of 0.35. The stage on the left side of the vertical dashed line and the prediction stage on the right side.
From Figures 6, 7, it is shown that the simulation error of the improved Hawkes model is smaller, the simulated intensity is close to the real value, the fitting accuracy is higher, and the fluctuation range is smaller, so the simulation stability is higher. Moreover, the improved Hawkes model effectively improves the simulation effect and stability of the information propagation process with burst peaks, especially in the case with Tweet (d).
From the error analysis, it can be seen that the improved Hawkes model can simulate different information propagation processes with higher accuracy and stability, and for the information propagation process where the burst phenomenon occurs, the improved Hawkes model has a better simulation effect and better robustness compared with Hawkes model.
Model prediction experiments and discussion
In order to evaluate the prediction ability of the improved Hawkes model and test its application in real life, four information propagation processes are predicted. The data of the first 50 time intervals of the propagation process are used as the learning stage to learn the model parameters using the maximum likelihood estimation method, and the later time is used as the prediction stage to compare with the predicted propagation process generated by the model. Figure 8 gives the comparison of the true propagation pattern of the four tweets with the predicted results, with the learning.
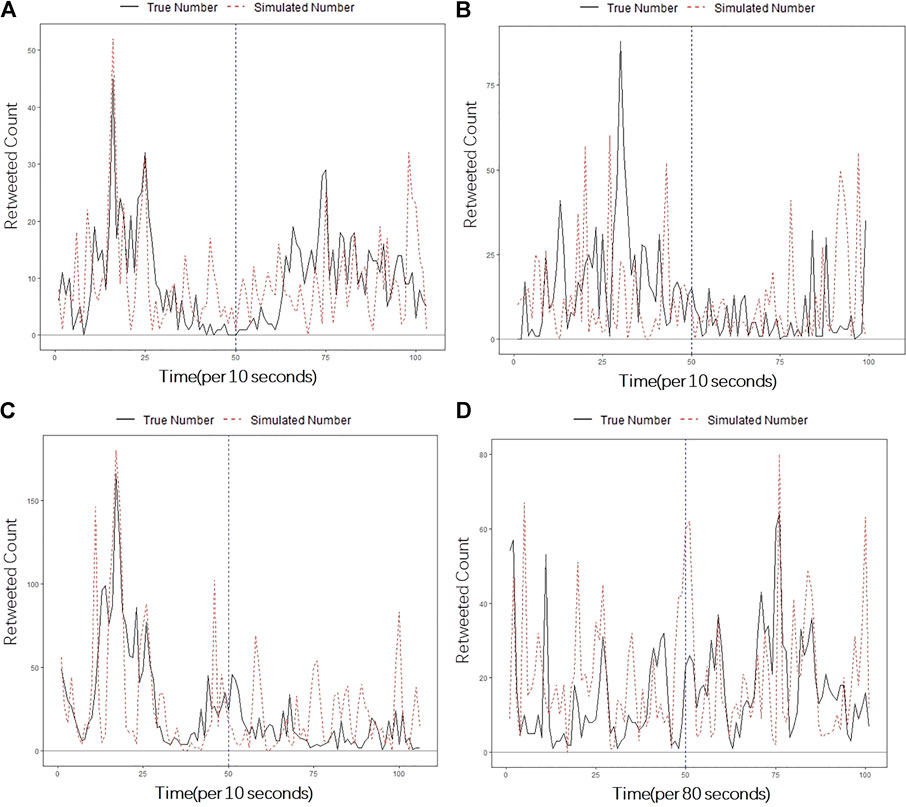
FIGURE 8. Prediction results of the real propagation model and the improved Hawkes model. Panel (A), (B), (C), and (D) corresponds to the prediction results of tweet (a), (b), (c), (d) respectively.
In addition, the difference between the improved Hawkes model and the Hawkes model lies in its simulation of peaks in the propagation sequence. In order to test the prediction ability of the improved Hawkes model for peaks, the occurrence of information peaks in the prediction stage and the number of occurrences are predicted. The 90 percentile of retweets count per unit time interval in the learning stage is taken as the information peak threshold, and the retweet count greater than this threshold is regarded as a peak. After testing, two of them, b and d, the real propagation process of information appeared in the prediction stage with information peaks, and Table 3 gives the results of 50 times of prediction peaks by Hawkes model and improved Hawkes model.
The improved Hawkes model can quickly learn and accurately predict the propagation trends and fluctuations. The information peaks and small fluctuations are well fitted. In the prediction stage, the improved Hawkes model predicted the subsequent development patterns of the tweet based on the learning results, in which the smooth fluctuations in the later part of (a) and (c) and the peaks appearing in the later part of (b) and (d) are predicted.
The improved Hawkes model can predict the peaks in the propagation process with higher accuracy compared to the Hawkes model. The results in Table 3 show that, compared with the standard Hawkes model, in terms of peak occurrence probability, the improved Hawkes model is more accurate in predicting peak occurrence if a peak occurs in the subsequent stages of information propagation. In terms of the count of peak occurrences, the improved Hawkes model predicted more peaks than the Hawkes model which means it is more sensitive in terms of early warning.
Conclusion and discussion
Aimed at mining the propagation law, this study starts from analyzing the real propagation data, gives the micro and macro characteristics of the propagation process, and then constructs the improved Hawkes model, focusing on the pattern and explosion phenomenon of the propagation process.
It is found that the direct forwarding relationship among users reflects the connection between users, and the number of users being directly forwarded reflects the influence of users, showing great heterogeneity among users. This is the main reason for the information explosion phenomenon is that people with high influence forward information. After selecting four representative tweets according to the classical propagation pattern, an improved Hawkes process is established to quantify the evolving patterns, which is an effective and quantitative propagation model that accurately and concisely describes the information propagation process.
However, regarding the construction of the propagation model, the exponential kernel adopted here is a simple case of point processes. In real life, the situation may not be homogeneous, and the intensity is not necessarily exponentially decaying, which needs further investigation.
Data availability statement
The original contributions presented in the study are included in the article/Supplementary Material; further inquiries can be directed to the corresponding author.
Author contributions
LZ carried out the concepts and design of this study. LW carried out the analysis of data, and interpretation of model and simulation. LW drafted the manuscript. All authors read and approved the final manuscript.
Funding
This work was jointly supported by the National Natural Science Foundation of China (Grant Nos. 11971074, 61671005).
Acknowledgments
The authors would like to thank the editors and reviewers for their enthusiastic help and constructive comments.
Conflict of interest
The authors declare that the research was conducted in the absence of any commercial or financial relationships that could be construed as a potential conflict of interest.
Publisher’s note
All claims expressed in this article are solely those of the authors and do not necessarily represent those of their affiliated organizations, or those of the publisher, the editors, and the reviewers. Any product that may be evaluated in this article, or claim that may be made by its manufacturer, is not guaranteed or endorsed by the publisher.
References
1. Xu H, Zhang Q. A review of epidemic dynamics on complex networks[J]. Inf Sci (2020) 38(10):159–67.
2. Hu CJ, Xu WW, Hu Y, Fang MZ, Liu F Review of information diffusion in online social networks[J]. J Electron Inf Tech (2017) 39(04):794–804.
5. Goldenberg J, Libai LE, Muller E. Talk of the network: A complex systems look at the underlying process of word-of-mouth[J]. Marketing Lett (2001) 12(3):211–23. doi:10.1023/a:1011122126881
6. Kempe D, Kleinberg J, Tardos E. Maximizing the spread of influence through a social network[J]. Theor Comput (2003)(4) 137–46.
7. Hawkes AG. Spectra of some self-exciting and mutually exciting point processes. Biometrika (1971) 58(1):83–90. doi:10.1093/biomet/58.1.83
8. Tita G, Ridgeway G. The impact of gang formation on local patterns of crime. J Res Crime Delinquency (2007) 44(2):208–37. doi:10.1177/0022427806298356
9. Lewis E, Mohler G, Brantingham PJ, Bertozzi AL Self-exciting point process models of insurgency in Iraq[J]. Security J (2010) 25(3):244–264.
10. Bacry E, Dayri K, Muzy JF. Non-parametric kernel estimation for symmetric Hawkes processes. Application to high frequency financial data[J]. The Eur Phys J B (2012) 85(5):1–12. doi:10.1140/epjb/e2012-21005-8
11. Chen F, Hall P. Inference for a nonstationary self-exciting point process with an application in ultra-high frequency financial data modeling. J Appl Probab (2013) 50(4):1006–24. doi:10.1239/jap/1389370096
12. Fox EW, Short MB, Schoenberg FP, Coronges KD, Bertozzi AL. Modeling E-mail networks and inferring leadership using self-exciting point processes. J Am Stat Assoc (2016) 111(514):564–84. doi:10.1080/01621459.2015.1135802
13. Wu XD, Li Y, Li L. Influence analysis of online social networks[J]. Chin J Comp (2014) 37(4):18.
14. Yasuko M, Yasushi S, Prakash AB. Rise and fall patterns of information diffusion: Model and Implications[C]. Proc 18th ACM SIGKDD Int Conf Knowledge Discov Data Mining (2012) 6–14. 10.1145/2339530.2339537 (Accessed January, 2022).
15. Dassios A, Zhao H. Exact simulation of Hawkes process with exponentially decaying intensity[J]. LSE Res Online Documents Econ (2013) 18(18):1–13. doi:10.1214/ecp.v18-2717
16. Ogata Y. On Lewis' simulation method for point processes. IEEE Trans Inform Theor (1981) 27(1):23–31. doi:10.1109/tit.1981.1056305
17. Rubin I. Regular point processes and their detection. IEEE Trans Inform Theor (1972) 18(5):547–57. doi:10.1109/tit.1972.1054897
18. Zhao Q, Erdogdu MA, He HY, Rajaraman A, Leskovec J SEISMIC: A self-exciting point process model for predicting tweet popularity[C]. Proc 21th ACM SIGKDD Int Conf Knowledge Discov Data Mining (2015) 1513–22. 10.1145/2783258.2783401 (Accessed December, 2021).
Keywords: Hawkes process, heterogeneity, information propagation, super-spreader, bursts
Citation: Wang L and Zhang L (2022) Hawkes processes for understanding heterogeneity in information propagation on Twitter. Front. Phys. 10:1019380. doi: 10.3389/fphy.2022.1019380
Received: 15 August 2022; Accepted: 16 September 2022;
Published: 24 October 2022.
Edited by:
Wei Wang, Chongqing Medical University, ChinaReviewed by:
Xiaoyue Zhang, Capital University of Economics and Business, ChinaGuocan Wu, Beijing Normal University, China
Zigang Chen, Chongqing University of Posts and Telecommunications, China
Copyright © 2022 Wang and Zhang. This is an open-access article distributed under the terms of the Creative Commons Attribution License (CC BY). The use, distribution or reproduction in other forums is permitted, provided the original author(s) and the copyright owner(s) are credited and that the original publication in this journal is cited, in accordance with accepted academic practice. No use, distribution or reproduction is permitted which does not comply with these terms.
*Correspondence: Lin Zhang, emhhbmdsaW4yMDExQGJ1cHQuZWR1LmNu
 Liwen Wang
 Lin Zhang