 Duo Chai
 Jiaze Du1
95% of researchers rate our articles as excellent or good
Learn more about the work of our research integrity team to safeguard the quality of each article we publish.
Find out more
ORIGINAL RESEARCH article
Front. Phys. , 30 September 2022
Sec. Social Physics
Volume 10 - 2022 | https://doi.org/10.3389/fphy.2022.1018993
This article is part of the Research Topic Network Mining and Propagation Dynamics Analysis View all 17 articles
In order to improve the city network mining method, the inter-cities’ connection strength, structure and density, and distribution patterns of city network in the Yangtze River Economic Belt of China have been empirically analyzed through the combined application of SNA method, “Dual-direction time distance” modified gravity model and ArcGIS geographic visualization method. The results show that the modified gravity model can better reveal the interaction differences between cities and reflect the current and potential economic, population and resource relations among cities. The city network density of this area has positively close relationship with the regional economic development level. The average value of degree centrality in the basin is high, but the difference between cities is obvious. The “agglomeration effect” of the central cities is significant, and the urban connections have an obvious cluster structure, showing an “M” shaped spatial distribution along the Yangtze River; The inner interaction strength of city network subgroups is high, but the connection between subgroups is low. The law of “downstream > midstream > upstream” also appears on the closeness centrality and betweenness centrality. In the future, it is essential to improve the integration and multi-level connections of urban agglomeration in the river basin and form a development pattern of “downstream driving - midstream transition - upstream connection”; strengthen the functions and connections of central and subcentral cities.
City network mining is an important interdisciplinary research field of physics, economics and geography [1, 2]. Under the joint promotion of economic globalization, regional integration, transportation technology and information technology, relying on certain geographical elements (large rivers, traffic trunk lines, and valleys along the mountains), cities of different scales, endowments and energy levels are interconnected [3–5]. A composite transportation network of highways, railways, water transport, air transport, intercity rail transit and three-dimensional transportation within the city has been gradually formed, and a complex information system has been built [6, 7]. The efficiency of residents’ commuting, material transportation and information transmission has been greatly improved, which has promoted the cross regional flow of all kinds of production factors. The interaction pattern of material, energy and wealth among cities has become more complex [6]. A functional organic city network with multi-level connection, multi-domain cooperation and multi-path arrival has been formed. The comprehensive value of city network development is an important indicator to identify national and regional development patterns [7]. The mature city network has also become the core growth pole that represents the country to participate in global competition and compete for high-end resources [8].
By 2021, China’s population reached 1.413 billion. The total number of cities reached 572, the urban resident population was 914.25 million, and the urbanization rate exceeded 64.7%; the urbanization rate of eight provinces exceeded 70%, the resident population of 91 cities reached more than five million, and the resident population of 18 cities exceeded 10 million. According to the great differences in location, functional positioning and economic development level among the east, central and west of China, the population flows from the west to the east, from the inland to the coastal, from water deficient areas to water rich areas, and from small cities to large cities. The resulting consumption, investment and resource development have affected the industrial agglomeration, diffusion and structural and layout adjustment, forming the urban functional circles, which center on megalopolis, connect several large cities outward, and then expand and connect the surrounding cities and towns [9]. These city networks, which are still evolving rapidly, provide rare observation samples for the research in this field.
For a long time, scholars have conducted systematic research on the methods of city network structure mining, connection strength measurement and core node identification [2, 10], and comprehensively used the research tools of complex networks, economics, management, sociology and regional science to analysis the formation mechanism, inter connection characteristics and influence mechanism of related factors of city network [3, 4], which helps us understand the laws of population migration and industrial distribution in the process of regional integration. It also guides the construction of regional transportation network, communication facilities and the spatial layout of population, industry and ecology in the planning [11]. However, most of the existing studies focus on depicting a certain aspect of regional traffic links, population migration, industrial transfer and division of labor, economic structure complementarity and administrative jurisdiction. The research on city network structure mining that from the comprehensive viewpoint of economic, social and transportation links and takes the possible differences of two-directions link into account is almost ignored [12].
Cities in the big river basin are of a special type. On the one hand, the resource sharing and ecological connection formed by water resources connect the cities in the basin into a community of interests [13]; on the other hand, the cities in the basin have spontaneously formed economic and industrial complexes under the organization of shipping links [14–16]. China’s Yangtze River is a core economic belt with rich natural resources, superior geographical conditions, dense population and industries. However, the problem of uncoordinated urban development and large economical gap between cities in this basin has not been fundamentally solved, the living standards gap of residents between cities has widened, and the destruction of the resources and environment in the basin has intensified. The root cause is the lack of overall planning for the development of the basin, coupled with the imperfect transportation and information network, resulting in the separation of urban division of labor and the contradiction of functional positioning, which leads to resource competition, excessive development and negative environmental externalities [17]. In 2016, the State Council of China approved the regional development strategy of “Yangtze River Economic Belt” (According to the development planning outline of the Yangtze River Economic Belt in 2016) [18]. The guiding ideology of river basin development changed from “development” to “protection”, forming a comprehensive transportation network of “three horizontality, six verticality, three networks and multiple points” [19]. The mining of city network in the basin is helpful to guide the formulation of development policies and the implementation of tasks.
The marginal contribution includes three aspects: First, the city network mining method is improved by the combined application of gravity model modified by dual-direction arrival time, social network analysis (SNA) calculation method and ArcGIS geographic visualization method. Second, the economic and population scale (potential connection strength) and commuting connection (actual connection degree) are integrated in the measurement of city network connection. So as to comprehensively reflect the economic, social and practical connection ability between cities. Third, the city network of 11 provinces in the Yangtze River is measured, providing guidance for formulating basin development plans and policies, optimizing the industrial and population layout of the basin, and improving the construction of inter town transportation facilities.
Social network analysis (SNA) believes that social connections can be quantified, so as to specify on social operation [20], which is widely used in sociology, psychology, geography and other fields [8, 12]. Early studies focused on explaining the principle of urban formation through social network relations and exploring the network structure and attributes within cities [21]. D. A. Smith and M. Timberlake 1995) designed the measurement technique of city network relationship such as infrastructure method and labor flow method [22]. Taylor [23] further proposed the Inter-locking Network Model and designed the measurement method of city network structure based on the data of urban business and economic relations. Taylor et al. [24] proposed the measurement methods of “absolute network relevance” and “relative network relevance”. Pfliege [25] believed that the existence and development of cities depend on the internal composition network and external contact network. An et al. [26] used analytic hierarchy process, spatial visualization and SNA to analyze the spatial connection and grid pattern Urban Agglomeration based on the comprehensive traffic information flow. Zachary P. Neal [27] built the interlocking world city network model (IWCNM) and proposed the decision network structure mining method and multi department network analysis method.
Because of the connection generated by natural resources and environment as well as the geographical proximity, cities in the big river basin are the hot objects of city network mining. On the basis of “flow space theory”, Wang et al. [28] comprehensively applied the city flow intensity model to build an abstract city association of factor flow. Gao et al. [29] and Li et al. [14] used data envelopment analysis and gravity model to analyze the characteristics of the population and economic connection of cities in the Yangtze River basin. Wang et al. [15] used ArcGIS software spatial analysis tools to calculate the distance and mutual distance between cities and rivers as an indicator to measure the link strength between cities.
Recently, city network structure analysis using SNA has gradually increased [30–32]. Wu et al. [33] studied the economic relations and integration trend of cities. Peng et al. [34] analyzed the evolution characteristics of urban agglomeration integration. In terms of city network structure identification, Zhao et al. [35] explored the influencing factors of city network spatial structure from the perspective of multi factor flow. Wu et al. [36], based on the big data of transportation and information, analyzed the outward connection network structure and influencing factors of the urban agglomeration by SNA, SSI, modularity and other methods. Sun et al. [37] analyzed the city network structure and spatial pattern based on the high-speed railway transport data, and identified the urban agglomeration characteristics by combining the geographic network and the topological network.
At present, the overall city network in the Yangtze River basin is less studied. Most studies only assess the strength of inter city Linkages Based on specific aspects such as urban transport links, population migration, industrial transfer, economic structure complementarity, and administrative and jurisdictional relations. Driven by the large-scale construction of transportation, logistics and information networks, the shortest arrival time between cities has become the best indicator to measure the strength of transportation links between cities in China, because it can reveal more realistic indicators such as economic and demographic links between cities. In addition, the exiting studies mistakenly believe that the arrival time of two directions between two cities should be the same, without distinguishing the “two-directions difference” of inter-city connections, and only one-way links are calculated. It is wise to treat all cities as the same individuals and calculate the connection strength in both directions.
The form of urban development is mainly manifested in the transformation of population and industry into cities [38–40]: Firstly, under the coordination of the central government, the limited land resources and various natural resources carried by the land are distributed administratively among the cities in the basin. The scale of the bearing capacity of land space determines the potential scale of residence, industry, consumption, commuting, infrastructure and ecological environment, and then determines the subordinate relationship of the functions of the cities in the basin. Secondly, the distribution of rights to water resources in the basin, including production and domestic water and the recycling of water resources, determines the initiation, maintenance and growth of urban production and living activities. Third, the cities in the basin have a strong ecological environment relationship. Any city will have strongly external effects on the natural resources development in the basin, therefore, it is essential to coordinate and cooperate with each other. To sum up, the spatial adjacency, the distribution of land resources, the sharing of water resources and the ecological externalities jointly determine the competition and cooperation relationship between the cities in the basin (Figure 1).
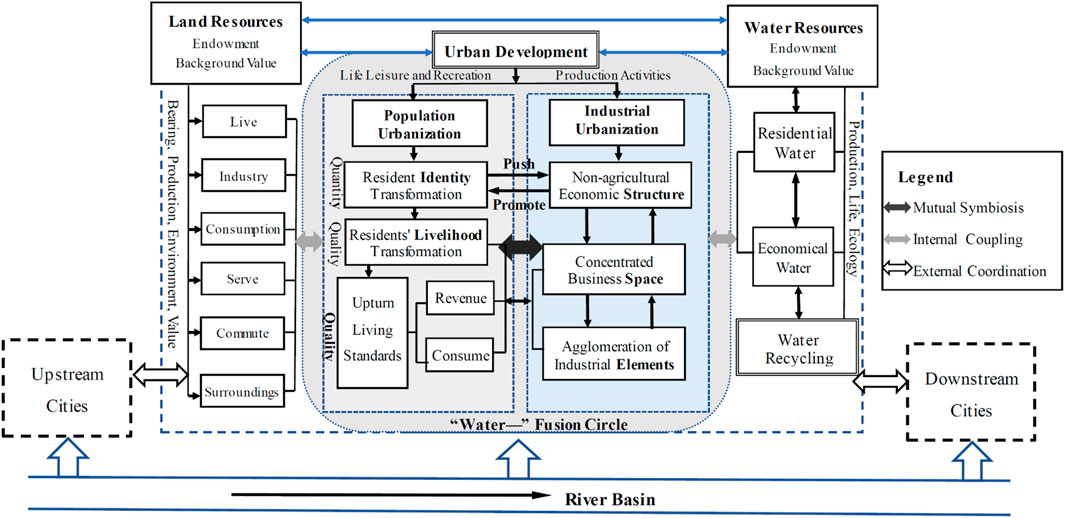
FIGURE 1. Resource and environment connection logic of basin cities.
Further, the links between cities are complex, and city network mining needs to find the main indicators that reflect the link strength. As shown in Figure 2, on the basis of resources and environment connection, the connection between cities in the basin is specifically manifested as measurable population flow, economic cooperation and traffic connection [40]. Therefore, theoretically, the strength of functional connections between the two cities should be determined by two aspects: first, if the economy and population scale of cities are relatively large, the potential for cooperation between them will be possibly greater [41]. The second is the transportation connection measured by commute time [42]. A developed transportation network can significantly improve the commuting efficiency between cities, thus facilitating the transformation of potential links and cooperation between cities into reality. Measuring the traffic links between cities can reflect comprehensive information: first, the flow and interaction of various resource elements between cities need the traffic network to provide media; Secondly, the construction of the transport network is also based on the past and present inter city cooperation needs. In other words, a large number of cooperation needs are the main driving force for the construction of the transport network. Third, transportation connections show the current situation and growing trend of economics, population size, and trade links among cities in the future. Fourth, traffic connections also reflect the policy intention of the state to combine cities and develop urban agglomerations.
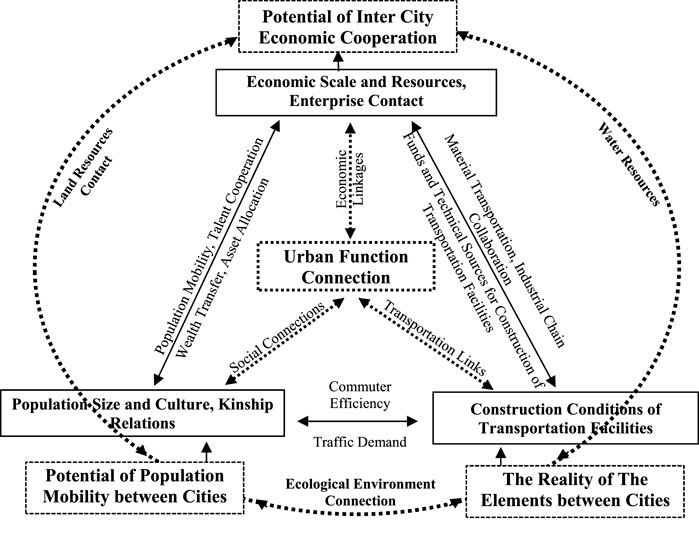
FIGURE 2. The logical relationship between economy, population, transportation and city network.
Most of the existing studies only describe the urban connection from a certain aspect such as population migration, enterprise cooperation, administrative jurisdiction or railway, highway and transportation facilities construction, while the economic, population and traffic connections are not taken into comprehensive consideration [43]. In addition, most of the urban traffic connections are calculated by geographical spatial distance, and it is believed that the strength of inter-city connections has an inverse proportion to the geographical distance [44]. The thinking paradigm of previous research simply regards the straight distance between two points on the plane as the convenience of arrival between cities, which is divorced from reality. This analysis method does not consider the blocking effect of terrain and various geographical elements on intercity commuting, nor the impact of human factors on intercity commuting efficiency. For example, the development of high-speed railway and aviation has had a subversive impact on commuting efficiency. More importantly, previous studies have not taken into account the differences in the mutual influence between cities, especially the differences in the two-way arrival time. At present, the infrastructure construction of intercity high-speed rail transit, expressway and civil aviation in the study area is relatively complete. In view of the two-way link difference between cities ignored in previous studies, this paper constructs a matrix based on the shortest arrival time of two directions between cities, integrates indicators such as urban population and GDP, and modifies the gravitational model. The purpose of this is to comprehensively measure the existing and potential population, trade, logistics and other links between cities and the potential for cooperation. On this basis, the structure and density of city functional network and the importance of different functional nodes are measured by using various indicators of SNA.
China’s Yangtze River, with a total length of 6,300 km, spans the three major regions of southwest, central and east China. It connects the three-river source ecological protection zone, Chengdu-Chongqing urban agglomeration, central Yunnan urban agglomeration, the middle reaches of the Yangtze River urban agglomeration and the Yangtze River Delta Urban Agglomeration. According to the Yangtze River Economic Belt regional developing plan, all 102 cities in 11 provinces are selected in this paper as research objects. The research scope is shown in Figure 3. Calculation from the data of 2021 China Statistical Yearbook, the total area accounted for 21.5% of China, the total population accounted for 43.0%, and the GDP accounted for 46.4%, while carried about 44.8% of the local fiscal revenue, 43.5% of the number of authorized patents, 45.7% of the foreign trade import and export volume, and 82.2% of foreign capital actually utilized of the whole nation, which is the most important urban cluster in China.
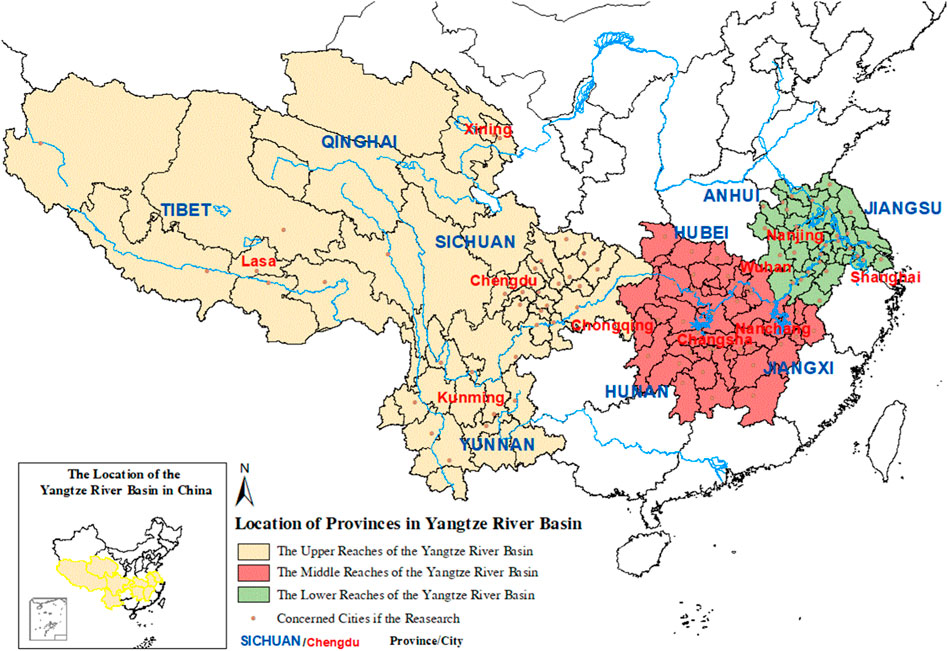
FIGURE 3. Research scope and Spatial distribution of relevant provinces.
Table 1 shows the source of the data used in this study. It should be noted that, the shortest arrival time distance represented is mainly determined by making a comparison of various means of transportation including ships, cars, trains between sample cities. However, airplane is not taken into account for four reasons: ① High-speed rail and expressway in Yangtze River Economic Belt is far more developed than air transport, with high-speed trains generally easily reaching 250–350 km/h, while there is a big gap in the development level of aviation industry in the basin. ② In China, the cost of flying is much higher than that of road and rail commuting. Most Chinese residents rarely choose to travel by air. ③ According to the estimation of the urban transport data of both passengers and freight of the Ministry of Transport of China, passenger and cargo of freight traffic in the Yangtze River Economic Belt merely accounts for about 2.64% of that on expressway and railway. ④ It is known that flights are very vulnerable to delays due to weather conditions, causing much uncertainty in commute time. Thus, air transport cannot be regarded as a common mode of transportation between cities in the basin.
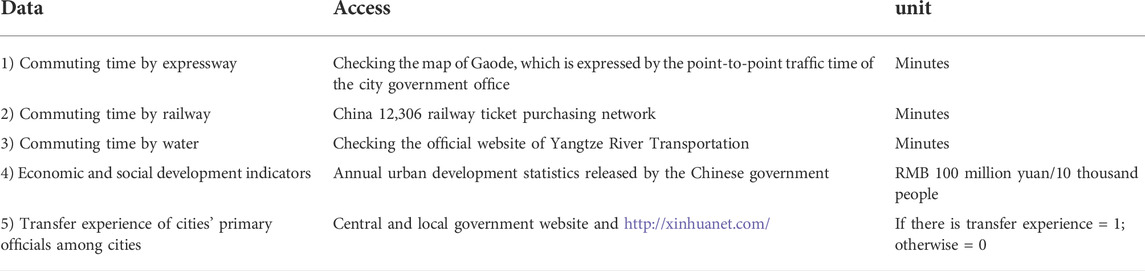
TABLE 1. Data source of this study.
The gravity model originally came from classical physics, as Formula (1), the gravitational force between two objects that can be regarded as particles is equal to the gravitational constant G multiplied by the mass of two objects (M×m) and then divided by R2, which represents the distance between two objects.
In Social Sciences, with the appropriate adjustment of definition of parameters and components, the basic form of gravity model can be transformed into a powerful model for analyzing and predicting spatial properties and interactions, which can be used in the research of spatial layout, spatial interaction (tourism, trade, population migration, etc.) and so on [45]. The modified gravity model is as Formula (2):
in which K represents the contact intensity; T represents the shortest time distance; G represents the total economic output value; p represents the population size. 10,302 and 5151pairs of links between cities have been identified. Formula (3) is further defined to find out the strongest and weakest relationship and location ranking among these cities, in which,
The research hypothesis of SNA is that the operation of the system is determined by the nature of nodes and the network relations. By analyzing the structure, individual attributes and overall attributes of the network, the overall function of the system can be improved from the aspects of improving the role of nodes and improving the network connection [46]. In this paper, SNA is applied to describe both the network distribution of the interconnection between cities and the importance of cities in the network. This paper will analyze from three aspects as followed.
1) Degree centrality The more external connections a node has, the more important it is in the network composition. The degree centrality can be expressed in matrix as formula (4):
X indicates whether there is a direct connection between node i and others. If there is a direct connection, it is one; if not, it is 0. Obviously, the larger the Cd (Nij) and Cd (Nji), the more important the node is in the network. When a certain weight is given to the node, a weighted undirected graph is obtained.
In this study, degree centrality is divided into “out-degree centrality” U’od(1) and “in-degree centrality” U’id(i), that are shown in Formula (6). This indicator reflects the importance of cities in the city network in terms of external and internal links.
2) Closeness centrality is shown following in Formula (7), d is the shortest arrival time between two cities. This indicator is mainly used to measure the proximity of a city to other cities from a simple space-time distance, reflecting whether the location of the city is easy to reach in the city network, that is, whether it is easy to contact other nodes.
In this study, closeness centrality is also divided into “out-closeness centrality” C’oc and “in-closeness centrality” C’ic, which are shown following in Formula (8), in which, d(i,j) is the shortest single-way arrival time between cities, respectively. These two indicators measure the proximity of one city to other cities (the ease of contact) and the proximity of other cities to this city (the ease of contact) in the city network.
3) Betweenness centrality is shown following in Formula (9), in which, C’b(1) represents betweenness centrality. G is a value calculating the number of shortest paths for one city contacting others. This indicator reflects the importance of a city as a “connecting transit station” to communicate with other nodes and as a functional exchange medium in the city network.
The network density reflects the city network development level. High network density means cities in the region are closely connected, and the city network seems to be mature. Formula (10) shows the network density calculating method, in which, D is the network density; m means the exact number of connections among cities in research scope, and n means the total number of samples (cities in the research scope).
In the study of city networks, cities usually form clusters because of their close and direct links, that is “internal cohesive subgroups.” Cohesive subgroup analysis can generally deeply analyze the city networks distribution structure and classify cities with the same characteristics [43, 44]. In order to figure out the cohesive subgroups of the city network which is in the research area, a kind of network analysis software named UCINET (version6.5) has been used in this research.
China is a unitary country, which implements the governance system of “centralized leadership by the central government—authorization to local governments to govern all regions”. Through the performance evaluation, selection and promotion system, local officials are encouraged to improve work efficiency, innovate policies, compete for development resources and strengthen urban construction. Among the constituent factors of China’s city network, the factor of local leadership is very special. The policies and efforts of local officials will greatly affect the local economic and social development [47]. First, since the reform and opening-up, Chinese local officials have taken the expansion of opening-up as an important means of economic development. Attracting foreign and domestic funds and expanding regional cooperation often rely on the private social relations of local officials, mainly to cooperate with their hometown or places where they have served [48]. On the other hand, China often transfers officials with excellent performance from developed cities to less developed provinces, makes more scientific development plans and policies for less developed cities, and implements more efficient and powerful management behaviors. More importantly, with the help of the interpersonal relations and enterprise cooperation experience accumulated by excellent officials in developed provinces and cities, cooperation between cities and realization of the complementary resource advantages between cities can be established. Therefore, the transfer of officials between cities is also an important factor to promote the formation of city networks. Although the transfer of officials among cities in the Yangtze River Basin has not yet formed a large-scale network, which is difficult to be directly included in the gravity model and SNA, this study takes the transfer of city officials as a supplementary study to further reveal the closeness of “political cooperation” and the potential social connection potential between cities.
Calculation Formulas 2 and 3 of the improved gravity model are used to calculate the Dual-direction connection strength between cities, and then the map of the Dual-direction connection strength between cities is drawn with the aid of Arc GIS10.2 software. Figure 4 shows the larger connection strength value F1 in each pair of urban connections, and Figure 5 shows the smaller connection strength value F2 in each pair of urban connections. In order to make the illustration clearer, Figure 4 and Figure 5 simply show the links with urban contact strength values which are larger than 2000 million × 10,000 people/minute2.

FIGURE 4. City contact strength max-value distribution in the research area.
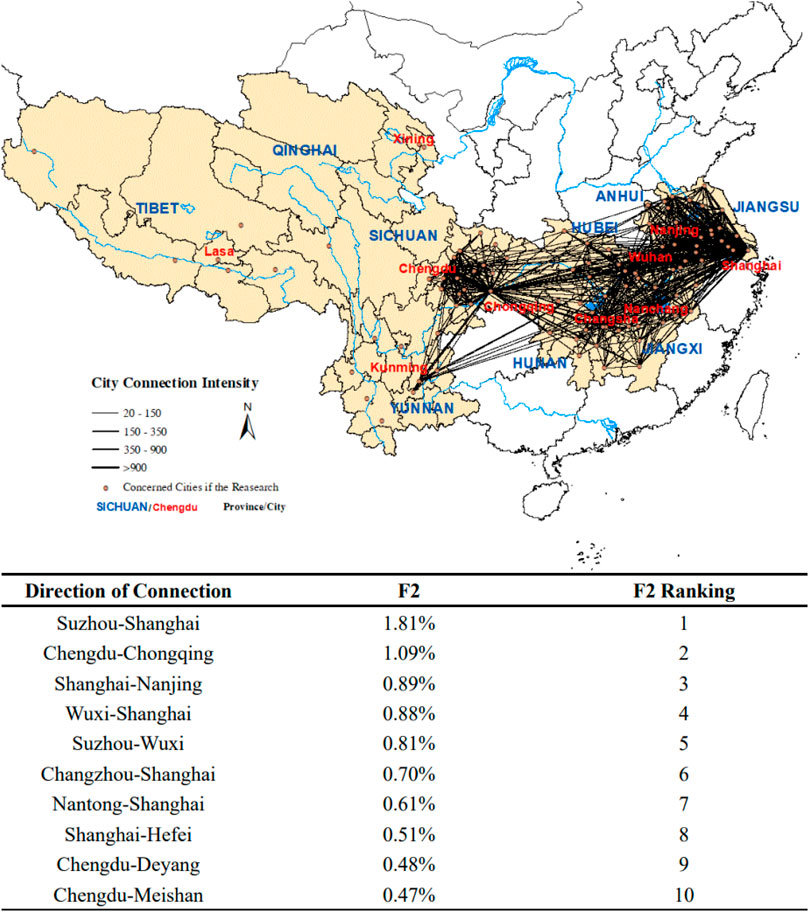
FIGURE 5. City contact strength min-value distribution in the research area.
Table 2 shows the 60 pairs of city relations with the highest connection strength and their reverse city relations among the 5,151 pairs of city links between cities:
TABLE 2. TOP 60 of inter-city contact strength value in the research area.
First, the connections between the cities are mostly of little difference in strength (in both directions), indicating that most cities are of an equal relationship between each other of mutual benefit and reciprocity. Almost all of F1/F2 are close to 1, and most of them are higher than one mainly in regional central cities such as Shanghai, Chongqing, Nanjing, Wuhan, Chengdu, Suzhou, Wuxi, etc., indicating that these cities have significantly stronger external connections than other cities, with distinguishing feature of central cities obviously reflected.
Second, value differentiation of contact strength within Yangtze River Economic Belt cities is more obvious. “Shanghai-Suzhou” (2.09%) shows the highest value of the contact strength between cities, which is almost twice the value between the second-placed “Chongqing-Chengdu” (1.34%). After the 10th place, the value of connection strength between cities is already less than 0.5%. The top five cities with the strongest connection with others are Shanghai, Chongqing, Suzhou, Chengdu, and Wuhan. Shigatse, Shannan, Nagqu, Nyingchi, Ali and other cities have the lowest sum of connection strength values with other cities, which is already less than one billion yuan*10,000 people/min2. It is quite evident that the city connection has an obvious cluster structure. The urban clusters driven by the regional central cities are distributed evenly in the river basin, the “agglomeration effect” of the central cities is significant.
Third, the regional disparity in the connection strength between cities is relatively obvious, showing the law of “city connection in the lower reaches > city connection in the upper and middle regions”. This is due to the fact that there are many mountains and basins in the middle and upper reaches, and topographic factors restrict the construction of economy, population interaction and transportation facilities.
After calculating the in-degree/out-degree centrality, in-closeness/out-closeness centrality and betweenness centrality in the region according to formulas (6) 8) and (9), the following rules can be seen:
Figure 6 and Figure 7 show the current situation of the out-degree centrality and the out-closeness centrality in cities. The averages of the two are 73.4 and 13.2% respectively, with a big difference. It shows that although there seems to be not close connection to each other, the radiation and driving effect between cities is significant, which is gratifying. The out-degree centrality of Shanghai, Wuhan, Chengdu, Kunming and other cities is as high as or close to 95%, indicating that these regional central cities have strong external connection ability and high driving ability. There are many cities with strong radiative driving force being evenly distributed in the basin, which is good for the development of city network. However, the differences in the out-degree centrality between cities are also obvious. The cities in the lower reaches have the highest and more balanced out-degree centrality; and those in the middle and upper reaches of metropolitan area such as “Chengdu-Chongqing” and “Changsha-Zhuzhou-Xiangtan” also have the high out-degree centrality, but the difference is obvious. The external radiation capacity of Ya’an, Yingtan, Jingdezhen and other cities is relatively weak.
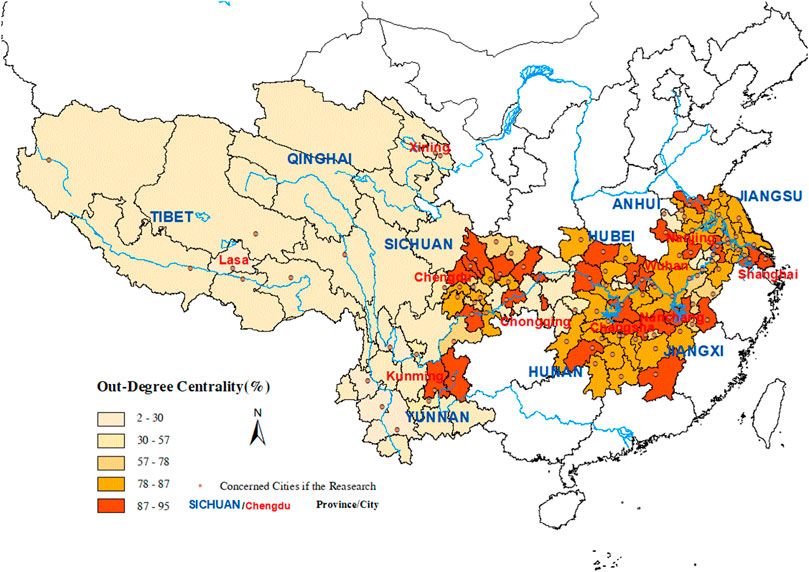
FIGURE 6. Out-degree centrality value distribution in the research area.
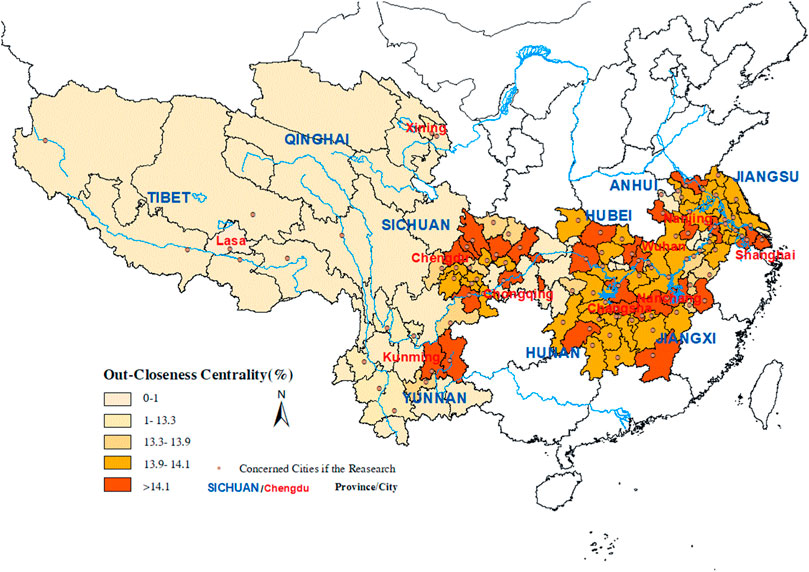
FIGURE 7. Out-closeness centrality value distribution in the research area.
From the perspective of urban attractiveness, the average in-degree centrality and in-closeness centrality of sample cities are 73.4 and 13.2% respectively, and the difference is also obvious. It can also be seen that the attraction of cities to resources is strong with the support of factors such as transportation construction. Figure 8 and Figure 9 show that cities which are central cities located in the downstream and midstream such as Shanghai, Wuhan, and Chongqing have high in-degree centrality and in-closeness centrality. Node cities in different flow segments have good element transition and conduction effects.
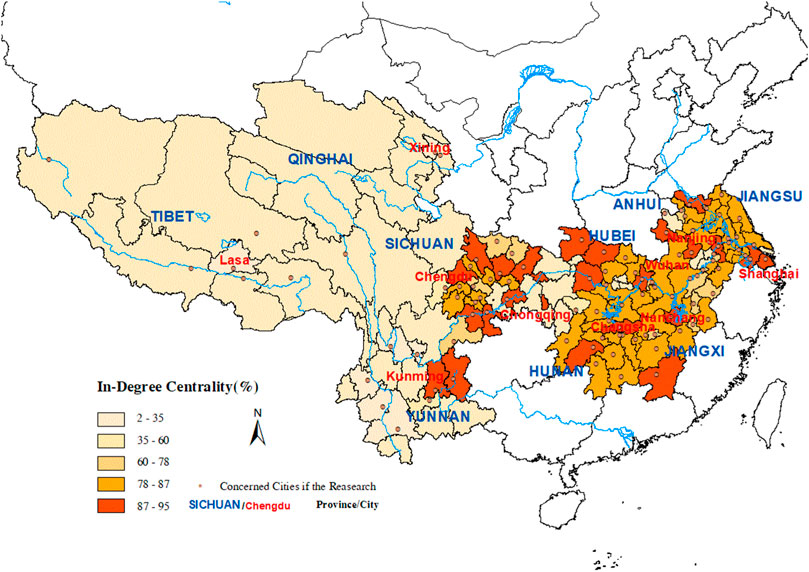
FIGURE 8. In-degree centrality value distribution in the research area.

FIGURE 9. In-closeness centrality value distribution in the research area.
The betweenness centrality of the city network in research region is 16%, but the difference is very large, and the function of the intermediary connection hub of the regional cities is obviously different. Figure 10 shows that a few cities in the midstream and upstream area can get a higher value of betweenness centrality relatively. Chongqing, Wuhan, Chengdu and Kunming have particularly prominent intermediary functions. In contrast, the intermediary functions around Wuhan, Shanghai and Suzhou are relatively scattered. It shows only a few city connection nodes exist in these areas, and the choice is not multiplied. Most surrounding cities can only rely on the central city to establish connections. The “center-edge” characteristic is obvious, and the urban agglomeration as a whole still relies heavily on a few cities as a “media” to expand the economic contact between cities. The betweenness centrality of Shannan, Nagqu, Nyingchi, Haidong and other cities in Tibet is 0, suggesting that these cities are marginal in the network.
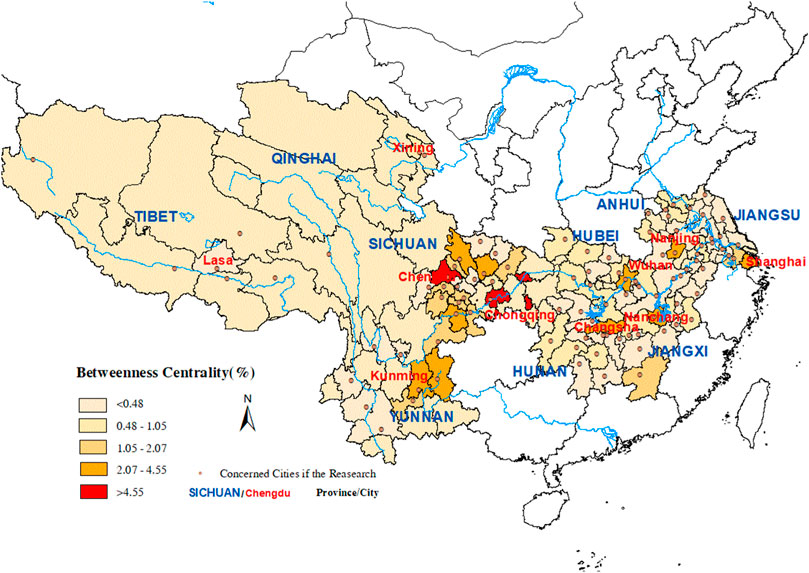
FIGURE 10. Betweenness centrality value distribution in the research area.
As a result from formula (10), the city network density whose average value is as high as 72.67% in the research area is calculated. Regions including the “Chengdu-Chongqing” urban agglomeration and the metropolitan circles around Wuhan, Nanjing, Nanchang, Hefei, and Shanghai score much higher city network density relatively. The sum of connection strength values between cities in these regions accounts for more than 90% of the sum of the 5,151 pairs of connection strength values among all cities in the research region. Table 3 shows that the betweenness centrality of each urban agglomeration in the Yangtze River Economic Belt is close to 90%, indicating relatively high level of development connection and integration. The city network density of sub-urban agglomerations is mostly higher than that of the whole region, suggesting that the internal economic and social connection is far stronger than the overall contact intensity of the basin cities, and the connection between the sub-urban agglomerations interaction needs to be strengthened.
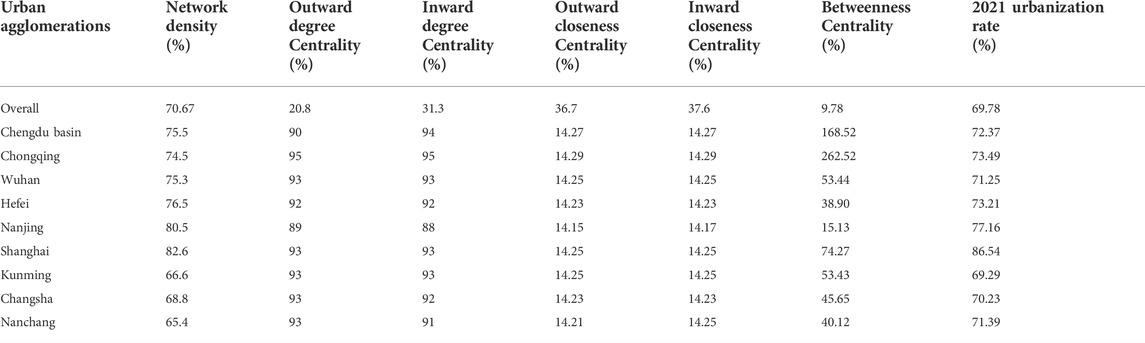
TABLE 3. Average city network and development level indicators values in the research area.
Figure 11 shows that the overall city network density in the research area exhibits the characteristics of “balanced distribution in north and south, dense in the east and sparse in the west, high density along the river, and low density far from the riverside”. The city network density in areas near the river is significantly higher, indicating that rivers play a crucial role during the formation of city networks. The network density of central cities such as Chengdu, Chongqing, Wuhan, Shanghai is significantly higher than that of other regions. The characteristics of sub-centers such as Changsha, Kunming and Nanchang are also obvious. The structure of “center-subcenter” is clear, and is evenly distributed in the river basin. The city network in the midstream region and that in its lower reaches which is also called Yangtze River Delta tends to converge.
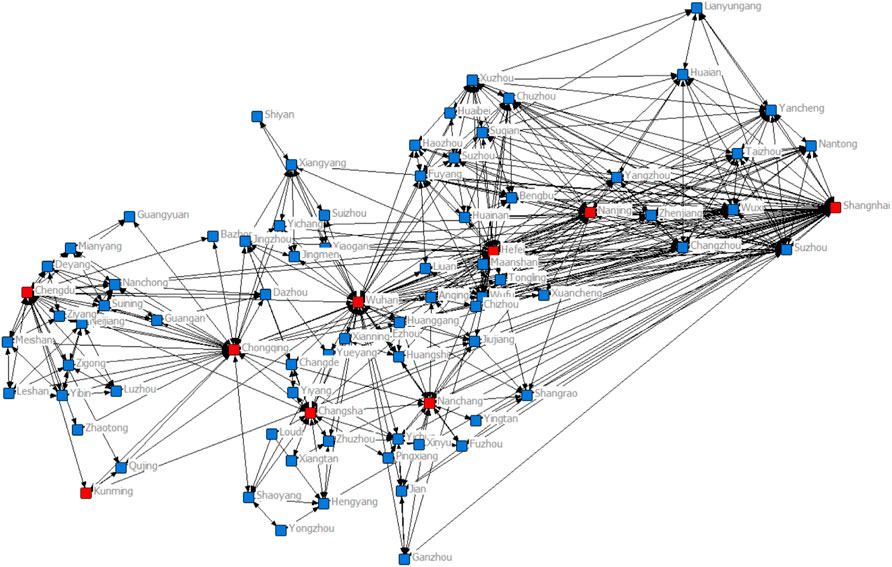
FIGURE 11. City networks structure of the Yangtze River Basin area.
Figure 12 shows that the city network density distribution in the study area is basically consistent with the rivers, showing the M-shaped distribution characteristic:
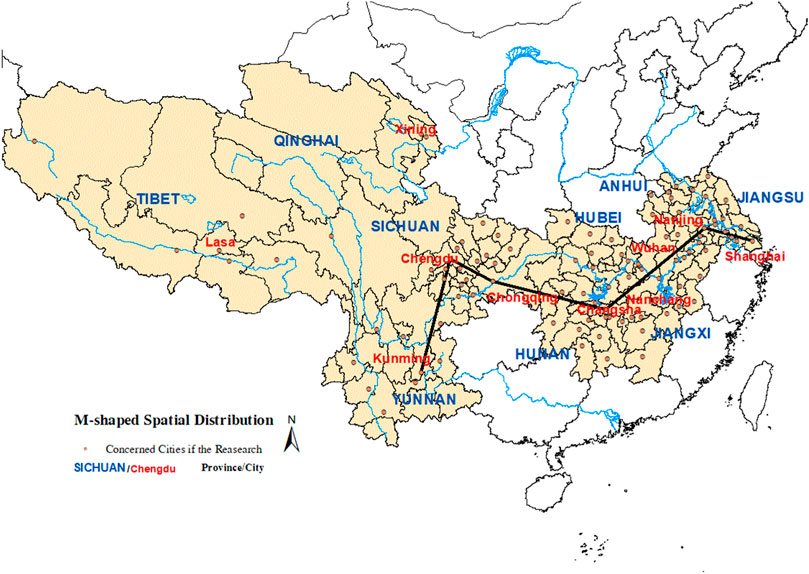
FIGURE 12. High network density value distribution shape in the Yangtze River Basin area.
As shown in Figure 13 and Table 4, there are of four kinds of second class subgroups and eight kinds of third class subgroups in the research scope recognized by UCINET software. The urban subgroups in the basin show a trend of cross provincial integration. The urban subgroups between Sichuan and Chongqing, Hunan and Hubei, Anhui and Jiangxi, Jiangsu and Shanghai are closely combined, and the connection intensity within different subgroups is slightly different.
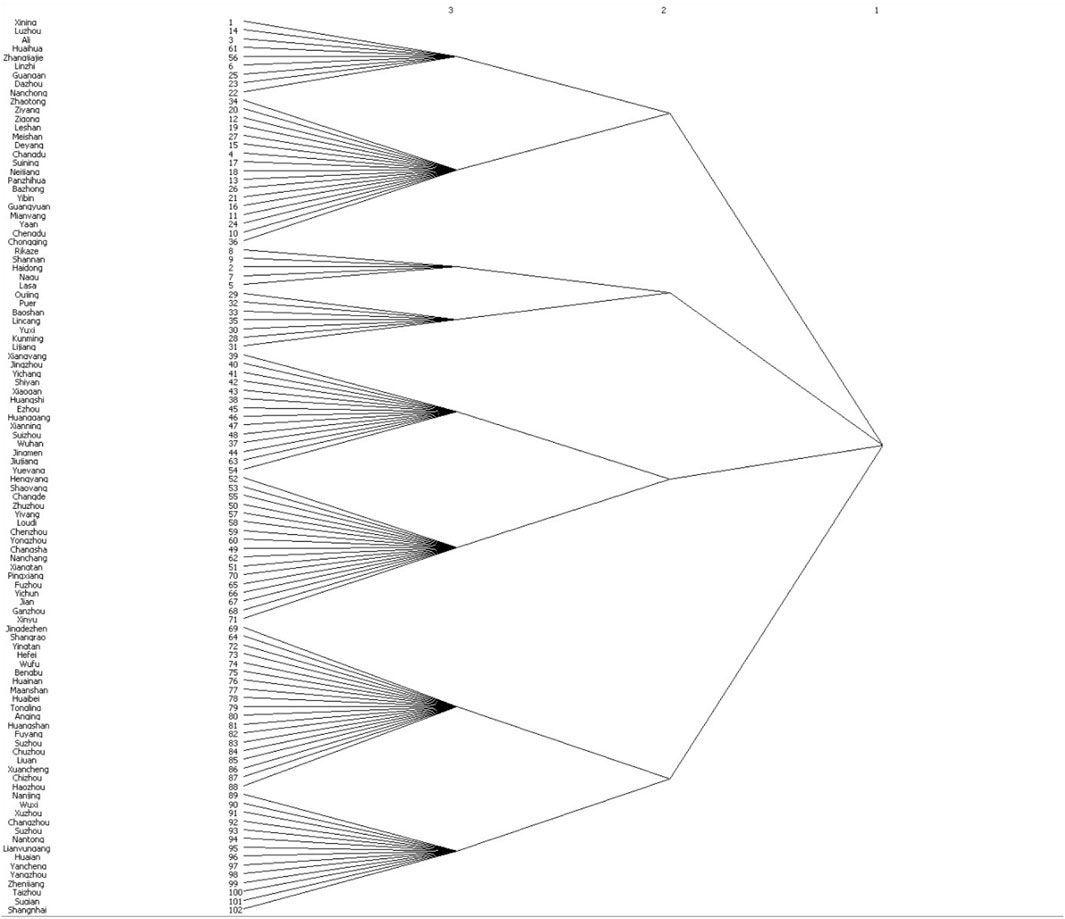
FIGURE 13. Cohesive subgroups in the research area.
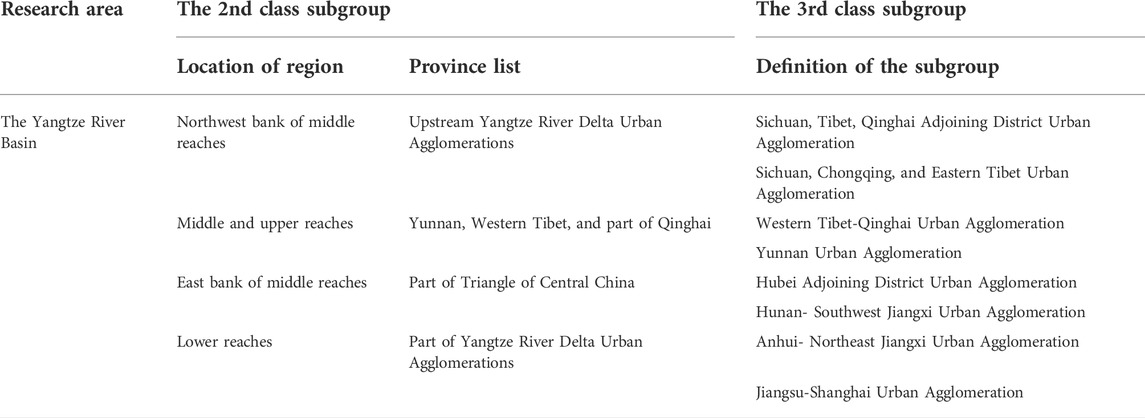
TABLE 4. Cohesive subgroups of city networks in the research area.
Figure 14 describes the spatial distribution of current cohesive subgroups.
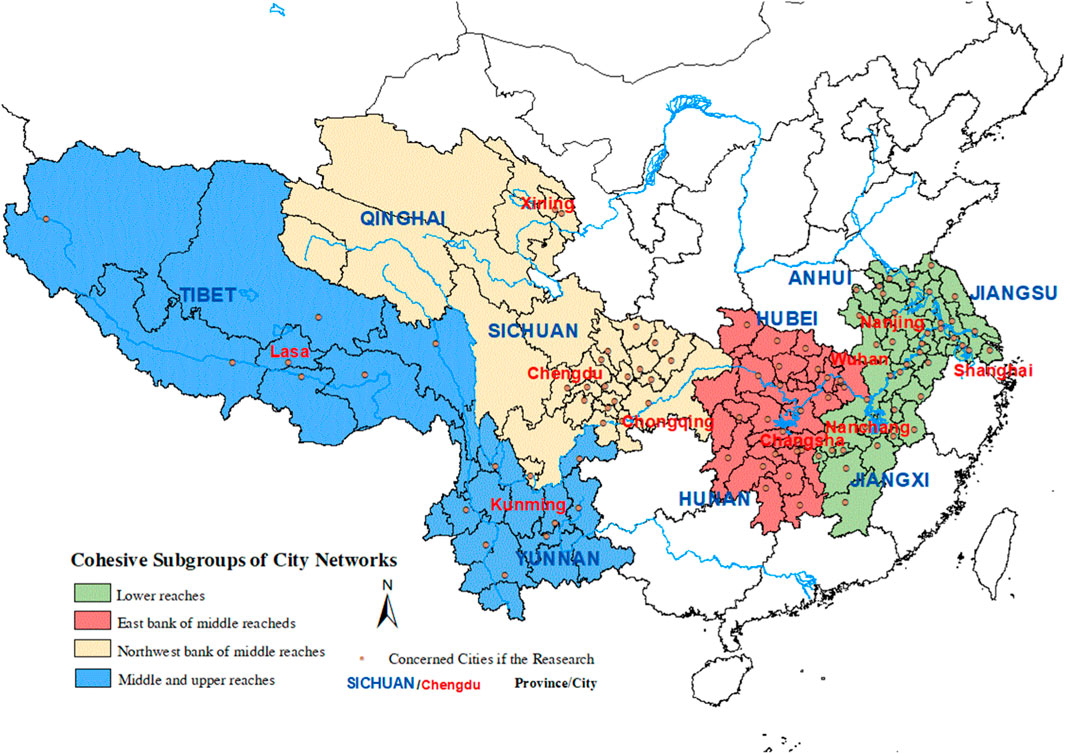
FIGURE 14. Current Situation of cohesive subgroups in the research area.
As shown in Figure 15 and Figure 16, we used ArcGIS software to draw the city level official transfer path in this area from 2015 to 2020, reflecting the potential economic cooperation and resource cooperation possibilities between cities, which are promoted by official private social relations. The results show that officials transfer between cities is mainly within provinces. It is common for officials to be transferred at the same post level between cities. Officials transferred across provinces are usually at the same level. Most of the job promotions occur when officials are transferred from non-central cities to central cities. Non-central cities also transfer officials to each other. Cities which is the five largest number of officials transferred to are Xining (16 transfers), Haidong (15 transfers), Ali (Tibet) (14 transfers), Changdu (11 transfers) and Lhasa (10 transfers), most of which are underdeveloped cities in the basin. Local officials in Chengdu, Kunming, Wuhan, Chongqing and Xining have been transferred to backward cities more frequently. It reflects that the government attach importance to the transfer of outstanding officials to help the development of backward cities.
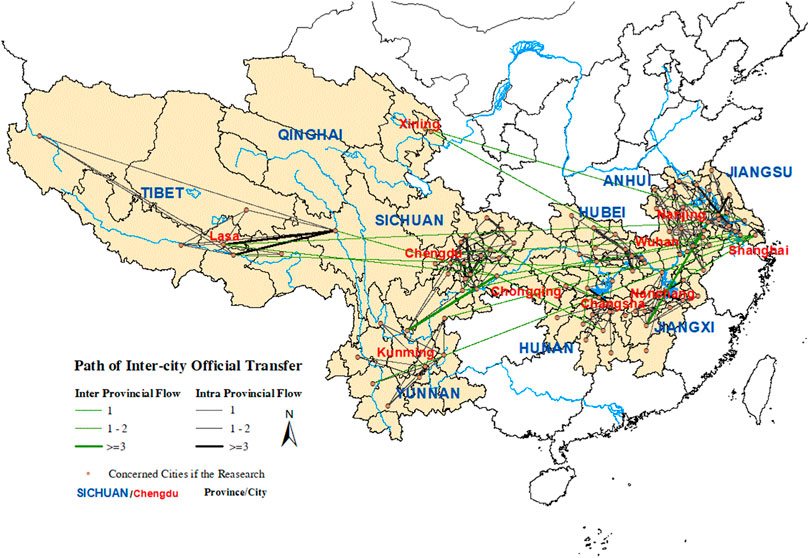
FIGURE 15. Path diagram of inter-city official transfer in the research area.
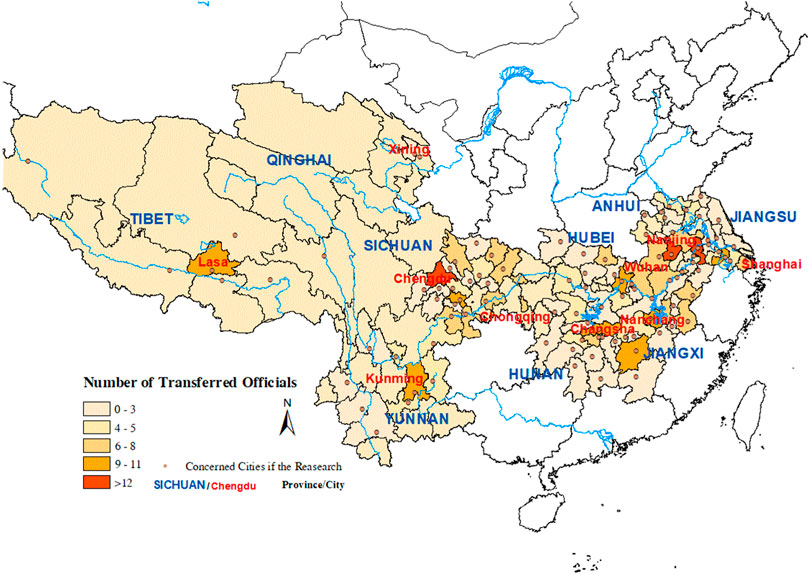
FIGURE 16. Current situation of the amount of primary city officers transferred between cities in the research area.
The “dual-direction time distance” modified gravity model can better show interaction differences between cities, and comprehensively reflect the possibility of real and potential economic cooperation, population flow and resource connection between cities. It has high application value for the mining of regional city network structure.
The city network connection strength in the area has obvious regional differentiation characteristics. The connection strength between cities in the downstream area is higher than that in the midstream and upstream area. The development level of the city network is positively correlated with the level of regional economic development. Because the level of economic development determines the level of local fiscal revenue and infrastructure construction capacity, at the same time, a larger economic scale can also generate more economic cooperation, which has a reverse role in promoting the strengthening of regional inter city ties.
The average values of “out-degree centrality” and “in-degree centrality” of the cities in the research area are high, but the difference between cities is obvious, which also shows the characteristics of “downstream area > middle and upstream area”. Most dual-direction connection strength between cities is generally equal, but that of the central city to surrounding cities is dramatically higher than that of surrounding cities to their central city, indicating that the “agglomeration effect” of the central city is significant and the central status is strong. The urban connection in the basin has obvious cluster structure, and the urban agglomeration is relatively mature and closely connected. The internal connection strength of cohesive subgroups of cities is strong, while the connection strength between cohesive subgroups of cities is relatively small. The cohesive subgroups of cities generally present an “M” shape along the river.
The results show that the construction of urban transport facilities in the river basin is generally in a satisfying condition, though the shortcomings in the middle and upper reaches still need to be made up. Chongqing, Chengdu, Kunming and other cities are very important for the interaction between cities within the region as well as in the connection between regional cities and downstream developed areas. The “center-edge” structure of urban agglomeration is more obvious.
Based on the empirical analysis, there are some practical suggestions proposed as followed:
First, the Yangtze River basin is of strong economic strength. There are many central cities with strong radiative driving power, which are evenly distributed in the river basin. Promoting the integration of urban functional groups will be a key task. In the near future, the 4 second-class subgroups of the city network may be prioritized as plans of zoning for the construction of the city network. First, strengthen the internal relations of the secondary subgroups, vigorously develop the intercity railway, promote the industrial echelon transfer and the uniform distribution of the population. On this basis, gradually strengthen the interconnection of various infrastructure between adjacent subgroups. Nanchang in Jiangxi, Kunming in Yunnan and Changsha in Hunan can be selected as key cities. Promote the further integration of several major urban agglomerations, form the urban development pattern of “downstream driving - midstream transition - upstream connection”, and drive the development of cities in the upstream such as central Yunnan and the hinterland of Tibet area.
Second, further enhance the functions of central cities, expand the radiation and driving capacity, and strengthen the links between central cities. The central city plays an important role in regional economic driving, function transmission intermediary, and building a cooperation platform. The construction of central cities can refer to the current M-shaped distribution to build the core city chain in the west-east direction of “Chengdu/Chongqing - Wuhan - Hefei - Nanjing—Shanghai” connecting the upstream and downstream areas, develop the sub central city chain of “Kunming - Changsha—Nanchang”, and strengthen the links between the north and south basin.
Third, give full play to China’s institutional advantages can promote potential economic and resource development cooperation by strengthening the mobilization of excellent officials between developed and underdeveloped regions, so that the development achievements and resource advantages of different regions can be shared. Through the mobilization of local officials, the use of private social contacts of officials can enhance the potential complementarity between cities in the river basin into reality, enhance the cross regional transfer and cooperation of resource elements, and promote the sharing of development achievements while improving economic efficiency.
In the future, it will become a more accurate research tool to mine the city network structure by using the big data of regional population migration, economic cooperation and transportation. At the same time, the dynamic change process of city network density also deserves further study.
The original contributions presented in the study are included in the article/Supplementary Material, further inquiries can be directed to the corresponding author.
DC, research scheme design, literature review, empirical research operation, empirical results analysis, paper organization and editing of the full paper. JD, literature review, empirical research operation, writing of a section of the paper. ZY, data collection and sorting operation. DZ, literature review, empirical research operation and GIS map making.
This study was supported by the National Natural Science Foundation of China (Grant no. 71974220).
Thank Professor Song Yan of the UNC for her enlightening suggestions on the research. At the same time, thank Li Changqing for providing English polishing and proofreading for this article.
The authors declare that the research was conducted in the absence of any commercial or financial relationships that could be construed as a potential conflict of interest.
All claims expressed in this article are solely those of the authors and do not necessarily represent those of their affiliated organizations, or those of the publisher, the editors and the reviewers. Any product that may be evaluated in this article, or claim that may be made by its manufacturer, is not guaranteed or endorsed by the publisher.
The Supplementary Material for this article can be found online at: https://www.frontiersin.org/articles/10.3389/fphy.2022.1018993/full#supplementary-material
1. Cao X, Liang F, Chen H. Influence of different spatial forms for metropolitans on transportation network efficiency. Scientia Geographica Sinica (2019) 39(1):41–51. doi:10.13249/j.cnki.sgs.2019.01.005
2. Peng F. Economic spatial connection and spatial structure of Guangdong-Hong Kong-Macao greater Bay and the surrounding area cities—an empirical analysis based on improved gravity model and social network analysis. Econ Geogr (2017) 37(12):57–64. doi:10.15957/j.cnki.jjdl.2017.12.008
3. Ding R, Liu M, Li D. The driving effect of Polycentric city network on coordinated regional economic development—Taking the Yangtze River economic belt as an example. Stat Res (2020) 37(11):93–105. doi:10.19343/j.cnki.11-1302/c.2020.11.008
4. Liu H, Shen Y, Meng D, Jin X. The city network centrality and spatial structure in the Beijing-Tianjin-Hebei metropolitan region. Econ Geogr (2013) 33(8):37–45. doi:10.15957/j.cnki.jjdl.2013.08.008
5. Liu K, Zhou Y, Wang S. Urban science and technology innovation efficiency and network structure characteristics:an empirical analysis based on national innovative cities. Sci Technology Prog Policy (2020) 37(23):36–45.
6. Taylor PJ, Derudder B. World city network: A global urban analysis. London: Routledge Press (2003). p. 256.
8. Pan F, Cheng F, Li X. The Progress and prospect of research on Chinese city network. Scientia Geographica Sinica (2019) 39(7):1093–101. doi:10.13249/j.cnki.sgs.2019.07.007
9. Li D, Yi W, Wang T. Spatial and temporal evolution of urban innovation network in China. Habitat Int (2015) 49:484–96. doi:10.1016/J.HABITATINT.2015.05.031
10. Feng Z, Wang X, Yin J, Zhang M. An empirical study on Chinese city network pattern based on producer services. Chin Geogr Sci (2013) 23(3):274–85. doi:10.1007/s11769-013-0595-8
11. Zhao M, Liu X, Derudder B, Zhong Y, Shen W. Mapping producer services networks in mainland Chinese cities. Urban Stud (2015) 52(16):3018–34. doi:10.1177/0042098014558541
12. Wang F, Liu Y, Wang J. Transport networks, intraurban structure and system of cities:a Sino-US comparative perspective. Prog Geogr (2014) 33(10):1289–99.
13. Cheng Y, Zhu Y. The Tum of the world city study and Chinese world cities. Urban Plann Forum (2015) 5:39–44. doi:10.16361/j.upf.201505005
14. Li M, Wang C, Liu H, Wang R, Yu S. Evaluation of urban development quality and characteristics of spatial connection network in the Yellow river basin. Econ Geogr (2021) 41(12):84–93. doi:10.15957/j.cnki.jjdl.2021.12.009
15. Wang C, Duan Y, Zhang R. Spatial pattern evolution of cities and influencing factors in the Historical Yellow river basin. J Nat Resour (2021) 36(1):69–86. doi:10.31497/zrzyxb.20210105
16. Xu P, Ye Z. Review and prospect of the development of urban agglomerations in New China in the past 70 years. Development Res (2019) 11:18–25.
17. Lu D. The ‘T’-shaped structure of land development and economic Arrangements and the Sustainable development of the Yangtze economic belt. Macroeconomic Management (2018) 11:43–7+55. doi:10.19709/j.cnki.11-3199/f.2018.11.008
18. Zhang G. Promote high-quality development of the comprehensive transportation system in the Yangtze economic belt. China Transportation Rev (2022) 44(1):1.
19. Li M, Wang L. Discussing how to extract city characteristic with the examples of ancient capital cities in the Yellow River basin. China Ancient City (2017) 5:25–30.
20. Xiao H. Analysis of some Advances in Contemporary social network research. Sociological Stud (1999) 3:3–13.
21. Fujita M, Ogawa H. Multiple equilibria and structural transition of non-monocentric urban configurations. Reg Sci Urban Econ (1982) 12:161–96. doi:10.1016/0166-0462(82)90031-x
22. Smith DA, Timberlake M. Conceptualising and mapping the structure of the world System’s city system. Urban Stud (1995) 32(2):287–302. doi:10.1080/00420989550013086
23. Taylor PJ, Catalano G, Walker DRF. Exploratory analysis of the world city network. Urban Stud (2002) 39(13):266–79. doi:10.1080/0042098022000027013
24. Derudder B, Taylor P. The cliquishness of world cities. Glob Networks (2005) 5(1):71–91. doi:10.1111/j.1471-0374.2005.00108.x
25. Pflieger G, Rozenblat C. Introduction. Urban networks and network theory: The city as the connector of multiple networks. Urban Stud (2010) 47(13):2723–35. doi:10.1177/0042098010377368
26. An Y, Liu J, Qiao D. Analysis of the urban spatial connection network pattern of the central Plains urban agglomeration——based on the comprehensive traffic information flow. Scientia Geographica Sinica (2019) 39(12):1929–37. doi:10.13249/j.cnki.sgs.2019.12.011
27. Zachary P. Fallacies in world city network measurement*. Geogr Anal (2021) 53(2):377–82. doi:10.1111/gean.12230
28. Wang C, Wang M. Evolution of associated network characteristics between cities in Shandong province comparing central place and flow space Theories. Geographical Res (2017) 36(11):2197–212.
29. Gao Z, Zhang M. Analysis of efficiency Heterogeneity and spatial effect of urban Shrinkage in the Yellow river basin. Urban Probl (2021) 4:4–11. doi:10.13239/j.bjsshkxy.cswt.210401
30. Zhang H, Jia S, Luo Y. Spatial network structure of tourism economic relations in the upper Reaches of the Yangtze River. Areal Res Development (2022) 41(2):95–100.
31. Qiu Y, Han W, Wu J. Dynamic evolution of innovation space correlation network of urban agglomeration in the middle reaches of Yangtze River——an empirical research based on social network analysis. J Xiangtan University(Philosophy Social Sciences) (2021) 45(52):80–6+107. doi:10.13715/j.cnki.jxupss.2021.05.013
32. Wang S, Song Y, Wen H, Jing L. Network structure analysis of urban agglomeration in the Yangtze River economic belt under the perspective of Bidirectional economic connection:based on time distance and social network analysis method. Econ Geogr (2019) 39(2):73–81. doi:10.15957/j.cnki.jjdl.2019.02.009
33. Wu C, Huang X, Chen B, Li J, Xu J. Analysis of economic and spatial linkage and economic integration trend in Yangtze River economic belt from social network analysis perspective. Econ Geogr (2017) 37(7):71–8. doi:10.15957/j.cnki.jjdl.2017.07.010
34. Gao P, He D, Sun Z, Ning Y. Characterizing functionally integrated regions in the Central Yangtze River Megaregion from a city‐network perspective. Growth and Change (2020) 51(3):1357–79. doi:10.1111/grow.12401
35. Zhao J, Wang C, Cao S. City network structures of the Yangtze River Basin and the Yellow River Basin based on multi⁃el⁃ ement factor flows. China Popul Resour Environ (2021) 31(10):59–68.
36. Wu S, Zhong Y, Wu Q, Mao W. Multi-outward connection networks of urban agglomeration:an empirical study from middle reaches of Yangtze River to Yangtze River economic belt. Resour Environ Yangtze Basin (2021) 30(10):2360–72.
37. Sun J, Hu W, Fu Y. City network structure and spatial pattern in Yangtze River economic belt based on the analysis of HSR flow data. Areal Res Development (2022) 41(3):75–81.
38. Gao S, Liu J. The research of Beijing-Tianjin-Hebei urban Agglomerations’Spatial connection based on urban relation intensity and urban flow. Areal Res Development (2013) 32(3):57–61.
39. Lian J, Zeng G, Teng T. Research on the difference of function diffusion of the central city based on the economic connection intensity:A Case of the central city of Hangzhou metropolitan area and its Compact cities. Areal Res Development (2017) 36(6):54–8.
40. Zhang H, Zhang D, He Q. Analysis of urban association intensity based on Tencent migration data and gravity model ——a Case study of urban agglomeration around Poyang lake. Chin Overseas Architecture (2019) 7:66–9.
41. Li E, Lu Y, Yang X, Chen Y, et al. Spatio-temporal evolution on connection strength of global city network based on passenger flight data from 2014 to 2018. Scientia Geographica Sinica (2020) 40(1):32–9. doi:10.13249/j.cnki.sgs.2020.01.005
42. Jun C, Zheng G, Liu Y. The spatial connection evaluation of Yangtze River Delta with the high-speed rail. Econ Geogr (2014) 34(8):54–60+67. doi:10.15957/j.cnki.jjdl.2014.08.037
43. Guo L, Wang R. Syudy on Accessibility and spatial connecting among the cities in Sichuan basin urban agglomeration. Hum Geogr (2009) 24(3):42–8.
44. Meng H, Huang X, Yang J, Lin B. Network structure and development concept in Huaihai economic zone. Econ Geogr (2019) 39(12):1–10. doi:10.15957/j.cnki.jjdl.2019.12.001
45. Chen L, Jin X. Measurement of spatial interaction between central towns based on the gravity model. Scientia Geographica Sinica (2016) 36(5):724–32. doi:10.13249/j.cnki.sgs.2016.04.005
46. Liu Y, Li G, Sun L. City network research in China:A literature review based on social network analysis. Urban Development Stud (2021) 28(11):16–22.
47. Wu M, Zhou L. Political Incentives and city construction: The Visibility of public Projects. Econ Res J (2018) 53(12):97–111.
Keywords: city network, dual-direction time distance, gravity model, social network analysis, Yangtze river economic belt
Citation: Chai D, Du J, Yu Z and Zhang D (2022) City network mining in china’s yangtze river economic belt based on “two-way time distance” modified gravity model and social network analysis. Front. Phys. 10:1018993. doi: 10.3389/fphy.2022.1018993
Received: 14 August 2022; Accepted: 12 September 2022;
Published: 30 September 2022.
Edited by:
Fei Xiong, Beijing Jiaotong University, ChinaReviewed by:
Jinzhong Guo, Xinjiang University of Finance and Economics, ChinaCopyright © 2022 Chai, Du, Yu and Zhang. This is an open-access article distributed under the terms of the Creative Commons Attribution License (CC BY). The use, distribution or reproduction in other forums is permitted, provided the original author(s) and the copyright owner(s) are credited and that the original publication in this journal is cited, in accordance with accepted academic practice. No use, distribution or reproduction is permitted which does not comply with these terms.
*Correspondence: Duo Chai, Y2hhaWR1b2JudUAxMjYuY29t
Disclaimer: All claims expressed in this article are solely those of the authors and do not necessarily represent those of their affiliated organizations, or those of the publisher, the editors and the reviewers. Any product that may be evaluated in this article or claim that may be made by its manufacturer is not guaranteed or endorsed by the publisher.
Research integrity at Frontiers
Learn more about the work of our research integrity team to safeguard the quality of each article we publish.