- 1School of Science, Beijing University of Posts and Telecommunications, Beijing, China
- 2Tsinghua Education Foundation, Tsinghua University, Beijing, China
The recommendation system has become an indispensable information technology in the real world. The recommendation system based on the diffusion model has been widely used because of its simplicity, scalability, interpretability, and many other advantages. However, the traditional diffusion-based recommendation model only uses the nearest neighbor information, which limits its efficiency and performance. Therefore, in this article, we introduce the centralities of complex networks into the diffusion-based recommendation system and test its performance. The results show that the overall performance of heat conduction algorithm can be improved by 184%–280%, using the centrality of complex networks, reaching almost the same accuracy level as the mass diffusion algorithm. Therefore, the recommendation system combining the high-order network structure information is a potentially promising research direction in the future.
1 Introduction
With the development of information technology, people are overwhelmed by an increasing amount of information. Although the development of technological innovations has made our lives easier, meanwhile, overloaded information consumes our time and efforts when we are searching online. Therefore, in response to this demand, searching systems and recommendation systems are evolving accordingly, and they both are the technologies that have been developed to deal with information overload. The searching systems solve the problem of directed search, while the recommendation systems can predict the possible preferences and interests of users based on the previous data. Recommendation systems have been developed for decades, and each part has been gradually improved and developed toward more multi-level and applicable models.
Collaborative filtering [1–3] is one of the most widely used, least computationally complex, and most effective information-filtering algorithms. The CF algorithm provides personalized recommendations for each user based on the user’s past purchase history database and product search records. Breese et al. [2] classified CF into two broad categories, namely, memory-based and model-based approaches. Memory-based methods predict information and recommend products based on a measure of similarity between the user and the product [3–5]. Model-based algorithms use a collection of user and object information to generate information-filtering models [10, 11] through clustering [6], Bayesian approach [7], matrix factorization [8, 9], and other machine learning methods.
Different from computer science, the application of physics in the field of interdisciplinary science has also obtained some successful complex network theories, and various classical physical processes have provided some new insights and solutions for the active field of information filtering in recent years [1, 12, 13]. For example, the diffusion process like the heat conduction process on a dichotomous complex network [14], the principles of dynamic resource allocation in dichotomous complex networks [15], opinion diffusion [16], and gravity [17] have been applied in information filtering.
Overall, CF and other diffusion-based recommendation algorithms have been successfully applied to many well-known online e-commerce platforms. Meanwhile, in recent years, a lot of research studies, such as the heat conduction, mass diffusion, or hybrid method [20, 21], biased heat conduction [22, 23], multi-channel diffusion [24], preferential diffusion [25, 26] based on the CF direct random walk method [27], hypergraph models with social labels [28, 29], and multilinear interactive matrix factorization [30],are devoted to studying the two variations of the algorithm. These algorithms will further improve the efficiency of information-filtering systems. In addition, multiple explorations [31, 32] on information filtering considering external constraints have also been made.
Meanwhile, we should note that the compressed network structural information, including the information core and information backbone, provides some enlightenment for the in-depth understanding of information filtering [18, 19]. Some network structural centralities, such as PageRank and eigenvector centrality, can indicate the structural properties of networks in one-dimensional metrics, while traditional network structure statistics, such as degree, can only contain first-order structure information (nearest neighbor information). We can conclude that it is highly probable to obtain richer structural information about the network by replacing the influence of first-level nearest neighbors with one-dimensional complex network structural centralities, such as coreness and PageRank. This structural information considers the long-range correlations in the network structure, which is expected to help improve the accuracy of recommendation systems and improve the application prospect in real scenarios. In the following part of this article, we will show that the adoption of network structural information can greatly improve the performance of some recommendation algorithms.
2 Materials and methods
2.1 Dataset description
We obtained seven commonly used datasets in the research of recommendation systems. The datasets are listed in Table. 1.
2.2 Evaluation metrics
In the dataset, we know some of the items that users collect, and we need to recommend other items for users. Therefore, to compare the recommendation performance of recommendation algorithms [33], we divide the dataset into two categories: training set and test set. The training set is used for each user-recommended item, and then the test set is used to evaluate recommendation algorithm. When calculating the evaluation metrics, we will regard the selection of the user from the user’s recommendation lists as a positive example, and otherwise, a negative example. For each user, in accordance with the actual results and predicted results of each item, 1 is expressed as a positive case, and 0 is expressed as a negative case. We can define the following three indicators: precision, recall, and F1-score.
Precision and recall are commonly used evaluation indices. Precision is defined as the proportion of data in the dataset that the label predicts correctly, and recall is the proportion of data that we predict to be correct in a certain class. They are calculated as
But for each user, what we obtain is a list of users, namely, the TOP-K recommendations. So, we assume that the number of items recommended to the user is K, the precision is the number of recommended items in the test set, and the recall rate is the correct number of recommended items in the test set. For a target user, the precision and recall are defined as
where
When recommending TOP-K items for users, what need to be considered are the precision and recall rate of the reality (whether the user likes it or not) and the predicted label (recommendation list) of each item. Therefore, F1-score, also called balanced F-score, is an index commonly used to express the precision rate of binary classification problems in statistical data analysis. F1-score can be regarded as the harmonic average result of two indices, and the value range is [0, 1]. F1-score is defined as
2.3 The general Markovian form of diffusion-based recommendations
In this section, we briefly introduce the three algorithms adopted in this article. When they are applied to calculate the recommendation list of users on the dataset, it is necessary to calculate the probability transition matrix on each training set, but the time complexity is higher if the calculation is carried out directly through the formula. Therefore, through observation, it is found that the calculation form of the probability transition matrix is to multiply the corresponding elements after row normalization and column normalization of some two columns in the adjacent matrix. Therefore, the calculation formula can be simplified into a matrix form [34, 35] to reduce and improve the calculation efficiency of the algorithm. For example, the calculation formula of the probability transition matrix of the heat conduction algorithm is as follows:
Here,
where
Here,
If a network graph corresponding to a dataset is defined as
where
According to the final rating result, some items that are not collected by the user yet are sorted according to the score. Since the TOP-K recommendation with the highest score is selected in the dataset, it is the recommendation list of the user i that is recorded as a matrix of
2.4 A brief introduction to the centralities of networks
2.4.1 Closeness centrality
The closeness [36] indicates the degree of difficulty in arriving at other nodes from a certain node, and the larger the value is, the farther the distance from other nodes is; a lower value indicates a closer distance to other nodes. It is calculated using the following equation:
where
2.4.2 Eigenvector centrality
Eigenvector centrality [37] is a metric to measure the impact of nodes on the network. This metric is used when nodes with the same number of links are present. A high score for eigenvector centrality means that the node is connected to a few nodes that have high scores themselves. For a given network with an adjacent matrix A, if two nodes i and j are not directly connected, then
and eigenvector centrality is given by the eigenvector corresponding to the largest eigenvalue of
2.4.3 Katz centrality
Like eigenvector centrality, Katz centrality [38] also measures the importance of nodes. The difference is that it considers the nodes that have an in-degree 0 by adding a decay coefficient
In practice, the attenuation coefficient
2.4.4 PageRank
PageRank [39] algorithm was originally a calculation method for calculating weights to solve the ranking between web pages, which was developed based on eigenvector centrality. Although the method is proposed to solve the problem of a directed graph, this method can be used in any graph, and now it is often applied to the analysis of the importance of various networks.
For a directed graph
If this series converges, the final vector
Finally, we can obtain the following expression:
where
3 Results
The degree is the most commonly used metric in the study of a network structure model, which is defined as the number of neighboring nodes of a given node, thus reflecting the importance of a node in the network. In the diffusion-based recommendation algorithm, the process of heat conduction or mass diffusion of each node is completed governed by the degree of each node. But this idea is, in fact, too simple to be applied in the real world. In a social network, if a member B knows only one influential member A, although the node has a only degree that equals to 1, B’s influence will increase due to the higher importance of node A. From this point of view, there is a room for improvement in the use of the network structure as an indicator for user recommendation.
Therefore, the method proposed in this article is to improve the recommendation algorithm based on the traditional diffusion process by replacing the degree with the network structural centralities like closeness, eigenvector centrality, PageRank, and Katz centrality. These four types of network structural centralities are used in this article.
3.1 The selection of test sets
We first randomly divide the dataset into 90% of the training set and 10% of the test set according to the conventional practice and use the algorithm to recommend items for users. However, since the size of the dataset of each user is not average, in real life, the length of the recommendation list required by each user is not the same. Therefore, to compare the difference of the recommendation performance among different algorithms, we only consider the TOP-K recommendation list of each user, if the length of the recommendation list is
However, in the application of the recommendation algorithm, the random selection of the test set is inconsistent with the application of the recommendation system because it neglects the temporal information and can violate causality. Therefore, in this article, the test set can be selected in a temporal way. As all datasets are sorted in accordance with the timestamp in this article, we select the time of the latest 10% of the data as the test set of the data and the rest of the time before as the training set.
3.2 Results of datasets with temporal test sets
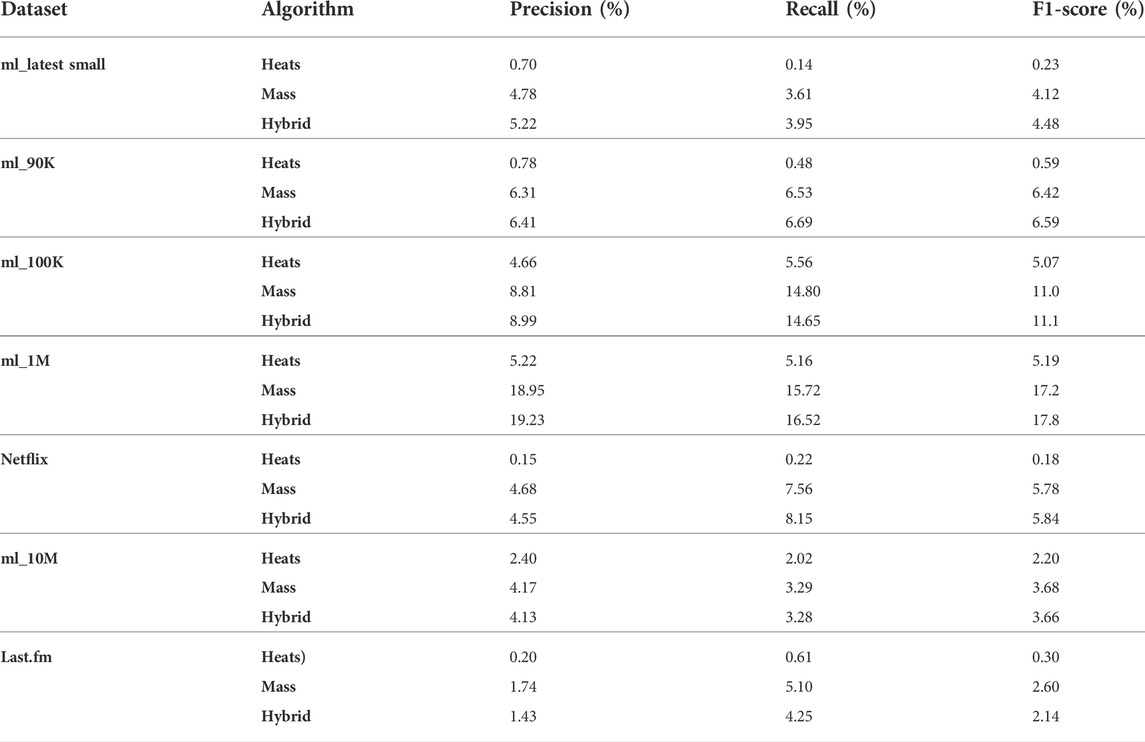
On the datasets, after selecting the test set with a temporal sequence, the results are as follows:
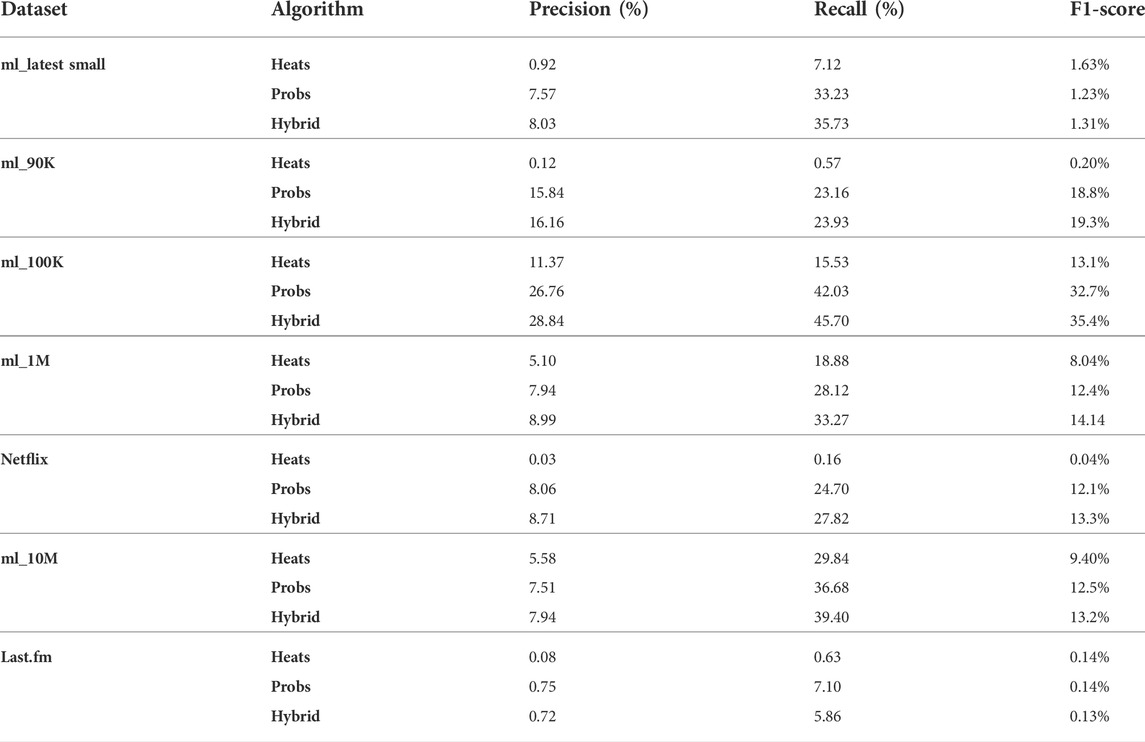
For the test set selected in a temporal sequence, several indicators of the performance are a bit lower than those of the results of random selection (shown in Table 2 and Table 3). This is mainly because of the following reason: if the dataset is small and the timestamps of the users are not likely to be evenly distributed, then it is likely that the user’s activity will not be selected into the test set. This will reduce the number of samples in the training set; these users will be less connected to the whole system. This will also affect the algorithm for these users of the prediction results, and the calculation of the precision of the algorithm only considers this subset of the user’s TOP-K recommended list. So, the accuracy of the four indicators will decline. However, in this way, we obtain the training set and the test set which are closer to the reality, and the result of the algorithm is more meaningful and applicable than that of random selection of test sets.
3.3 Results incorporating centralities
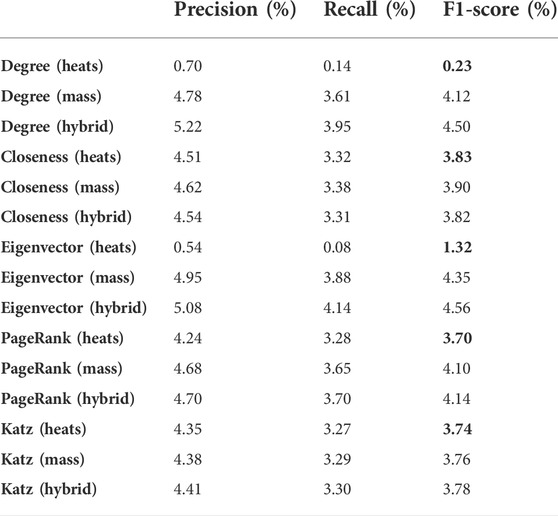
In the aforementioned Materials and methods section, it was shown that for the original algorithm, calculation is directly carried out through a probability transition matrix calculation formula, so that the time complexity is high; however, the formula can be converted into a matrix form through simplification, namely, the weight of heat or resource allocation can be changed, so that the performance of the algorithm can be improved. We calculate the five network structural metrics, and the results of the movielens_latest small dataset are as follows:
From the aforementioned Table 4, the following conclusions can be obtained between different network structural centralities and different algorithms:
1) The results of various network structural centralities basically meet the common knowledge that the precision of the hybrid algorithm is greater than that of the mass diffusion algorithm and is greater than that of the heat conduction algorithm. However, for the results of PageRank or eigenvector centrality, it can be seen that the results of mass diffusion algorithm are better than those of hybrid algorithm, mainly due to the influence of the fixed weighting coefficient of the hybrid algorithm.
2) More interestingly, by changing the network structural centrality, the precision of the algorithm is improved, especially the precision of the heat conduction algorithm is greatly improved by 5.73–16.7 times, with the F1-score measure, and almost reaches the level of mass diffusion. The results of HC are marked in bold font.
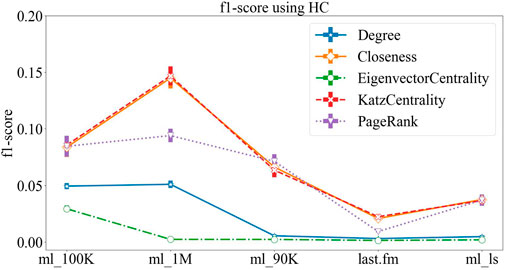
For further analysis, we choose the more comprehensive index F1-score to compare the differences of recommendation results obtained by different centralities on five datasets. As in the aforementioned dataset, the F1-score results obtained by the heat conduction algorithm using five network structural indicators are shown in Figure 1.
From the aforementioned figure, we can see that the method of introducing the network structural metrics improves the performance when using the HC algorithm. Among these metrics, Katz centrality and closeness centrality are the most effective, but the eigenvector centrality greatly reduces the precision of the original method. Moreover, we can see that the F1-score of the algorithm is improved by about 280% by using Katz centrality and closeness centrality on the movielens_1M dataset, and the F1-score of the algorithm is improved by 184% by using PageRank.
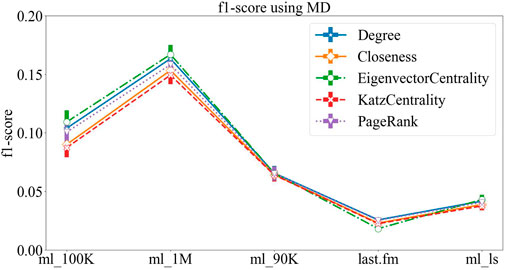
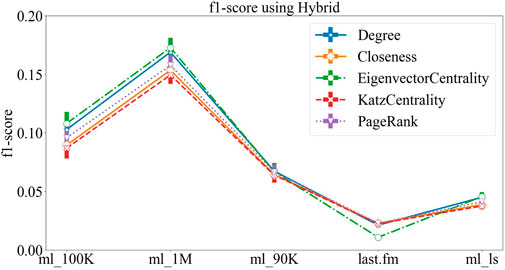
The results of MD and hybrid algorithms are shown in Figure 2 and Figure 3, respectively. The figures show that the results of the two algorithms are relatively similar, and the recommendation results when different structural centralities are applied are basically similar; also, there are a few small differences in different datasets. But one can see that for each dataset, when using the three metrics, the results of degree, eigenvector centrality, and PageRank are better, while the results of the other two metrics are slightly worse, but the differences between each metric are generally within 5%. On some datasets, such as movielens_100K and movielens_1M, we can see that the recommendation results obtained by using eigenvector centrality are marginally better than those obtained by using the degree.
4 Discussion
In this study, we mainly focus on the traditional collaborative filtering (CF)-based recommendation systems to improve the information-filtering technique by utilizing the network structural centrality. This article focuses on the recommendation systems that are based on the diffusion processes: heat conduction algorithm and mass diffusion algorithm, which are based on physics theories. However, these two algorithms have their own focus in terms of accuracy and diversity. Combining the two algorithms by a weighting coefficient λ can lead to a hybrid algorithm that can obtain better performance in both the metrics [20].
The recommendation results of the aforementioned three algorithms that adopt degree information as the input of the recommendation system are obtained on the movielens and other datasets commonly used. Through the analysis, we find that the degree contains network structural information of nearest neighbors, which only reflects the number of neighbors of each node. Therefore, this article proposes an improved method that contains the information of higher-dimensional network structural information to improve the recommendation algorithm, by using metrics such as closeness centrality, eigenvector centrality, Katz centrality, and PageRank These metrics not only take the number of neighboring nodes into account but also contain the importance of neighboring nodes as well as their structural information.
The method proposed in this article shows that applying different network structural centralities improves the recommendation performance. The results of the HC algorithm obtained with all the tested network structural centralities show an improvement in performance in the range of 184%–280% (the only exception is that using eigenvector centrality causes a decrease in accuracy). For the MD algorithm, the differences in the results obtained after applying different metrics are small. Among them, the optimal results were obtained for three metrics: degree, eigenvector centrality, and PageRank. Meanwhile, the hybrid algorithm has overall better prediction results, but the results of some metrics are likely to be influenced by the weighting factor λ, and even better results could be obtained after adjusting the parameters.
Overall, in this article, we show that the centrality of networks contains higher-order structural information of the network topology than the traditional adoption of degree. Surprisingly, the recommendation algorithms incorporating such centralities, especially the heat conduction algorithm will have a significantly improved performance, almost comparable to that of the mass diffusion algorithm.
Data availability statement
Publicly available datasets were analyzed in this study. These data can be found at Stanford Large Network Dataset Collection: https://snap.stanford.edu/data/.
Author contributions
YK designed the research; YH and XZ collected the data; Cheng Wang, YK, and YH analyzed the data; and XZ performed the visualization. All authors wrote the manuscript.
Funding
This work was supported by the Research Funds for the Central Universities from Beijing University of Posts and Telecommunications, under grant No. 505022019, and NO. 500422415, and Research Innovation Fund for College Students of Beijing University of Posts and Telecommunications.
Conflict of interest
The authors declare that the research was conducted in the absence of any commercial or financial relationships that could be construed as a potential conflict of interest.
Publisher’s note
All claims expressed in this article are solely those of the authors and do not necessarily represent those of their affiliated organizations, or those of the publisher, the editors, and the reviewers. Any product that may be evaluated in this article, or claim that may be made by its manufacturer, is not guaranteed or endorsed by the publisher.
References
1. Lü L, Medo M, Yeung CH, Zhang YC, Zhang ZK, Zhou T. Recommender systems. Phys Rep (2012) 5191:1–49. doi:10.1016/j.physrep.2012.02.006
2. Resnick P, Iacovou N, Suchak M, Bergstrom P, Riedl JG. An open architecture for collaborative filtering of netnews. In: Proceedings of the 1994 ACM conference on Computer supported cooperative work; Chapel Hill North Carolina USA (1994). p. 175–86.
3. Sarwar B, Karypis G, Konstan J, Riedl J. Item-based collaborative filtering recommendation algorithms. In: Proceedings of the 10th international conference on World Wide Web; Hong Kong Hong Kong (2001). p. 285–95.
4. Breese JS, Heckerman D, Kadie C. Empirical analysis of predictive algorithms for collaborative filtering (2013). Available from: https://arxiv.org/ftp/arxiv/papers/1301/1301.7363.pdf.1301.7363
5. Goldberg D, Nichols D, Oki BM, Terry D. Using collaborative filtering to weave an information tapestry. Commun ACM (1992) 3512:61–70. doi:10.1145/138859.138867
6. Ungar LH, Foster DP. Clustering methods for collaborative filtering. AAAI Workshop recommendation Syst (1998) 1:114–29.
7. Ungar L, Foster DP. A formal statistical approach to collaborative filtering. CONALD’98 (1998). Available from: https://www.cis.upenn.edu/∼ungar/Datamining/Publications/CONALD.pdf.
8. Azar Y, Fiat A, Karlin A, McSherry F, Saia J Spectral analysis of data. In: Proceedings of the thirty-third annual ACM symposium on Theory of computing: San Jose California USA (2001). 619–26.
9. Koren Y, Bell R, Volinsky C. Matrix factorization techniques for recommender systems. Computer (2009) 42(8):30–7. doi:10.1109/mc.2009.263
10. Blei DM, Ng AY, Jordan MI. Latent Dirichlet allocation. J machine Learn Res (2003) 3(Jan):993–1022.
11. Keshavan R, Montanari A, Oh S. Matrix completion from a few entries. IEEE Trans Inf Theor (2010) 56(6):2980–98. doi:10.1109/tit.2010.2046205
12. Albert R, Barabási AL. Statistical mechanics of complex networks. Rev Mod Phys (2002) 74(1):47–97. doi:10.1103/revmodphys.74.47
13. Castellano C, Fortunato S, Loreto V. Statistical physics of social dynamics. Rev Mod Phys (2009) 81(2):591–646. doi:10.1103/revmodphys.81.591
14. Zhang YC, Blattner M, Yu YK. Heat conduction process on community networks as a recommendation model. Phys Rev Lett (2007) 99(15):154301. doi:10.1103/physrevlett.99.154301
15. Zhou T, Ren J, Medo M, Zhang YC. Bipartite network projection and personal recommendation. Phys Rev E (2007) 76(4):046115. doi:10.1103/physreve.76.046115
16. Zhang YC, Medo M, Ren J, Zhou T, Li T, Yang F. Recommendation model based on opinion diffusion. Europhys Lett (2007) 80(6):68003. doi:10.1209/0295-5075/80/68003
17. Liu JH, Zhang ZK, Chen L, Liu C, Yang C, Wang X. Gravity effects on information filtering and network evolving. PloS one (2014) 9(3):e91070. doi:10.1371/journal.pone.0091070
18. Zeng W, Zeng A, Liu H, Shang MS, Zhou T. Uncovering the information core in recommender systems. Sci Rep (2014) 4(1):6140–8. doi:10.1038/srep06140
19. Zhang QM, Zeng A, Shang MS. Extracting the information backbone in online system. PloS one (2013) 8(5):e62624. doi:10.1371/journal.pone.0062624
20. Zhou T, Kuscsik Z, Liu JG, Medo M, Wakeling JR, Zhang YC. Solving the apparent diversity-accuracy dilemma of recommender systems. Proc Natl Acad Sci U S A (2010) 107(10):4511–5. doi:10.1073/pnas.1000488107
21. Fiasconaro A, Tumminello M, Nicosia V, Latora V, Mantegna RN. Hybrid recommendation methods in complex networks. Phys Rev E (2015) 92(1):012811. doi:10.1103/physreve.92.012811
22. Stojmirović A, Yu YK. Information flow in interaction networks. J Comput Biol (2007) 14(8):1115–43. doi:10.1089/cmb.2007.0069
23. Liu JG, Zhou T, Guo Q. Information filtering via biased heat conduction. Phys Rev E (2011) 84(3):037101. doi:10.1103/physreve.84.037101
24. Shang MS, Jin CH, Zhou T, Zhang YC. Collaborative filtering based on multi-channel diffusion. Physica A: Stat Mech its Appl (2009) 388(23):4867–71. doi:10.1016/j.physa.2009.08.011
25. Zhou T, Jiang LL, Su RQ, Zhang YC. Effect of initial configuration on network-based recommendation. Europhys Lett (2008) 81(5):58004. doi:10.1209/0295-5075/81/58004
26. Lü L, Liu W. Information filtering via preferential diffusion. Phys Rev E (2011) 83(6):066119. doi:10.1103/physreve.83.066119
27. Liu JG, Shi K, Guo Q. Solving the accuracy-diversity dilemma via directed random walks. Phys Rev E (2012) 85(1):016118. doi:10.1103/physreve.85.016118
28. Zhang ZK, Liu C. A hypergraph model of social tagging networks. J Stat Mech (2010) 10:P10005. doi:10.1088/1742-5468/2010/10/p10005
29. Zhang ZK, Zhou T, Zhang YC. Tag-aware recommender systems: A state-of-the-art survey. J Comput Sci Technol (2011) 26(5):767–77. doi:10.1007/s11390-011-0176-1
30. Yu F, Koltun V. Multi-scale context aggregation by dilated convolutions. Available from: https://arxiv.org/abs/1511.07122.
31. Ren X, Lü L, Liu R, Zhang J. Avoiding congestion in recommender systems. New J Phys (2014) 16(6):063057. doi:10.1088/1367-2630/16/6/063057
32. Deng X, Wu L, Ren X, Jia C, Zhong Y, Lü L. Inferring users' preferences through leveraging their social relationships. In: Proceedings of the IECON 2017-43rd Annual Conference of the IEEE Industrial Electronics Society; Beijing, China (October 2017). p. 5830–6.
33. Davis J, Goadrich M. The relationship between Precision-Recall and ROC curves. In: Proceedings of the 23rd international conference on Machine learning; Pittsburgh Pennsylvania USA (June 2006). p. 233–40.
34. Zhang Y-C, Marcel B, Yi-Kuo Y. Heat conduction process on community networks as a recommendation model. Phys Rev Lett (2007) 99(15):154301. doi:10.1103/physrevlett.99.154301
35. Ren ZM, Kong Y, Shang MS, Zhang YC. A generalized model via random walks for information filtering. Phys Lett A (2016) 380(34):2608–14. doi:10.1016/j.physleta.2016.06.009
36. Chea E, Livesay DR. How accurate and statistically robust are catalytic site predictions based on closeness centrality? Bmc Bioinformatics (2007) 8(1):153–14. doi:10.1186/1471-2105-8-153
37. Gabriel P, Francis Narin . Citation influence for journal aggregates of scientific publications: Theory, with application to the literature of physics. Inf Process Management (1976) 12(5):297–312. doi:10.1016/0306-4573(76)90048-0
38. Katz L. A new status index derived from sociometric analysis. Psychometrika (1953) 18:39–43. doi:10.1007/bf02289026
Keywords: recommendation system, centrality, complex network, diffusion model, collaborative filtering
Citation: Kong Y, Hu Y, Zhang X and Wang C (2022) Structural centrality of networks can improve the diffusion-based recommendation algorithm. Front. Phys. 10:1018781. doi: 10.3389/fphy.2022.1018781
Received: 13 August 2022; Accepted: 20 September 2022;
Published: 17 October 2022.
Edited by:
Jianguo Liu, Shanghai University of Finance and Economics, ChinaReviewed by:
Xiaolong Ren, University of Electronic Science and Technology of China, ChinaZhuoming Ren, Hangzhou Normal University, China
Copyright © 2022 Kong, Hu, Zhang and Wang. This is an open-access article distributed under the terms of the Creative Commons Attribution License (CC BY). The use, distribution or reproduction in other forums is permitted, provided the original author(s) and the copyright owner(s) are credited and that the original publication in this journal is cited, in accordance with accepted academic practice. No use, distribution or reproduction is permitted which does not comply with these terms.
*Correspondence: Yixiu Kong, eWl4aXUua29uZ0BidXB0LmVkdS5jbg==; Yizhong Hu, a3VhaUBidXB0LmVkdS5jbg==
 Yixiu Kong
 Yizhong Hu
 Xinyu Zhang2
