 Jiarui Dong
 Yuping He2†
 Yixiu Kong
95% of researchers rate our articles as excellent or good
Learn more about the work of our research integrity team to safeguard the quality of each article we publish.
Find out more
ORIGINAL RESEARCH article
Front. Phys. , 01 November 2022
Sec. Social Physics
Volume 10 - 2022 | https://doi.org/10.3389/fphy.2022.1018704
This article is part of the Research Topic Social Economic Networks View all 10 articles
Online videos have become the most popular method to obtain information for the public in recent years, such as TikTok and YouTube, and regional sites like Bilibili and Douyin. Compared with its growing influence, the analysis of user behavior on video sites is still less investigated. Herein, we fetch the video data from Bilibili.com and analyze the video views, comments, and other behaviors on the website. We found that the description model based on the Hawkes process can accurately predict the video views, which suggests that on the Bilibili website, the self-incentive mechanism of information cascade diffusion plays a decisive role in online views. Meanwhile, we also found that the view increment of the videos during the same period of time conforms to the general power-law distribution.
The online video platform, as an emerging tool for accessing information, has drawn significant attention from the commercial industry to scientific communities. However, it is still challenging to predict which videos or information will become popular in the near future. The basis for determining future popular videos is the future popularity of the video, which is usually measured by the number of times the video is played within a limited period of time. Therefore, video popularity prediction has become the key to discovering future popular videos. The goal of video popularity prediction is to predict the number of times a video will be played in the future based on the data available before or in the early stages of release [1–4]. Predicting the number of videos played in the future can not only help discover future popular videos but also directly help optimize strategies for online video services. [5] Shows a typical case of an optimizing service strategy using video popularity prediction. The researchers updated the caching strategy based on the predicted future views of the video. Compared with the LFU-/LRU-based caching strategy used in the previous online video service system, this strategy has significantly improved the caching efficiency.
In addition to the continuous pursuit of higher performance, video popularity prediction research also needs to consider the practicability of the model. Herein, our goal is to solve a series of problems in video popularity prediction research and contribute to the better application of this technology in online video services.
The related research on video popularity prediction started more than 10 years ago, and the first video popularity prediction model was formally proposed in 2010 [6]. Existing video popularity prediction models can be roughly divided into three main categories according to the types of tasks they target, data usage, and modeling methods for video popularity: prediction models based on mapping of popularity values; prediction models based on popularity time series; and the cold start prediction model. The prediction model based on the heat value mapping is the earliest proposed video heat prediction model. This type of model is generally implemented by modeling the distribution of the cumulative number of future video views with respect to the cumulative number of early video views using a mathematical function [6–8]. Subsequent proposed models of this type also use features partially extracted from the meta-information of the video [9–11]. With the introduction of multimodal features, the modeling methods of models based on heat value mapping have gradually become diversified, and both regression models and neural networks have been used to build such models. At the beginning of the research on video popularity prediction, the prediction model based on the popularity value mapping was effective in the popularity prediction task in the early stage of video service development. However, social information has a very limited impact on the number of videos played at that time. The early view number of a video can effectively reflect the viewing tendency of the user group toward the video. However, compared with the later proposed prediction model based on the popularity time series, the model based on the popularity value mapping lacks the sufficient ability to identify the trend of the number of videos played because it regards the number of videos played as a single cumulative value. However, this type of model has lower complexity and data requirements than the other two models, so it is easier to be used and deployed in online video service systems.
The second type of model regards the number of videos played as a sequence related to the video survival time and achieves prediction by modeling the correlation between the sequence of early video views and future views [12–14]. Time-series-based forecasting models usually assume that the number of videos played in different time periods early in their release is of different importance for inferring their future video views [15]. By modeling the sequence of video views, more information about the dynamics of early video views is utilized by the prediction model, so that the second type of model has better prediction performance than the other two types of models. Furthermore, since the second type of model treats the number of videos played as a sequence about the video survival time, it is possible to introduce more features sensitive to the video survival time. These features have been proven by existing research to be effective in helping models predict the possible burst of video views in future video viewing data [16–20]. In recent years, with the integration of social networks and online video services, time-series-based prediction models have also begun to extract multimodal features from diversified information, including social information, to cope with the impact of social information on video views [21–25]. The introduction of multimodal features, including social features, not only improves the performance of prediction models based on popularity time series but also makes such models increasingly complex, causing them to gradually lose their practicability in the video service environment. In today’s online video service systems, in most cases, only the most basic prediction models based on popularity time series such as MLR and ARMA are still used.
On the other hand, Hawkes proposed a self/mutual-exciting process in his study [26]. The main characteristic of non-Markovian (with memory) self-exciting point processes is that the occurrence of any historical event affects the probability of future events for a long time and may lead to critical emergencies. The Hawkes process is an example of this. The standard linear self-excited Hawkes point process is a first-order non-Markovian stochastic model of intermittent explosive dynamics. The nonlinear Hawkes process is introduced to better describe the excitation (positive feedback) and inhibition (negative feedback) effects between events. The theoretical findings of [27] implied that the nonlinear Hawkes process has an asymptotically universal Zipf’s law in the case of a mark distribution with zero mean.
In this study, we collect a new dataset containing various temporal data from openly accessible data from Bilibili. com. We propose that combined with the Danmaku data, the model based on the Hawkes process [28] can be used to evaluate the popularity of a video on Bilibili.com. In addition, the normalized popularity follows a power-law distribution, suggesting that it has a close relationship with the self-exciting Hawkes process on the online video platform.
We obtained the following datasets from the official website of Bilibili.Com.
The dataset includes 224,672 uploaders, 1,425,882 videos, and 308,385 tags. The time span is from 2021.12 to 2022.2. There are a total of 1,425,882 records from the knowledge section of the Bilibili.com video website. There are 1,209,370 videos with tags, and the rest are videos without tags. Each record includes the following 17 fields, shown in Table 1.
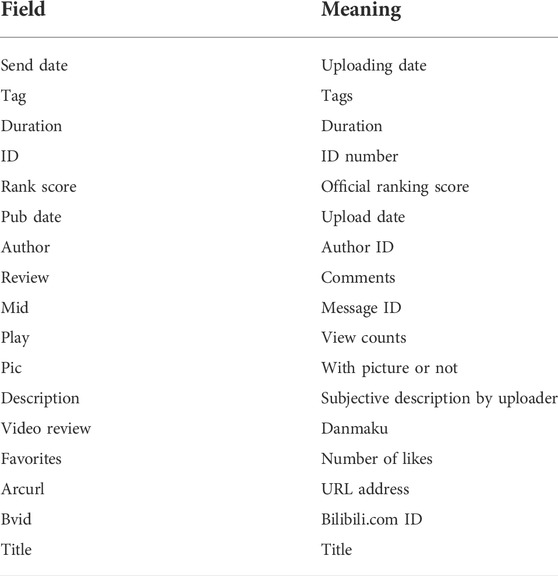
TABLE 1. User and video metadata.
This dataset is obtained from randomly selected 10,000 uploaders with more than 10,000 followers on the Bilibili website and the data of their latest released 50 videos. Videos that are too old will be replaced because uploaders will constantly publish new videos. The dataset starts from 2022.5.1 and ends at 2022.5.8 collects the number of videos played and the number of Danmaku of these videos every 3 hours, with a total of 56 timesteps. The data in each time step contain data from roughly 500,000 videos. The dataset is publicly available at https://github.com/luciidream/Universal-Scaling-behaviour-and-Hawkes-process-of- videos-views-on-Bilibili.com.git.
The Hawkes process is a self-exciting point process [26, 29]. The process has arrivals at times
The function
During the time interval
where
In addition to the video label of the first section of the data, the corresponding one-hot vector of each video is obtained according to the label of each video. Then, all the vectors are combined to obtain a high-order matrix. We then perform singular value decomposition (SVD) on the matrix to reduce dimensionality and use the low-dimensional matrix to cluster videos. Connecting videos of the same class to the center point of the class constitutes a video network, as shown in Figure 1. As our videos are collected randomly from uploaders who have more than 10,000 followers, the figure is used to show the diversity of the topics and human tags and to validate that our data collection is of little bias referring to the topics or tags. The results indicate that there exist several clusters of topics of the videos we collected, and the dataset covers a broad range of topics and tags.
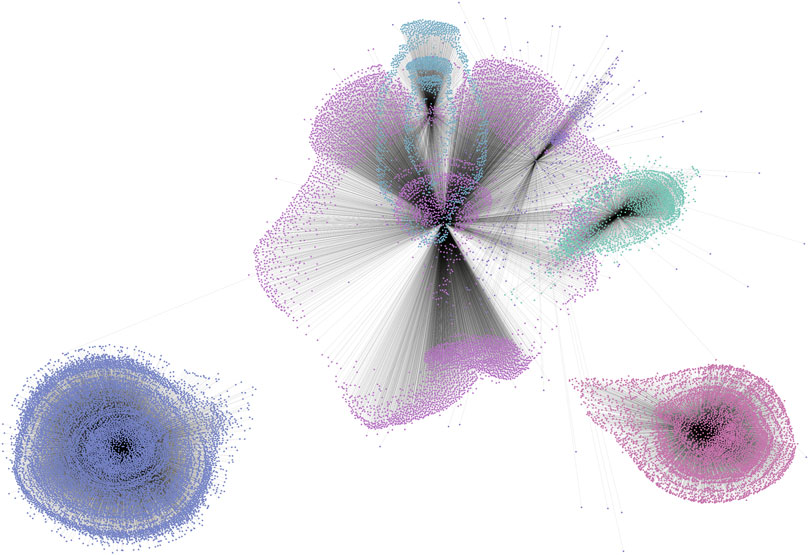
FIGURE 1. Clustering of a video–tag network. Each dot represents a video, and each color represents a unique tag cluster labeled by the uploader. The length represents the distance from the cluster center in the SVD space. The figures show there exist topics that are very distant from each other, and the topics have a wide diversity through the video–tag network. The random selection of videos by uploaders in general does not produce biases of the video content.
We select uploaders who have released new videos in the same period and calculate the ratio of the growth of each person’s latest video at each moment to the total growth at that moment so as to express the influence of the uploader’s work relative to the works of other uploaders. This parameter shows the relative degree of attraction of uploaders toward the whole audience. The relative competitiveness of all creators is fitted according to the power-law distribution, and it is found that the relative competitiveness of the creators approximately obeys the power-law distribution [30], as shown in Figure 2.
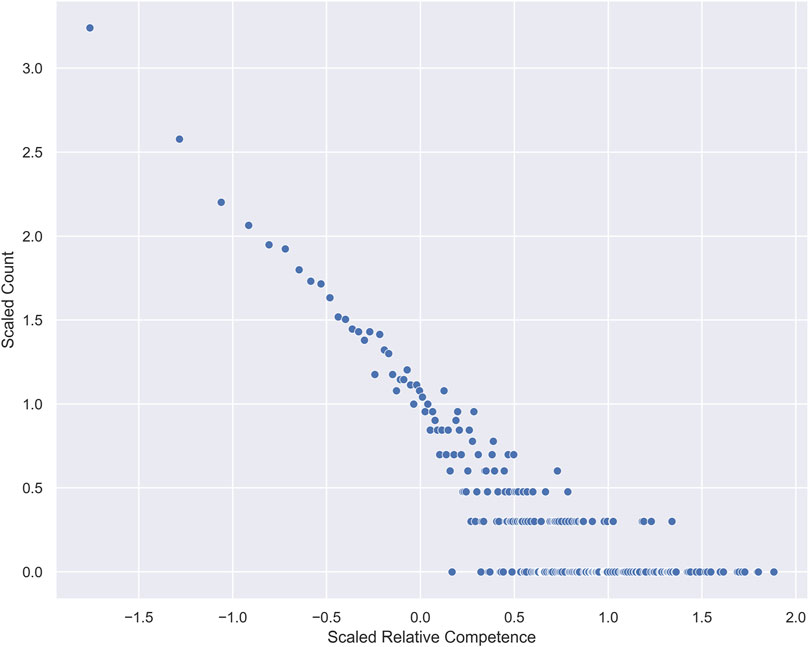
FIGURE 2. Power-law distribution of relative competence. The horizontal and vertical axes are scaled by logarithms.
We also estimate the power-law exponents, and surprisingly, the exponents through different times are all around 1.5, showing a universal scaling behavior, as illustrated in Figure 3. This result has been validated by statistical stability analysis.
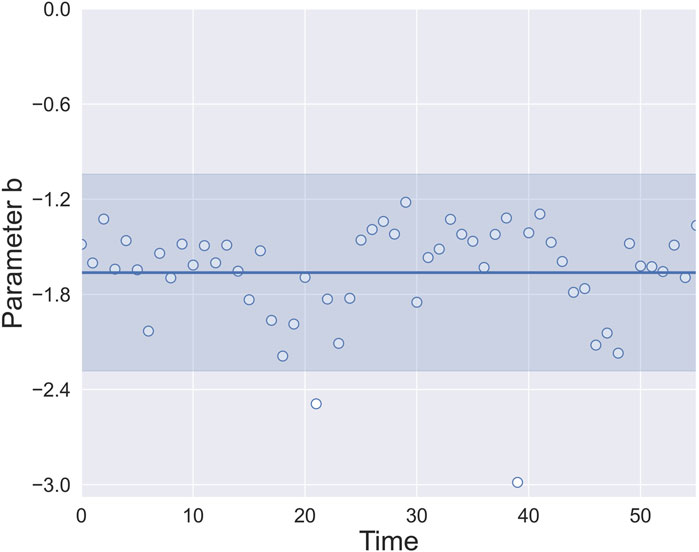
FIGURE 3. Power-law exponents of users’ competence at different times. Parameter b is the exponents obtained by the previous power-law fitting. The solid line indicates the average of the power-law exponents, and the shaded area indicates the standard deviation of the power-law exponents. The data show parameter b is consistently around 1.5, disregarding the timestamps. This shows that relative competence exhibits a universal scaling behavior.
Furthermore, using the video used in the previous section, we normalize the view counts recorded at each moment of each video, summing over the data of all videos and shifting the data to eliminate negative values and obtaining the average variation of the video views. This reveals the average daily views of each video and the mean field view pattern of the videos during their life span, as shown in Figure 4. For simplicity, the curve is well-fitted by a log-normal function, which is in accordance with the suggestion from [31].
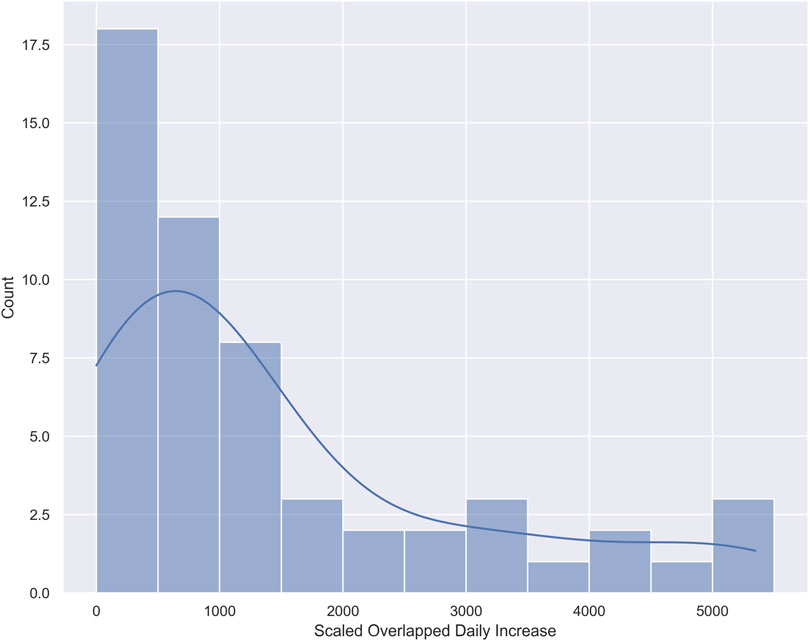
FIGURE 4. View counts of videos daily increase. The blue line is the indication line from a log-normal fitting. This is in accordance with the work of [31].
From the previous introduction of the model, a point process model based on the Hawkes process is used to predict video views. Compared with feature-based prediction methods, the counting process does not require complex feature engineering and additional training, so it can be easily applied to real-time systems. The results show that, with the Danmaku data from the temporal dataset, our model can predict the popularity precisely even in the far future. The results are shown in Figures 5, 6.
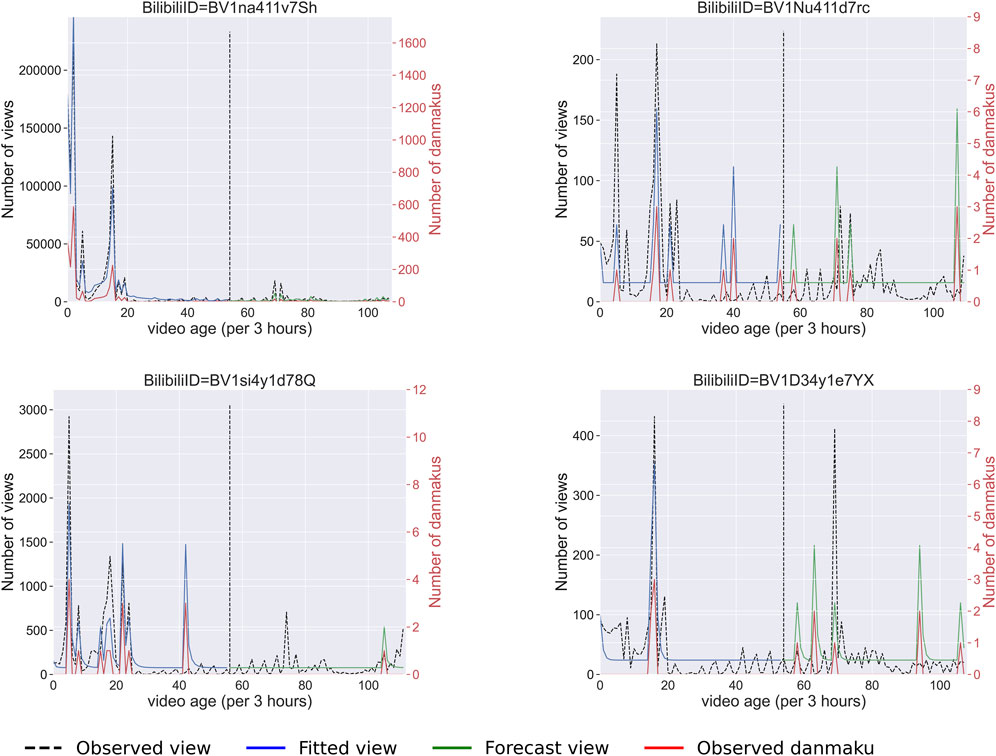
FIGURE 5. Hawkes model fitting on four Bilibili videos. The dashed line indicates where the prediction starts. The blue line is the fitted view curve, and the dashed line shows the original data. The green line is the prediction based on our Hawkes process model. The red line shows the Danmaku counts from the data.
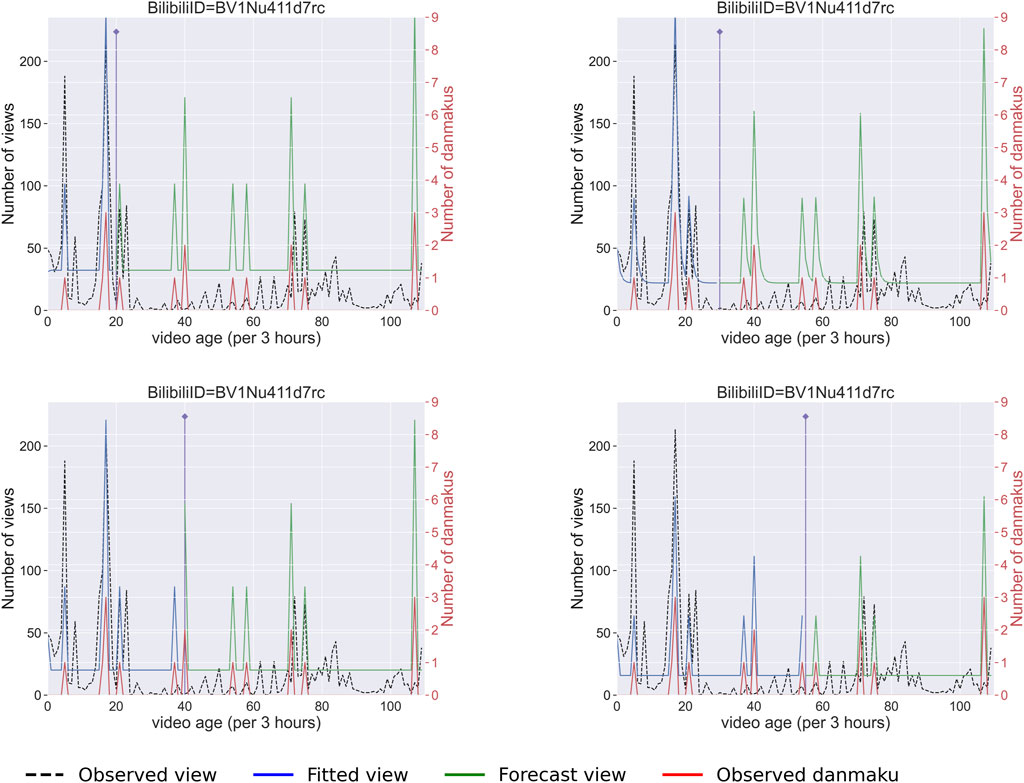
FIGURE 6. Predictions on the same video Bilibili ID BV1Nu411d7rc by varying the size of the training set. The four subplots represent different results corresponding to 20%, 30%, 40%, and 50% as training sets. The purple line indicates where the prediction starts. The blue line is the fitted view curve, and the dashed line shows the original data. The green line is the prediction based on our Hawkes process model. The red line shows the Danmaku counts from the data.
Figure 5 shows the Hawkes model results of four randomly picked videos that are representative of the wellness of fitting. The videos have very different fundamental statistics and thus explain our method is general. The dashed line is the separation line of data used to train the model and obtain parameters and the test data that are used for evaluation of the results. The results show that our model can accurately predict the location of peaks in the video views in the far future, but the accuracy of the intensity of the peak varies from video to video.
Figure 6 shows the results of the Hawkes model fitting on the same video by varying the size of the training set. The four subplots represent the results using 20%, 30%, 40%, and 50% of the time span as training sets, respectively. The results indicate that the predicted position of peaks by our method is resilient with different sizes of training sets. Also, the predicted intensity can improve with a larger training set.
It is worthwhile to mention that by adopting the model from [28], the parameters obtained from the fitting are not stable, as shown in Figure 7, suggesting the correlation of the six parameters. Further investigation can be conducted in this direction to clarify how these parameters influence each other.
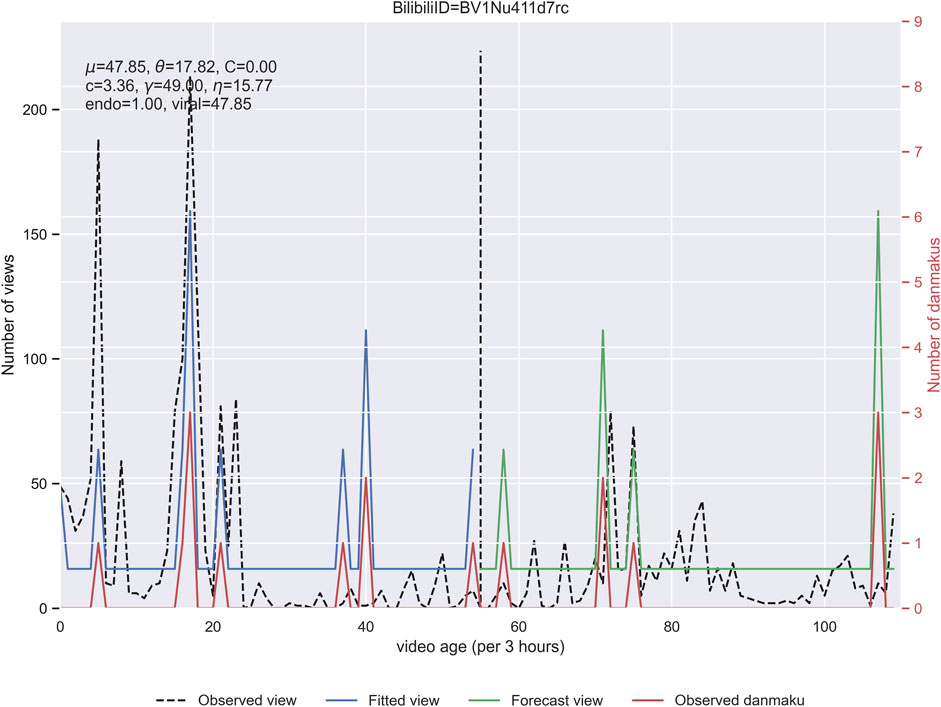
FIGURE 7. Parameters in the model fitting on video Bilibili ID BV1D34y1e7YX. The parameters in the fitting are listed at the top left corner. Parameters
In this study, our results show that the view counts of online videos on Bilibili.com are significantly determined by the point processes, such as the Hawkes process. The relative view counts during a given time span among all videos (namely, the uploaders’ relative competence) follow a universal scaling behavior. The video view model based on the Hawkes process effectively realizes the simultaneous prediction of video views. On one hand, it is conducive to the accurate placement of advertisements and improves commercial service quality, and on the other hand, by analyzing the results, it can provide decision support for content management or provide a basis for network storage optimization or expansion, low network storage utilization, and avoid problems such as large capacity redundancy caused by expansion, thereby reducing operating costs and producing practical application value.
Sornette et al. [27] studied the relationship between the universal power-law distribution and the nonlinear Hawkes process and proved that the Hawkes process can form the power-law distribution of events through theoretical analysis. This effect is also observed in our data, where the video views at different times and the relative competence indicators of uploaders also form a power-law distribution with a relatively stable power-law behavior. Sornette’s theory states that the Hawkes process resembles a nonlinear self-excited process, in which the properties arise from a complex interaction between a multiplicative process, memory, and endogeneity or reflexivity. The Hawkes model fitting results show that in our context, a video’s current views and its historical view counts, as well as the number of Danmaku comments, have a nonlinear mutualistic interacting process. The specific dynamics of the process is complex and awaits further study.
In summary, we collected a new set of data, which recorded the video view data on Bilibili.com, including the temporal records of video views, the number of Danmaku comments, and the metadata of uploaders and videos. The social networks formed by these data will help further explore the complex interaction between videos, users, and Danmaku comments. It also helps develop new models and verify existing theories, which contribute to the knowledge of understanding social interactions and networks. The Hawkes model analysis of the time-series data shows that there exists a Hawkes process with memory characteristics with the video views on Bilibili.com, and at the same time, the consistent power-law distribution characteristics are observed in many data statistics. This connection can be enlightened by the related theory by Sornette et al. Despite the analytical analysis that is specifically based on three assumptions, the general explanation of how the Hawkes process can produce power-law distribution suggests the possibility of a direct causal relationship, irrespective of the theoretical assumptions made in [27]. In the near future, a more general model can be developed to further clarify the phenomena with this newly collected dataset.
The dataset is publicly available at https://github.com/luciidream/Universal-Scaling-behaviour-and-Hawkes-process-of- videos-views-on-Bilibili.com.git.
YK designed the research; HD and JD collected the data; JD, YH, and JS analyzed the data; HD and JD performed the visualization; all authors wrote the manuscript.
This work was supported by Research Funds for the Central Universities from the Beijing University of Posts and Telecommunications under grant nos. 505022019 and 500422415 and Research Innovation Fund for College Students of the Beijing University of Posts and Telecommunications.
The authors declare that the research was conducted in the absence of any commercial or financial relationships that could be construed as a potential conflict of interest.
All claims expressed in this article are solely those of the authors and do not necessarily represent those of their affiliated organizations, or those of the publisher, the editors, and the reviewers. Any product that may be evaluated in this article, or claim that may be made by its manufacturer, is not guaranteed or endorsed by the publisher.
1. Yu H, Zheng D, Zhao BY, Zheng W. Understanding user behavior in large-scale video-on-demand systems. SIGOPS Oper Syst Rev (2006) 40(4):333–44. doi:10.1145/1218063.1217968
2. Avramova Z, Wittevrongel S, Bruneel H, De Vleeschauwer D. Analysis and modeling of video popularity evolution in various online video content systems: Power-law versus exponential decay. In: Proceedings of the 2009 First International Conference on Evolving Internet; 23-29 August 2009; Cannes/La Bocca, France (2009). doi:10.1109/INTERNET.2009.22
3. Niu D, Liu Z, Li B, Zhao S. Demand forecast and performance prediction in peer-assisted on-demand streaming systems. In: Proceedings of the 2011 Proceedings IEEE INFOCOM; 10-15 April 2011; Shanghai, China (2011). doi:10.1109/INFCOM.2011.5935196
4. Mahajan V, Muller E, Bass FM. New product diffusion models in marketing: A review and directions for research. J Marketing (1990) 54(1):1–26. doi:10.2307/1252170
5. Hu W, Wang Z, Ma M, Sun LF. Edge video cdn: A wi-fi content hotspot solution. J Comput Sci Technol (2016) 31(6):1072–86. doi:10.1007/s11390-016-1683-x
6. Szabo G, Huberman BA. Predicting the popularity of online content. Commun ACM (2010) 53(8):80–8. doi:10.1145/1787234.1787254
7. Lerman K, Hogg T. Using a model of social dynamics to predict popularity of news. ’10. In: Proceedings of the 19th International Conference on World Wide Web; April 2010; Raleigh, North Carolina, USA (2010). doi:10.1145/1772690.1772754
8. Figueiredo F, Benevenuto F, Almeida JM. The tube over time: Characterizing popularity growth of youtube videos. In: ’11, Proceedings of the Fourth ACM International Conference on Web Search and Data Mining; February 2011; Hong Kong, China (2011). doi:10.1145/1935826.1935925
9. Lee JG, Moon S, Salamatian K. Modeling and predicting the popularity of online contents with Cox proportional hazard regression model. Neurocomputing (2012) 76(1):134–45. doi:10.1016/j.neucom.2011.04.040
10. Bandari R, Asur S, Huberman BA. The pulse of news in social media: Forecasting popularity. Proc Int AAAI Conf Web Soc Media (2012) 6(1):26–33. doi:10.48550/arXiv.1202.0332
11. Ahmed M, Spagna S, Huici F, Niccolini S. A peek into the future: Predicting the evolution of popularity in user generated content. Proc sixth ACM Int Conf Web search Data mining (2013) 607–16. doi:10.1145/2433396.2433473
12. Asur S, Huberman BA, Szabo G, Wang C. Trends in social media: Persistence and decay. Proc Int AAAI Conf Web Soc Media (2011) 5(1):434–7. doi:10.48550/arXiv.1102.1402
13. Wu J, Zhou Y, Chiu DM, Zhu Z. Modeling dynamics of online video popularity. IEEE Trans Multimedia (2016) 18(9):1882–95. doi:10.1109/tmm.2016.2579600
14. Ratkiewicz J, Fortunato S, Flammini A, Menczer F, Vespignani A. Characterizing and modeling the dynamics of online popularity. Phys Rev Lett (2010) 105(15):158701. doi:10.1103/physrevlett.105.158701
15. Pinto H, Almeida JM, Gonçalves MA. Using early view patterns to predict the popularity of youtube videos. In: ’13, Proceedings of the Sixth ACM International Conference on Web Search and Data Mining; February 2013; Rome, Italy (2013).
16. Hennig-Thurau T, Wiertz C, Feldhaus F. Does twitter matter? The impact of microblogging word of mouth on consumers’ adoption of new movies. J Acad Mark Sci (2015) 43(3):375–94. doi:10.1007/s11747-014-0388-3
17. Matsubara Y, Sakurai Y, Prakash BA, Li L, Faloutsos C. Rise and fall patterns of information di-usion: Model and implications. KDD. In: 12 Proceedings of the 18th ACM SIGKDD International Conference on Knowledge Discovery and Data Mining; August 2012; Beijing, China (2012).
18. Li C, Liu J, Ouyang S. Characterizing and predicting the popularity of online videos. IEEE Access (2016) 4:1630–41. doi:10.1109/access.2016.2552218
19. Tatar A, De Amorim MD, Fdida S, Antoniadis P, A survey on predicting the popularity of web content[J]. J Internet Serv Appl, 2014, 5(1): 8, doi:10.1186/s13174-014-0008-y
20. Deng Z, Yan M, Sang J, Xu C. Twitter is faster: Personalized time-aware video recommendation from twitter to YouTube. ACM Trans Multimedia Comput Commun Appl (2015) 11(2):31–3123. doi:10.1145/2637285
21. Xu J, Van Der Schaar M, Liu J, Li H. Forecasting popularity of videos using social media. IEEE J Sel Top Signal Process (2015) 9(2):330–43. doi:10.1109/jstsp.2014.2370942
22. Fontanini G, Bertini M, Del Bimbo A. Web video popularity prediction using sentiment and content visual features. ’16. In: Proceedings of the 2016 ACM on International Conference on Multimedia Retrieval; June 2016; New York, USA (2016).
23. Hoiles W, Aprem A, Krishnamurthy V. Engagement and popularity dynamics of YouTube videos and sensitivity to meta-data. IEEE Trans Knowl Data Eng (2017) 29(7):1426–37. doi:10.1109/tkde.2017.2682858
24. Trzciński T, Rokita P. Predicting popularity of online videos using support vector regression. IEEE Trans Multimedia (2017) 19(11):2561–70. doi:10.1109/tmm.2017.2695439
25. Chen X, Chen J, Ma L, Yao J, Liu W, Luo J, Zhang T. Fine-grained video attractiveness prediction using multimodal deep learning on a large real-world dataset. In: 18 Companion Proceedings of the Web Conference 2018; April 2018; Lyon, France (2018).
26. Hawkes AG. Spectra of some self-exciting and mutually exciting point processes. Biometrika (1971) 58(1):83–90. doi:10.1093/biomet/58.1.83
27. Kanazawa K, Sornette D. Ubiquitous power law scaling in nonlinear self-excited Hawkes processes. Phys Rev Lett (2021) 127(18):188301. doi:10.1103/physrevlett.127.188301
28. Rizoiu MA, Xie L, Sanner S, Cebrian M, Yu H, Van Hentenryck P. Expecting to be HIP: Hawkes intensity processes for social media popularity. In: Proceedings of the 26th International Conference on World Wide Web; April 2017; Australia (2017).
30. Albert R, Barabási AL. Statistical mechanics of complex networks. Rev Mod Phys (2002) 74(1):47–97. doi:10.1103/revmodphys.74.47
Keywords: temporal social networks, Hawkes process, scaling behavior, Danmaku, Bilibili.com
Citation: Dong J, He Y, Song J, Ding H and Kong Y (2022) Universal scaling behavior and Hawkes process of videos’ views on Bilibili.com. Front. Phys. 10:1018704. doi: 10.3389/fphy.2022.1018704
Received: 13 August 2022; Accepted: 17 October 2022;
Published: 01 November 2022.
Edited by:
Jianguo Liu, Shanghai University of Finance and Economics, ChinaReviewed by:
Long Guo, China University of Geosciences, ChinaCopyright © 2022 Dong, He, Song, Ding and Kong. This is an open-access article distributed under the terms of the Creative Commons Attribution License (CC BY). The use, distribution or reproduction in other forums is permitted, provided the original author(s) and the copyright owner(s) are credited and that the original publication in this journal is cited, in accordance with accepted academic practice. No use, distribution or reproduction is permitted which does not comply with these terms.
*Correspondence: Yixiu Kong, eWl4aXUua29uZ0BidXB0LmVkdS5jbg==
†These authors have contributed equally to this work
Disclaimer: All claims expressed in this article are solely those of the authors and do not necessarily represent those of their affiliated organizations, or those of the publisher, the editors and the reviewers. Any product that may be evaluated in this article or claim that may be made by its manufacturer is not guaranteed or endorsed by the publisher.
Research integrity at Frontiers
Learn more about the work of our research integrity team to safeguard the quality of each article we publish.