- 1Big Data and Internet of Things Research Center, China University of Mining and Technology, Beijing, China
- 2Key Laboratory of Intelligent Mining and Robotics, Ministry of Emergency Management, Beijing, China
We propose a passenger flow detection method for dense areas of subway stations to address the current situation that existing pedestrian detection models cannot meet the real-time performance requirements in subway applications and lack validation in multiple subway scenarios. First, we designed the MPDNet model, which uses PVT-small to extract features and an improved feature pyramid network (FPN) for upsampling using the adaptively spatial feature fusion (ASFF) algorithm to retain more local information in the output of the FPN. Second, to better evaluate the performance of models in the metro, we collected subway surveillance video data and proposed the MetroStation dataset. Finally, we trained and evaluated the performance of the MPDNet model on the MetroStation dataset. We compare our method with several common object detection models on the MetroStation dataset, using mAP and frames per second (FPS) to verify its accuracy. The experiments on the MetroStation dataset demonstrated that the MPDNet performed well and satisfied inference speed requirements in metro passenger flow detection.
Introduction
The demand for transportation capacity increases with the continuous expansion of the scale of cities. As an integral part of public transportation in large cities, the metro system plays an important role in improving traffic capacity and relieving traffic pressure. Therefore, metro construction has become the focus of many cities. Rail transportation has gradually won the approval of passengers because of its high capacity, punctuality, safety, and comfort.
At present, the scale of the metro network is expanding. It shows the uneven distribution of passenger flow in the metro network, with high traffic volume and passenger flow during the morning and evening rush hours. This means the instantaneous passenger flow of a metro station has a large peak that could lead to trampling accidents during the peak period. This peak affects the safe and stable operation of the subway. Therefore, obtaining passenger flow data in a timely and accurate method plays an important role in supporting operational decisions and ensuring the safe and efficient operation of the metro.
The automatic fare collection system (AFC) is the most common and widely used method to get passenger flow information. The core of the AFC is to collect data from gate machines and then process the data to obtain the location and timing of passengers entering and exiting the stations, thus analyzing the spatial and temporal distribution of passenger flow. The flow data obtained in this way is accurate, but it takes time to process and analyze after collecting raw data from the AFC. In addition, this method cannot obtain the passenger flow data from internal areas of stations such as station halls, transfer channels, and platforms.
In China, metro stations are fully covered by video surveillance systems. Many metro operators assign specialized staff to observe the surveillance video in real time to obtain information about the passenger flow in each area of the station [1]. This labor-based approach not only relies heavily on staff experience but also does not enable quantifying passenger flow data. Moreover, this type of passenger flow information contains subjective information that can produce bias in the information propagation [2]. Therefore, many researchers have began to use real-time surveillance video systems to get passenger flow data. Hu et al. [3] proposed a crowd counting method on subway platforms. It combined a weighted area feature that considers perspective and an improved gradient feature that could indicate crowd density to calculate the number of passengers. This method solves the problem of overlapping passengers and calculates the number of people in a dense crowd more accurately. However, its performance is easily affected by the quality of the images and different crowd density levels. Xie et al. [4] used the Dempster–Shafer theory (D–S theory) to improve the average background model for background modeling, reduced the weight of irrelevant background caused by moving objects, and then used the feature of image connected domain for passenger flow recognition. This method has fast inference speed but is greatly influenced by the environment and has different performance under different passenger flow densities.
With the concepts of intelligent transportation and the development of deep learning in recent years, many researchers have started to use convolutional neural network (CNN) methods for passenger flow detection. The deep learning-based methods have greatly improved the accuracy of passenger flow detection and reduced the influence of environmental changes on the performance of models. Zhang et al. [5] proposed MPCNet, which uses CNN to extract features and then uses a multi-column atrous CNN with atrous spatial pyramid pooling to estimate the crowd size. It can aggregate multi-scale contextual information in crowded scenes. This method has high detection accuracy but slow inference speed, so it is difficult to meet the requirement of real-time detection in metro stations. Later, Guo et al. [6] proposed MetroNet to detect highly obscured passengers efficiently and also proposed Tiny MetroNet to achieve a better balance of accuracy, memory, and speed on resource-constrained platforms. Liu et al. [7] designed a novel MSAC block to generate informative and semantic convolutional features and proposed MetroNext based on MSAC. This method can achieve real-time detection of passengers on and off the subway by combining MetroNexts and an optical flow algorithm. Yang et al. [8] used the attention mechanism CBAM to improve yolov4 and decrease the effect of light on the detection performance. The passenger flow detection methods in these studies are based on CNNs owing to their good trainability and generalization capabilities. Getting real-time passenger flow data both reduces the risk of emergencies and influences passengers’ travel decisions through social network propagation [9]. However, many of these methods do not satisfy the required real-time performance in metro applications and lack validation in the context of multiple metro scenes.
In response to the above problems, we propose the metro passenger detection network (MPDNet) based on a transformer model. It can achieve dense passenger flow detection in metro stations with multiple scenes, focusing on the passenger distortion caused by the installation angle of the metro video surveillance system and inter-passenger occlusion problems. We implement pyramid vision transformer (PVT) as the feature extraction network on RetinaNet. We also improve the feature fusion module with the adaptively spatial feature fusion (ASFF) algorithm. This improvement compensates for the loss of spatial information caused by PVT. Finally, we replace an L1 loss with a generalized intersection over union (GIoU) loss as the regression loss of the bounding box. In addition, we propose the MetroStation dataset based on the video surveillance system data of Beijing metro stations. The MetroStation dataset fills the gap of lacking station scene data in metro station passenger flow detection. The dataset contains images from different camera angles of various areas within the rail stations, with passengers at different sparsity levels labeled in each image. This dataset is of great value for improving the performance and robustness of the model in metro passenger flow detection. Finally, we test our model on the MetroStation dataset and compare it with various other object detection models. The experiments show that our method has both better accuracy and good real-time performance.
Related work
CNN-based objection detection
The development of object detection algorithms can be divided into two stages: methods based on manual feature construction and methods based on deep learning models. After 2012, the performance of manual feature methods became saturated, and methods based on manual feature construction entered a bottleneck. The emergence of AlexNet [10] changed the situation. AlexNet was the first method to adopt convolutional neural networks for image classification tasks and achieved better performance than the manual feature-based methods. Since then, computer vision has entered a new era dominated by CNNs. In 2014, Girshick et al. [11] proposed region-based CNN (RCNN), a representative of the two-stage method, which first applied convolutional neural networks to object detection. Later, Fast RCNN [12], and Faster RCNN [13] were proposed to have better detection accuracy and inference speed than RCNN. However, the two-stage method based on classification has a serious drawback of slow inference speed despite its high detection accuracy, so it is not suitable for real-time object detection. This restriction was later removed by YOLO [14]. It directly regresses all information of the bounding box in the output layer and greatly improves the inference speed. After YOLO, one-stage detectors, such as SSD [15] and RetinaNet [16], have emerged continuously. Their excellent detection performance is based on high resolution and multi-scale feature maps.
Transformer-based objection detection
Transformer is a self-attention-based model originally applied in natural language processing (NLP). The excellent performance of bidirectional encoder representations from transformers (BERT) and generative pre-trained transformer 3 (GPT-3) in NLP demonstrates that transformer-based methods have strong computational performance and scalability. Based on the existing model growth, transformer methods show no sign of saturation. Considering the great success of transformer methods in the field of NLP, many researchers started to think about introducing it in computer vision tasks. Carion et al. proposed DETR [17], a full end-to-end detector. It abandoned the anchor generator and non-maximum suppression (NMS) that were commonly used in previous CNN-based detectors and used the transformer encoder-decoder structure to directly consider object detection as a direct set prediction problem. Inspired by the transformer in NLP, vision transformer (ViT) [18] was proposed, which was the first to introduce pure transformer methods in image classification tasks. ViT divides an image into a patch sequence and considers patches as tokens (words) in the NLP task. It was proved that ViT obtains the same or even better results than CNN-based methods for supervised training on large datasets (14 –300 million images). This shows that transformer methods can replace CNN applications as a fundamental component in computer vision. After ViT, research on adopting transformer methods in target detection tasks has sprung up. The Swin transformer [19] is a hierarchical structure that progressively shrinks the output resolution, expanding the receptive field by layer like a CNN. Instead of performing multi-head attention on patch sequences like ViT, the Swin transformer introduced the concept of windows into the transformer to implement the localization of CNN. This approach also reduced the computational complexity caused by self-attention. PVT [20] introduced the pyramid structure into transformer methods and presented a pure transformer backbone for dense prediction tasks. PVT added spatial reduction operation to multi-head attention to form spatial-reduction attention (SRA). SRA greatly reduced the computational and memory cost required for attention operation while keeping the resolution of the feature map and the global receptive field. Replacing ResNet50 with PVT-small as the backbone network of RetinaNet gained better performance at COCO VAL2017, showing that PVT performed better than CNN under the same number of parameters.
Proposed methods
MPDNet structure
Lin et al. [16] attributed the lower detection accuracy of the one-stage detector compared to the two-stage detector to the extremely unbalanced ratio of positive to negative samples. Therefore, they proposed a simple but practical function called focal loss and designed the RetinaNet for object detection. This enables the one-stage detector to match or even surpass the two-stage detector in accuracy.
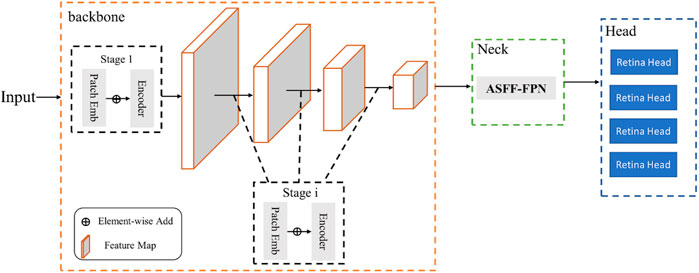
In this study, we built a RetinaNet detector on the MMDetection framework. As shown in Figure 1, the model structure can be divided into three parts: backbone, neck, and head.
RetinaNet is a detection model with better and faster detection performance. It uses ResNet50 as the backbone network, as proposed by He et al. [21] in 2015. ResNet50 is the first to address the progressive degradation of neural networks caused by increasing depth with the residual module. After inputting the processed image, ResNet outputs four different scale feature maps into a feature pyramid network (FPN). The FPN [22] upsamples the bottom map and fuses it with the same scale feature map. The outputs of FPN have high resolution and strong semantic features. RetinaNet is an anchor-based algorithm that generates nine anchors with three scales and three aspect ratios at every position of a feature map. The RetinaHead has two branches. One calculates the category, and the other calculates the regression parameters of the bounding box. Focal loss as classification loss is the core of the RetinaNet; it is an improvement of cross-entropy (CE) loss for binary classification.
In the equation above,
Then, rewrite
A common solution to class imbalances is to add a weight factor. Set
During training, many easily classified negatives dominate in the loss. But α can only balance positive/negative examples and cannot distinguish between easy and hard examples. To address that, a modulating factor
Combining Eqs 3, 4, the focal loss can be written as:
The application of focal loss greatly improves the detection accuracy of the one-stage detector, making the one-stage detector comparable to the two-stage detector in terms of detection accuracy while maintaining inference speed. However, RetinaNet does not have a special network structure design. Therefore, it can be improved according to the changeable lighting conditions, and the characteristics of dense passenger flow in subway stations so as to improve the robustness of the model.
According to experiments [20], when using RetinaNet for object detection, the PVT-based model performs better on COCO Val2017 than ResNet50. In this study, we implemented PVT-small as a backbone network in RetinaNet. The overall network structure is shown in Figure 2.
The transformer encoder is an important part of stages in PVT-small. Each encoder contains an attention layer and a feed-forward layer. PVT replaced the multi-head attention (MHA) layer in the traditional encoder [23] with an SRA layer. In ViT, the calculation of attention can be expressed as follows:
Here, q is query, k is key, v is value, and SRA performs spatial reduction in the spatial scale of K, V before attention operation. The calculation of SR is:
Here,
SRA adopts the same concatenation operation for the head as MHA. According to Eqs 6, 7, the computation of SRA is
The improvement of FPN
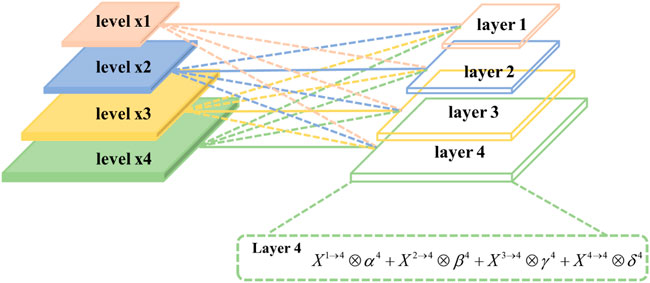
The CNN-based model has a local receptive field and hierarchical structure that can extract features from local to global. The transformer-based model shows strong modeling performance with its global modeling ability. However, they are not designed to make full use of the spatial information in images, so they need other means to compensate for this lack. In addition, a mechanism called a heuristic-guided feature selection usually exists when adopting feature pyramids for object detection. In feature maps, large objects are usually associated with upper-level features and small ones with lower-level features. In the process of FPN upsampling, the large instance of the upper feature is regarded as the background in the lower feature map. When there are objects of different scales in the image, this inconsistency between features will interfere with the gradient calculation during training and lower the performance of the pyramidal feature map. Therefore, we adopted the ASFF algorithm to improve FPN. The detailed implementation is shown in Figure 3.
We assigned weight coefficients to different levels of feature maps and retained useful information for combination. The weight coefficients allowed the model to learn spatial fusion weights of different feature maps adaptively and enhanced the feature fusion. Each layer will be processed as follows: First, we modified the feature maps for each level by up-sampling or down-sampling to achieve the same size as the corresponding layer. For example, X3→4 denotes that x3 is up-sampled by nearest-neighbor interpolation, and the feature map is scaled to the same size as x4. Second, α4, β4, γ4, and δ4 indicate the important spatial weights at four levels to layer 4, which are adaptively learned through standard back-propagation by the network. Also, we specified that
Loss optimization
RetinaHead calculates bounding box loss with L1 loss in the location subnet. L1 loss is also called mean absolute error (MAE). It calculates the loss of the four coordinates of the prediction box and the ground truth box, respectively, and then sums them. It does not consider the correlation between directions and coordinates, so it is not suitable for passenger detection in metro stations.
To address the shortcomings of L1 loss, we improved bounding box loss with GIoU [24] loss:
Predicted
For the predicted box
The area of
Thus, the intersection between
The coordinates of smallest enclosing box
The area of
The loss functions based on intersection over union (IoU) and GIoU are:
Compared with the L1 loss, IoU is scale invariant, and the output of IoU loss is always between 0 and 1, which reflects the inference performance of the prediction box and ground truth. GIoU addresses the problem that the gradient cannot be calculated when the two boxes overlap under the IoU. It also adds a minimum outsourcing box as the penalty term. This method can better reflect the proximity of the two boxes, and it is better for predicting box regression in the case of dense object detection.
Experiment
Dataset
With the continuous development of deep learning, model training has placed more requirements on the quality and quantity of datasets. Therefore, the quality of data is extremely helpful in model training and the generalization ability of the model. KITTI [25], CityPersons [26], and Caltech-USA et al. [27] are the mainstream large-scale pedestrian detection datasets. However, these datasets are still slightly inadequate for passenger flow detection in a metro station. For example, the KITTI and Caltech-USA datasets have less than one person per image on average. CityPersons, as a subset of the Cityscapes dataset [28], has an average of about six people per image, but this density still does not simulate the density of metro traffic very well. CrowdHuman [29] and CUHK Occlusion [30] are pedestrian detection datasets for dense, occlusive scenes. These two datasets are mainly oriented to streets, squares, and other open areas with good lighting conditions. However, in metro stations, the quality of images often suffers from diverse perspectives and insufficient lighting due to the restrictions of camera installation. Therefore, the existing pedestrian detection datasets can not fully simulate the subway operation scene in terms of density, perspective and light conditions. To address that, we proposed a new dataset named MetroStation. Our goal is to represent different operation scenes in MetroStation as comprehensively as possible, including different camera angles, different lighting conditions and different traffic densities. The original data of the MetroStation dataset were obtained from the surveillance video of Beijing subway stations. Depending on the speed of passenger movement in different areas of the stations, we draw frames at different time intervals.
The dataset contains 2,123 annotated images of size 640×480 pixels with 12,974 labels. The training set contains 1,699 images, and the remaining 424 images are validation and test images. The comparison between our dataset and other datasets is shown in Figure 4.
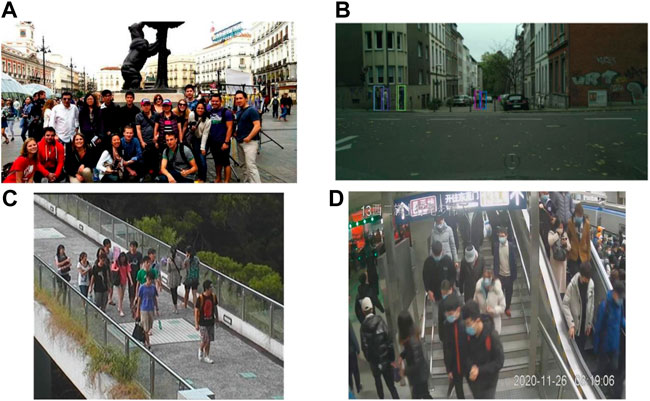
FIGURE 4. Comparison of MetroStation with other pedestrian detection datasets. (A) CrowdHuman, (B) CityPerson, (C) CUHK occlusion, and (D) MetroStation.
Diversity and size
Diversity is one of the important indicators of the dataset. Depending on the different video sources, the whole dataset can be divided into four subsets: Stairs, Escalator, Gate and Platform. The number of images and labels in each subset is shown in Table 1.
The Stairs subset comes from videos of two cameras installed in the stairs area during three different periods. The Escalator subset comes from the cameras facing four different escalators. The Gate subset consists of four time slots from two gates, and the Platform subset consists of seven time slots from five cameras. We display four types of scenes in our datasets in Figure 5.
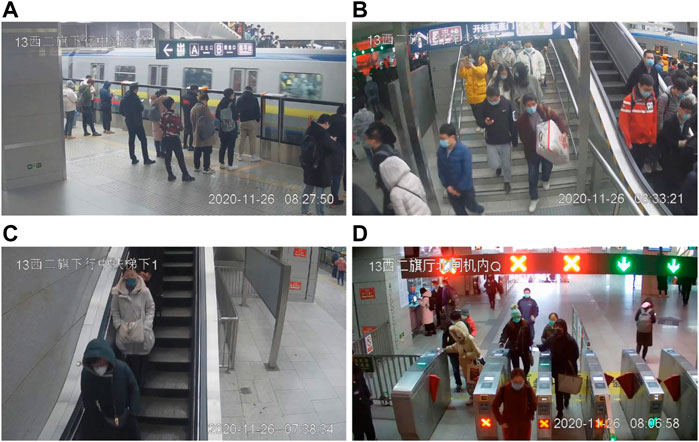
FIGURE 5. The types of scenes in the MetroStation dataset: (A) platform, (B) stairs, (C) escalator, and (D) gate.
Density
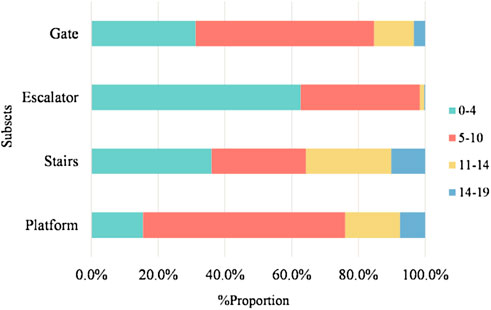
In terms of density, the average density in MetroStation is 6.1 people per image. However, the density of each subset varies due to different passenger flow characteristics and camera perspectives in different station areas, as shown in Table 2.
The average density of MetroStation can reach 6.11 people per image. The Platform subset has the highest density of all subsets, with an average density of 8.59 people per image. We show the distribution of images with different densities in Figure 6.
Experiments on the MetroStation dataset
In this study, we used two NVIDIA GeForce GTX 1080Tis to train on MMDetection 2.20, an object detection framework. We used a step learning rate schedule with 24 epochs and the AdamW optimization algorithm.
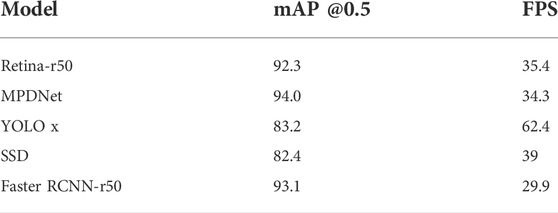
We evaluated the performance of our method on the MetroStation dataset. We randomly divided MetroStation into a training set and test set according to an 8:2 ratio and used mean average precision (mAP) as the accuracy indicator. We compared several common object detection models on the MetroStation dataset in terms of accuracy. We took frames per second (FPS) as the indicator of inference speed. The experiment results are shown in Table 3.
Table 3 shows that our model has reached 94.0% passenger detection accuracy. Compared with other methods in Table 3, our detection accuracy is even better than the two-stage detector. The FPS of MPDNet is 34.3, which is capable of real-time detection in a metro station.
Figure 7 shows the application of RetinaNet and MPDNet in four subsets. The number of false positive samples in MPDNet is less, and MPDNet performed better in identifying passengers from a highly occluded crowd.
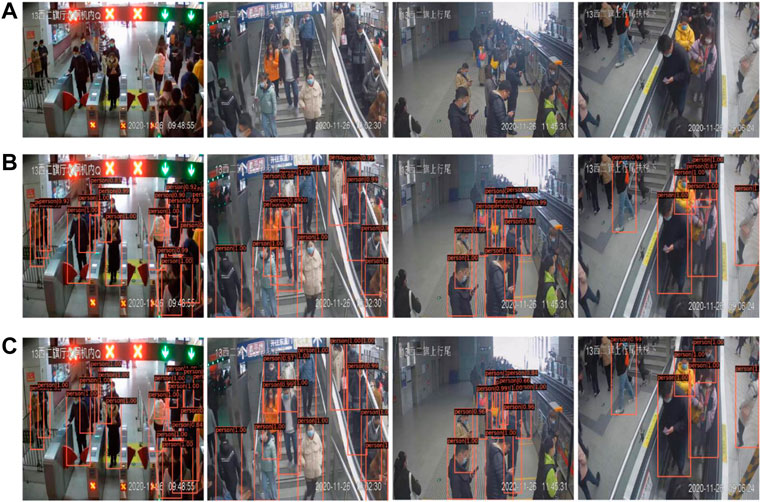
FIGURE 7. Comparison of practical application effects between RetinaNet and MPDNet. (A) The original images. (B) The results of RetinaNet. (C) The results of MPDNet.
Ablation experiments
In this section, we performed ablation experiments on the MetroStation dataset to verify the effectiveness of ASFF-FPN. In this experiment, every model was improved by GIoU. Table 4 shows that using the ASFF algorithm to optimize the FPN model can effectively improve accuracy. “*” indicates the FPN was not improved by the ASFF algorithm.
The accuracy of the models improved by ASFF was lifted, with RetinaNet improved by 0.2% and MPDNet improved by 6.1%. The reason is that the features extracted by the backbone in these two models have different components of spatial information. The purpose of FPN is to pass the higher-layer feature down layer by layer. This will complement the semantic information of the lower layer to obtain high resolution and strong semantic features. In RetinaNet, the feature in the lower layer is more related to localization information, and the feature in the upper layer is more related to the characteristics of the object. In this case, the purpose of ASFF-FPN is almost the same as that of FPN, so the performance of ASFF-FPN in RetinaNet is not significant. Meanwhile, in MPDNet, PVT-small is a network based on a self-attention mechanism. It reshapes the image into a patch sequence and calculates the correlation between each patch. Even though the shape of feature maps is pyramidal, it still focuses more on global information. Thus, the feature contains more global information and less local information. The ASFF algorithm assigned higher weights to feature maps that contained more local information, making the output feature maps have a larger proportion of local information from upper layers. In this case, MPDNet improved with ASFF and performed better than the MPDNet* that was not improved. Moreover, the transformer-based method can extract more localization information than the CNN-based method from the principle, making MPDNet have higher accuracy than RetinaNet.
Conclusion
This research focused on using surveillance video data to detect passenger flow in various areas of metro stations. We proposed the MetroStation dataset based on surveillance video from metro stations. Compared with other pedestrian detection datasets, this dataset reflects multiple scenes from metro stations. We also introduced MPDNet, a real-time passenger flow detector based on RetinaNet. The experiment on MetroStation showed that MPDNet performed well on passenger flow detection in dense, occluded scenes of metro stations.
Although our model performed well in dense passenger flow detection, we still hope to have better computational efficiency. Therefore, our future work will focus on the 2D position embedding method in the transformer-based model to make it more suitable for objection detection tasks and increase its inference speed. We will continue to enrich the density and diversity of the MetroStation dataset.
Data availability statement
The MetroStation dataset now is available in https://doi.org/10.6084/m9.figshare.20521848.
Author contributions
All authors listed have made a substantial, direct, and intellectual contribution to the work and approved it for publication.
Funding
This study is supported in part by the National Key R&D Program of China (2020YFC0833104); the Beijing Municipal Natural Science Foundation (L201015) and Safe Mining of Coal Resources (Grant No. 52121003).
Conflict of interest
The authors declare that the research was conducted in the absence of any commercial or financial relationships that could be construed as a potential conflict of interest.
Publisher’s note
All claims expressed in this article are solely those of the authors and do not necessarily represent those of their affiliated organizations or those of the publisher, the editors and the reviewers. Any product that may be evaluated in this article, or claim that may be made by its manufacturer, is not guaranteed or endorsed by the publisher.
References
1. ling YX, Xie Z, Wang AL. Real-time monitoring system for passenger flow information of metro stations based on intelligent video surveillance. In: B Liu, L Jia, Y Qin, Z Liu, L Diao, and M An, editors. Proceedings of the 4th International Conference on Electrical and Information Technologies for Rail Transportation (EITRT); Singapore (2019). p. 329–35. doi:10.1007/978-981-15-2914-6_31
2. Xiong F, Shen W, Chen H, Pan S, Wang X, Yan Z. Exploiting implicit influence from information propagation for social recommendation. IEEE Trans Cybern (2020) 50:4186–99. doi:10.1109/TCYB.2019.2939390
3. Hu X, Zheng H, Wang W, Li X. A novel approach for crowd video monitoring of subway platforms. Optik (2013) 124:5301–6. doi:10.1016/j.ijleo.2013.03.057
4. Zhengyu X, Limin J, Li W. Passenger flow detection of video surveillance: A case study of high-speed railway transport hub in China. ElAEE (2015) 21:48–53. doi:10.5755/j01.eee.21.1.9805
5. Zhang J, Zhu G, Wang Z. Multi-column atrous convolutional neural network for counting metro passengers. Symmetry (2020) 12:682. doi:10.3390/sym12040682
6. Guo Q, Liu Q, Wang W, Yuanqing Z, Kang Q. A fast occluded passenger detector based on MetroNet and Tiny MetroNet. Inf Sci (2020) 534:16–26. doi:10.1016/j.ins.2020.05.009
7. Liu Q, Guo Q, Wang W, Zhang Y, Kang Q. An automatic detection algorithm of metro passenger boarding and alighting based on deep learning and optical flow. IEEE Trans Instrum Meas (2021) 70:1–13. doi:10.1109/TIM.2021.3054627
8. Yang J, Zheng Y, Yan K, Liu H, Jin K, Fan W, et al. SPDNet: A real-time passenger detection method based on attention mechanism in subway station scenes. Wireless Commun Mobile Comput (2021). doi:10.1155/2021/7978644
9. Xiong F, Wang X, Pan S, Yang H, Wang H, Zhang C. Social recommendation with evolutionary opinion dynamics. IEEE Trans Syst Man Cybern Syst (2020) 50:1–13. doi:10.1109/TSMC.2018.2854000
10. Krizhevsky A, Sutskever I, Hinton GE. ImageNet classification with deep convolutional neural networks. In: Advances in neural information processing systems (2022)
11. Girshick R, Donahue J, Darrell T, Malik J. Rich feature hierarchies for accurate object detection and semantic segmentation. In: Proceedings of the IEEE Conference on Computer Vision and Pattern Recognition (CVPR) (2014). p. 580–7. doi:10.1109/CVPR.2014.81
12. Girshick R. Fast R-CNN. In: 2015 IEEE International Conference on Computer Vision (ICCV); 07-13 December 2015; Santiago, Chile (2015). p. 1440–8. doi:10.1109/ICCV.2015.169
13. Ren S, He K, Girshick R, Sun J. Faster R-CNN: Towards real-time object detection with region proposal networks. IEEE Trans Pattern Anal Mach Intell (2017) 39:1137–49. doi:10.1109/TPAMI.2016.2577031
14. Redmon J, Divvala S, Girshick R, Farhadi A. You only look once: Unified, real-time object detection. In: 2016 IEEE Conference on Computer Vision and Pattern Recognition (CVPR); Las Vegas, NV, USA (2016). p. 779–88. doi:10.1109/CVPR.2016.91
15. Liu W, Anguelov D, Erhan D, Szegedy C, Reed S, Fu C-Y, Berg AC. Ssd: Single shot MultiBox detector. In: European Conference on Computer Vision (2016). p. 21–37. doi:10.1007/978-3-319-46448-0_2
16. Lin T-Y, Goyal P, Girshick R, He K, Dollár P. Focal loss for dense object detection (2018). Available at: http://arxiv.org/abs/1708 (Accessed June 2, 2022).
17. Carion N, Massa F, Synnaeve G, Usunier N, Kirillov A, Zagoruyko S. End-to-End object detection with transformers (2020). Available at: http://arxiv.org/abs/2005.12872 (Accessed April 30, 2022).
18. Dosovitskiy A, Beyer L, Kolesnikov A, Weissenborn D, Zhai X, Unterthiner T, et al. An image is worth 16x16 words: Transformers for image recognition at scale (2020). Available at: http://arxiv.org/abs/2010 (Accessed April 30, 2022).
19. Liu Z, Lin Y, Cao Y, Hu H, Wei Y, Zhang Z, et al. Swin transformer: Hierarchical vision transformer using shifted windows. In: 2021 IEEE/CVF International Conference on Computer Vision (ICCV); Montreal, QC, Canada (2021). doi:10.1109/ICCV48922.2021.00986
20. Wang W, Xie E, Li X, Fan D-P, Song K, Liang D, et al. Pyramid vision transformer: A versatile backbone for dense prediction without convolutions. In: 2021 IEEE/CVF International Conference on Computer Vision (ICCV); Montreal, QC, Canada (2021). p. 548–58. doi:10.1109/ICCV48922.2021.00061
21. He K, Zhang X, Ren S, Sun J. Deep residual learning for image recognition. In: 2016 IEEE Conference on Computer Vision and Pattern Recognition (CVPR); Las Vegas, NV, USA (2016). p. 770–8. doi:10.1109/CVPR.2016.90
22. Lin T-Y, Dollar P, Girshick R, He K, Hariharan B, Belongie S. Feature pyramid networks for object detection. In: 2017 IEEE Conference on Computer Vision and Pattern Recognition (CVPR) (2017). p. 936–44. doi:10.1109/CVPR.2017.106
23. Vaswani A, Shazeer N, Parmar N, Uszkoreit J, Jones L, Gomez AN, et al. Attention is all you need. In: Advances in neural information processing systems. Curran Associates, Inc. (2022).
24. Rezatofighi H, Tsoi N, Gwak J, Sadeghian A, Reid I, Savarese S. Generalized intersection over union: A metric and A loss for bounding box regression (2019). Available at: http://arxiv.org/abs/1902.09630 (Accessed June 4, 2022).
25. Geiger A, Lenz P, Urtasun R. Are we ready for autonomous driving? The KITTI vision benchmark suite. In: 2012 IEEE Conference on Computer Vision and Pattern Recognition (2012). p. 3354–61. doi:10.1109/CVPR.2012.6248074
26. Zhang S, Benenson R, Schiele B. CityPersons: A diverse dataset for pedestrian detection. In: 2017 IEEE Conference on Computer Vision and Pattern Recognition (CVPR (2017). p. 4457–65. doi:10.1109/CVPR.2017.474
27. Dollar P, Wojek C, Schiele B, Perona P. Pedestrian detection: A benchmark. In: 2009 IEEE Conference on Computer Vision and Pattern Recognition (2009). p. 304–11. doi:10.1109/CVPR.2009.5206631
28. Cordts M, Omran M, Ramos S, Rehfeld T, Enzweiler M, Benenson R, et al. The Cityscapes dataset for semantic urban scene understanding. In: 2016 IEEE Conference on Computer Vision and Pattern Recognition (CVPR); Las Vegas, NV, USA (2016). p. 3213–23. doi:10.1109/CVPR.2016.350
29. Shao S, Zhao Z, Li B, Xiao T, Yu G, Zhang X, Sun J. CrowdHuman: A benchmark for detecting human in a crowd (2018). Available at: http://arxiv.org/abs/1805.00123 (Accessed May 1, 2022).
Keywords: passenger detection, metro station, surveillance video, deep learning network, transformer
Citation: Yang J, Gong M, Dong X, Liang J and Wang Y (2022) MPDNet: A Transformer-based real-time passenger detection network in metro stations. Front. Phys. 10:1017951. doi: 10.3389/fphy.2022.1017951
Received: 12 August 2022; Accepted: 20 September 2022;
Published: 13 October 2022.
Edited by:
Fei Xiong, Beijing Jiaotong University, ChinaReviewed by:
Jianjuan Liu, Henan University of Technology, ChinaYe Tian, Shenyang Ligong University, China
Biao Leng, Beihang University, China
Copyright © 2022 Yang, Gong, Dong, Liang and Wang. This is an open-access article distributed under the terms of the Creative Commons Attribution License (CC BY). The use, distribution or reproduction in other forums is permitted, provided the original author(s) and the copyright owner(s) are credited and that the original publication in this journal is cited, in accordance with accepted academic practice. No use, distribution or reproduction is permitted which does not comply with these terms.
*Correspondence: Mengjie Gong, c3F0MjAwMDQwNTA4MUBzdHVkZW50LmN1bXRiLmVkdS5jbg==
†These authors have contributed equally to this work
 Jun Yang
 Mengjie Gong
 Xueru Dong
 Jiahua Liang
 Yan Wang
