- 1Graduate School of Business Administration, Keio University, Yokohama-city, Japan
- 2Mitsubishi UFJ Trust and Banking Corporation, Chiyoda-Ward, Tokyo, Japan
Approaches using both real data and social simulations have been proposed to address economic and social problems. Understanding the structure of models and the results of simulations may be used by not only model developers and analysts but also by decision-makers in management and administration as well as on-site managers. Therefore, methodologies for extracting knowledge and insights from simulation log data and a framework for propagating the extracted knowledge and insights to stakeholders are important. In this study, we compare log analysis frameworks and create a formal description of social simulations for benefit-delay products and services to determine their merits, shortcomings, and limitations. Then, by extending an experience mapping method from a previous study, we propose a method for also describing a service provider’s experience. We use this method to simulate pre- and post-retirement asset sustainability. The main findings are as follows: 1) an integrated experience description of the customer and provider sides of a benefit-delay service design is feasible, and 2) customer targeting based on this description is possible.
1 Introduction
Approaches to designing products and services that use social simulation based on real-world data have recently been proposed. Yamada et al. used social simulation techniques to design services for introducing new equipment at airports [1, 2]. Kikuchi and Takahashi used social simulation based on large-scale questionnaire data to design financial services for life planning [3, 4]. These practical decision-making analyses are expected to contribute to efficient social and economic decision-making and product and service design. However, few studies have been conducted for products and services that require customers to wait a very long time to enjoy their benefits such as medical care, education, and asset formation (hereinafter, “benefit-delay services”) [5].
As product and service design using social simulation becomes more prevalent, understanding and interpreting its model structure and results will become more important for developers and analysts as well as decision-makers in management and administration and perhaps even for those in charge in the field of practice. Therefore, 1) methodologies for extracting knowledge and insights from simulation log data, and 2) a framework for propagating the extracted knowledge and insights among stakeholders are both necessary. To address this issue, an approach exists that attempts to analyze and formally describe simulation logs using the human-centered design concept [6–8] and the experience mapping method [9–11], both of which are used in design thinking [12–14]. Although this approach may facilitate communication between stakeholders, few studies have been conducted on “benefit-delay services.”
In this paper, we first compare frameworks for the log analysis and formal description of social simulations that contribute to product and service design to discuss their merits, shortcomings, and limitations. Then, by extending an experience mapping method previously proposed by the authors, we propose a new method for also describing a service provider’s experience. The proposed method enables an integrated experience description of both the customers and service providers of a benefit-delay service design and the development of a customer targeting strategy based on the resultant description. The main contributions of this paper are as follows: 1) The proposed method yields a description that may lead directly to the design of benefit-delayed services and products. 2) The proposed experience mapping methodology is capable of extracting knowledge that directly supports marketing measures and management decision-making. To demonstrate the proposed method, we use it to simulate pre- and post-retirement asset sustainability.
The proposed experience mapping method is based on the previous literature and satisfies the following requirements: 1) it expresses the customer’s perspective, 2) the content derived from the log analysis results is captured concisely in a single map without any need for special justification or explanation, 3) information that suggests the next design action is included, and 4) it also expresses the service provider’s perspective. Note that 1) through 3) were set according to [15], and 4) was added to contribute to benefit-delay product and service design. Our proposed methodology enables us to: (I) express the perspectives of both customers and service providers, (II) concisely represent simulation results on a single map, and (III) include information in the form of “solutions” and “boundaries” on the map to guide the next course of action.
The paper is organized as follows. Section 2 introduces the previous literature, Section 3 describes the methodology, Section 4 describes the simulation model, Section 5 provides a demonstration, and Section 6 concludes.
2 Related work
2.1 Social simulation and results analysis
Social simulation is a social science that utilizes computer simulation to analyze social phenomena [16, 17]. There are many prior studies in the financial domain [18–22]. Many recent studies in the social simulation field have been grounded in real-world data [1–4]. The combination of retrospective data and computational modeling of future scenarios is expected to improve our understanding of ongoing social complexity [23].
Extensive research is being conducted to raise awareness and facilitate understanding among stakeholders regarding the results of social simulation runs and the structure of models. Depending on the granularity of the analysis, three types of knowledge can be extracted from simulation results: micro-level analysis [24], macro-level analysis [25], and meso-level analysis [26, 27]. In addition, a linguistic model has been proposed to formally describe the results of simulations targeting business organizations [28]. Examples of its application to the results of agent simulation runs also exist [29, 30].
However, few studies have been conducted on log analysis frameworks or formal descriptions of social simulations that relate directly to the design of benefit-delay services and products.
2.2 Experience mapping techniques
“Design thinking” has been attracting attention in the design of products and services [6–8]. As an observational method, experience mapping techniques such as the persona–scenario technique [9], the customer journey map [10], and the empathy map [11] are used to discover users’ latent needs.
The use of experience mapping may enable us to standardize the perceptions of stakeholders such as the developers and marketers of products and services. This method may also be a more effective means of facilitating communication among stakeholders, which is a problem encountered in the analysis of social simulation results as discussed in Section 1 [12–14].
1) Persona–Scenario Method
The concept of “personas” is widely used in the fields of marketing and human-computer interaction [9, 31]. Personas are believed to promote the design of customer-oriented products and services. In the marketing field, personas create an image of a person based on clear and specific real-world data. This can improve the quality of decisions regarding product and service design for specific customer attributes.
2) Customer Journey Map
The customer journey map [10] is a visualization of customers’ emotions, thoughts, and issues they may have by arranging actions related to products and services in chronological order. This method is the most basic and widely used visual description method in service design.
3) System Experience Boundary Map (SEBM)
SEBM is an experience mapping model that formally describes the changes in a customer’s experience prompted by new products and services resulting from business innovation [11]. An SEBM focuses more on user interface changes than user experience mapping methods such as the user experience map, mental model diagram, and customer journey map [11].
An SEBM describes changes in a customer’s experience of an existing good or service due to the emergence of novel goods and services through the following three-step procedure [11]. 1) The stage–aspect decomposition of the characteristics of the experience into two axes: “Stage” and “Aspect”; 2) an extraction of the potential limits/constraints of the experience in each decomposed stage and aspect boundary; and 3) the description of the new behavior using the solution to the limits/constraints.
Through this three-step procedure, an SEBM describes customer experience changes in a table (i.e., an experience map) decomposed from certain perspectives. This experience map describes the constraints that exist for a customer in terms of when, where, and with whom it occurs, in addition to what kind of experience will be created by resolving these constraints [11].
2.3 Benefit-delay services
Customers receive benefits such as comfort and convenience as well as pleasure and enjoyment from using various services. Focusing on the benefits received by customers, Fujimura classified services according to when a customer enjoys their benefits [5]. Goods and services that allow customers to receive benefits while they use the service are called “benefit-immediate services.” Conversely, “benefit-delay services” are services for which the benefits are not necessarily enjoyed while they are being consumed because it takes time for a customer to receive the benefits.
Financial products and services for future life planning such as asset formation, insurance, and asset inheritance services are classified as benefit-delay services because the direct and essential benefits may not be experienced by the customer for several decades.
In examining benefit-delay services, tracing the customer’s experience until he or she receives the benefits is important. In addition, the sustainability of the product or service provider should be considered.
3 Methodology
3.1 Knowledge extraction framework on social simulation results for service design
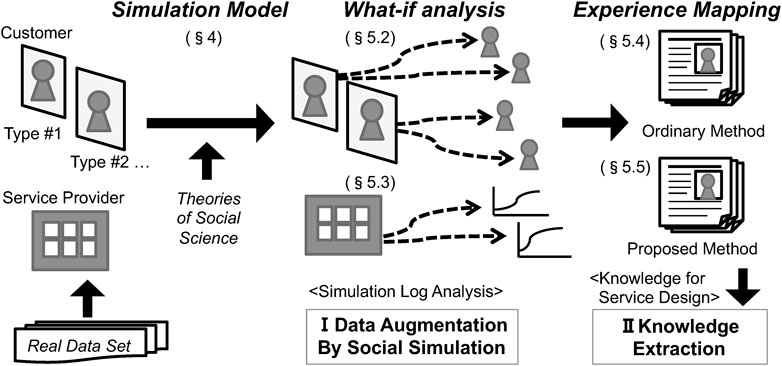
Our framework is designed to run simulations using real-world data on customer attributes to evaluate measures to increase the sustainability of customers’ retirement assets using data and simulation results [12–14]. Figure 1 depicts an overview of the proposed framework. Our framework consists of the following two procedures:
I) Data augmentation using social simulation: Real-world data and simulation logs/paths are integrated and treated as augmented customer and service provider attribute data.
II) Knowledge extraction from augmented data: From the augmented data, knowledge about the sustainability of assets for each customer and about the business conditions of the service provider are extracted and described for service design by the experience mapping techniques.
Real-world data consist of large survey data that reflect various customer attributes (Section 5.1). We use cross-sectional data from individual questionnaires [3] and construct a social simulation model based on finance theory [32, 33] (Section 4) that addresses asset formation in retirement while considering asset succession and risky asset price fluctuations. Based on the model, simulations are run to conduct a “what-if” analysis of a customer’s asset and service provider’s sustainability (Sections 5.2, 5.3). The future asset depletion rates of customers and profits of service providers as obtained from the simulation results, are treated as augmented data for the original questionnaire data. Finally, the results are represented using ordinary and the proposed experience mapping techniques [9–11] (Sections 5.4, 5.5).
3.2 Extended SEBM method
To represent an experience that integrates both the customer and service provider perspectives on benefit-delay services, we propose an experience mapping method that extends the SEBM model [11], as described in Section 2.2.
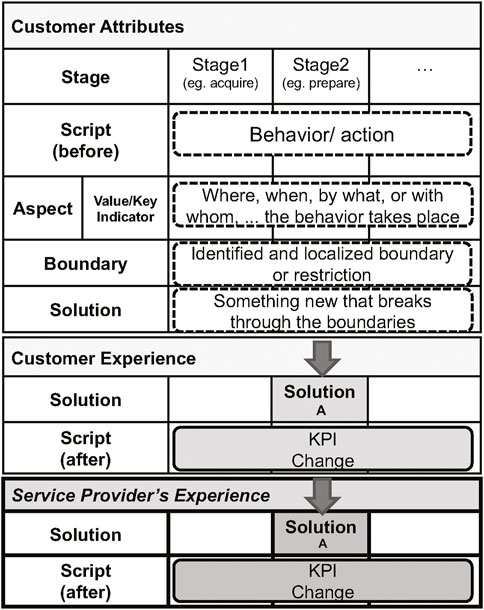
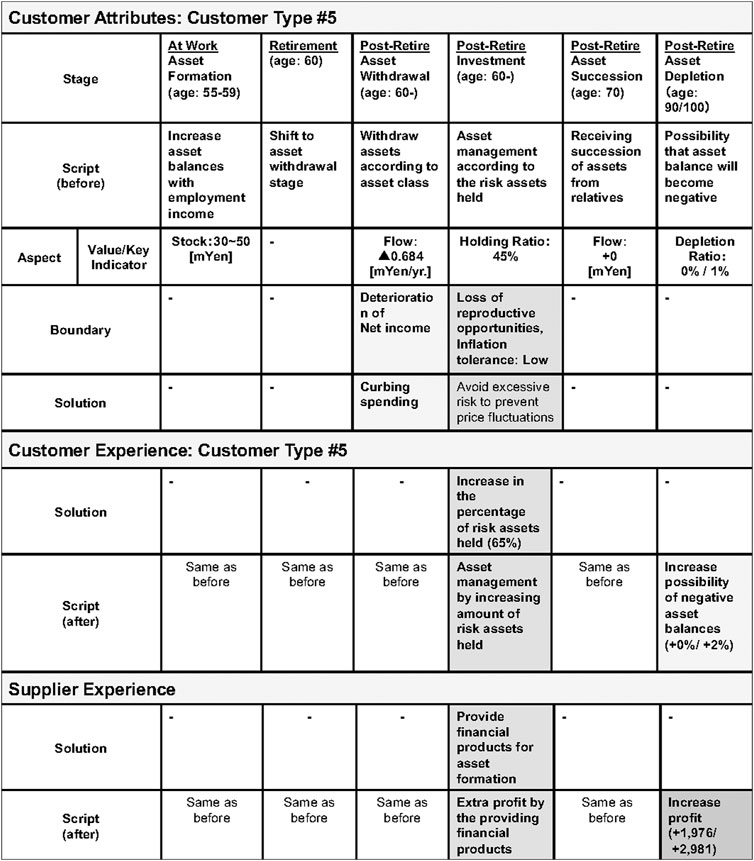
The extended version of the SEBM method consists of three main parts: the upper, middle, and lower parts (Figure 2). The upper part expresses customer attributes and corresponds to the “Stage” and “Solution” in an SEBM. The middle part represents the customer experience and illustrates the changes in the customer’s experience and script when a customer chooses one of the solutions indicated in the upper part. This can be interpreted as the result of the what-if analysis when one of several possible options is chosen. Then, the script (after) describes the changes in key performance indicators (KPIs) on the customer side. The lower part expresses the experience of the product or service provider. When a customer chooses a certain solution, it shows how the KPI of the entity that provides the solution changes in response to a change in the customer’s “Stage.”
The extended version of the SEBM model represents and integrates the experiences of both the customer and service provider. From the product or service provider perspective, the SEBM framework facilitates decision-making when targeting customers by comparing and considering customer-side and service provider-side KPIs.
4 Simulation model
In this section, we describe the social simulation model used in this study, which is extended on our previous studies [3, 4]. Section 4.1 provides an overview, and Sections 4.2, 4.3 introduce the model components: namely, the customer and the external environment. Sections 4.4, 4.5 describe customer cash flows and the rules for asset formation and withdrawal. Finally, we explain the model’s macro indicators: namely, the rate of asset depletion (customer-side KPI, Section 4.6) and the service provider’s revenue (provider-side KPI, Section 4.7).
4.1 Outline
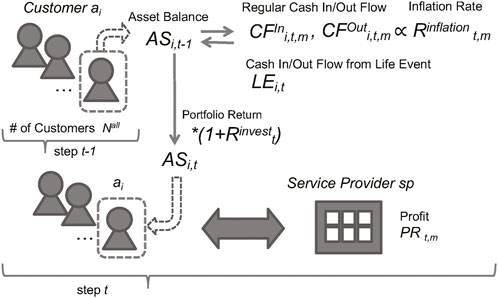
We develop a computer simulation model that represents a customer’s asset formation and withdrawal before and after retirement as well as the earnings of financial service providers (Figure 3).
To illustrate the proposed model, we simulate a customer’s asset situation at a future point in time, accounting for asset succession and price fluctuations of risky assets. Each customer in the model exhibits a specific asset balance at a certain age. According to the customer’s status, he or she exhibits both regular income and expenditures (i.e., cash inflow and outflow) and unexpected income and expenditure, depending on his or her life events like asset succession, before and after retirement. Each customer’s characteristics are expressed statistically. We perform what-if analysis by manipulating the customer attributes to examine their decision-making in response to the implementation of a particular policy. The service provider, which is an asset management company, provides financial products to its customers and earns income from the fees that it charges.
Each customer’s assets include cash, deposits, and risky assets. Risky assets are fully invested in a portfolio of traditional assets and provide returns that are proportional to the portfolio’s risks. Regular income and expenditures are adjusted to account for inflation. The external environment comprises the inflation rate and the portfolio’s risk–return profile of each customer, as further described below. The service provider earns fee income proportional to the customer’s risk asset balance.
4.2 Customer
Let A be the set of customers, and
Age is expressed as follows:
In the simulation time step, a single step represents 1 year in real time.
4.3 External environment
The return of portfolio j and the inflation rate are generated in a time series using a Monte Carlo simulation as follows, where K denotes the number of trials.
Annual portfolio return is expressed as follows:
The annual inflation rate is given as follows:
where
The cumulative value, IRC, of the inflation rate, referred to as the cumulative inflation rate, is expressed as follows:
4.4 Cash inflow/outflow
Retirement cash inflows and outflows,
and
To keep the estimated possibility of withdrawals conservative, the net cash flow before retirement is set to zero.
4.5 Asset formation and withdrawal rules
The cash and deposit balance and risk asset balance at each simulation step are varied according to the following rules. This expresses the preferential withdrawal of highly liquid cash and deposits in the asset withdrawal stage.
If
then
else
4.6 Asset depletion rate
For K trials, the number of times that the asset balance becomes negative at age
4.7 Service Provider’s profit
The service provider, sp, exhibits the following attribute at step t of the simulation: profit PRt. The service provider’s revenue is assumed to be equal to the fee income derived from the risky assets held by its customers. Rtrust is assumed to be the asset manager’s trust fee ratio.
5 Demonstration
5.1 Simulation settings
In this section, we describe the model parameters, customer attributes, and service provider attributes for running the simulation.
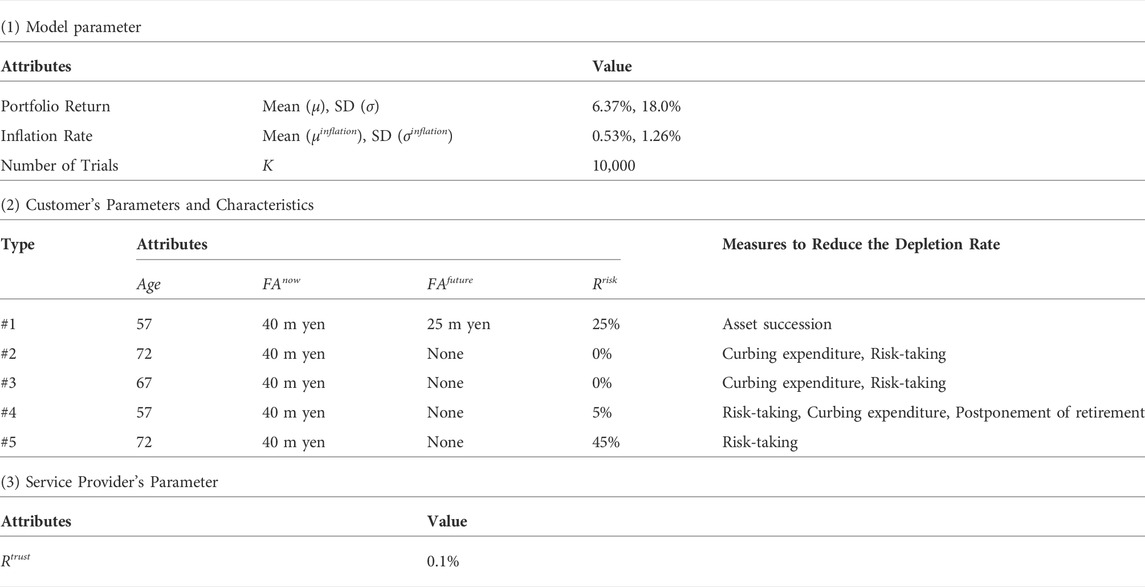
First, the parameters for the external environment, such as portfolio risk-return and inflation rate, are empirically parameterized by referring to previous studies [3]. Next, we discuss the client attributes and parameters. Referring to previous studies [3], we use the results of clustering individual questionnaire data and classifying respondents into several types. The questionnaire is unique in that it comprehensively examines each individual’s asset situation (current asset balance and expected income and expenditure in retirement) as well as asset balances inherited from relatives and investment pRef. [34]. Respondent attributes used are age, current financial asset balance (
Table 1 summarizes the above discussion. The simulation will be performed with these settings from now on. Note that the other model parameters are as follows:
5.2 Simulation results (1): What-if analysis of asset depletion rate for each customer
Based on the simulation settings, we set the attributes of the customers and simulated the depletion rate in the future. Then, we performed what-if analysis, increasing the risk assets of the customers. The customer attributes in Table 1 are used, and
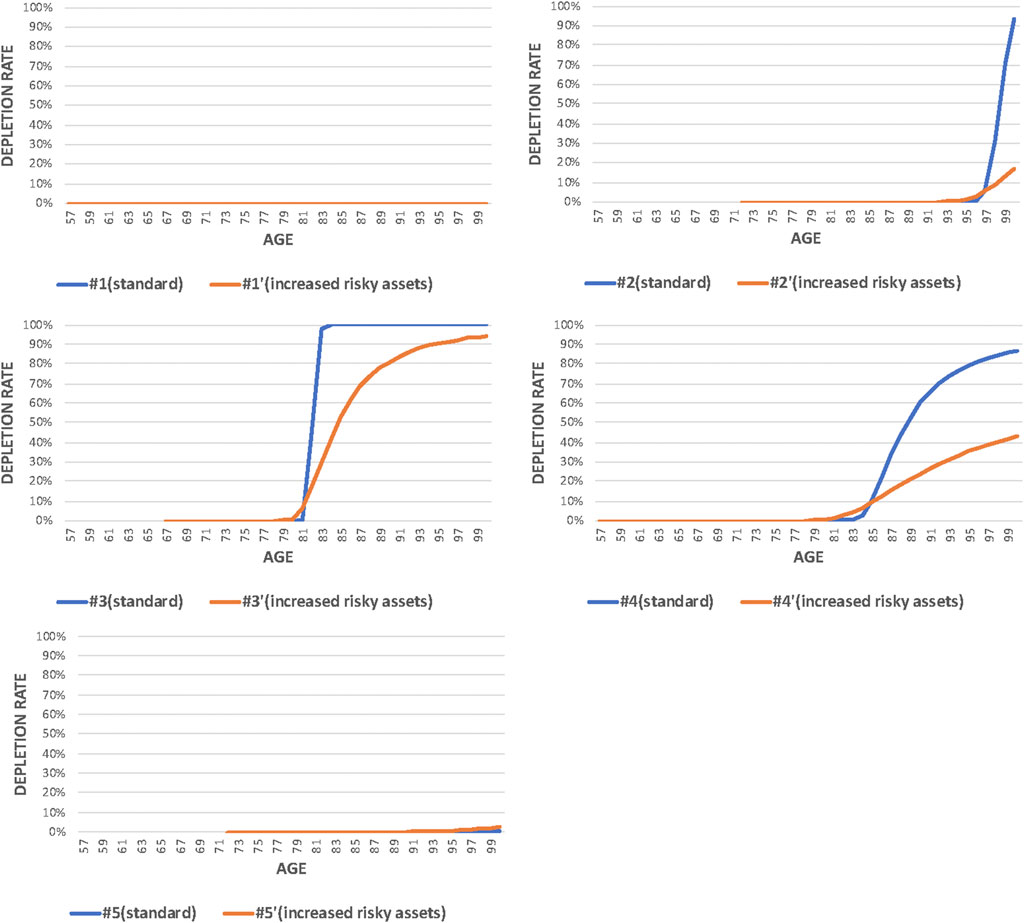
FIGURE 4. Time Series of Depletion Rate per Customer Type (standard case vs. increased risky assets case).
5.3 Simulation results (2): What-if analysis of asset depletion rate for service provider
In addition, we simulated the service provider’s profit in the future (Figure 5). Then, the time series of the service provider’s profit for each cluster is shown in blue bars for the standard case and orange bars for the case of increased risky assets.
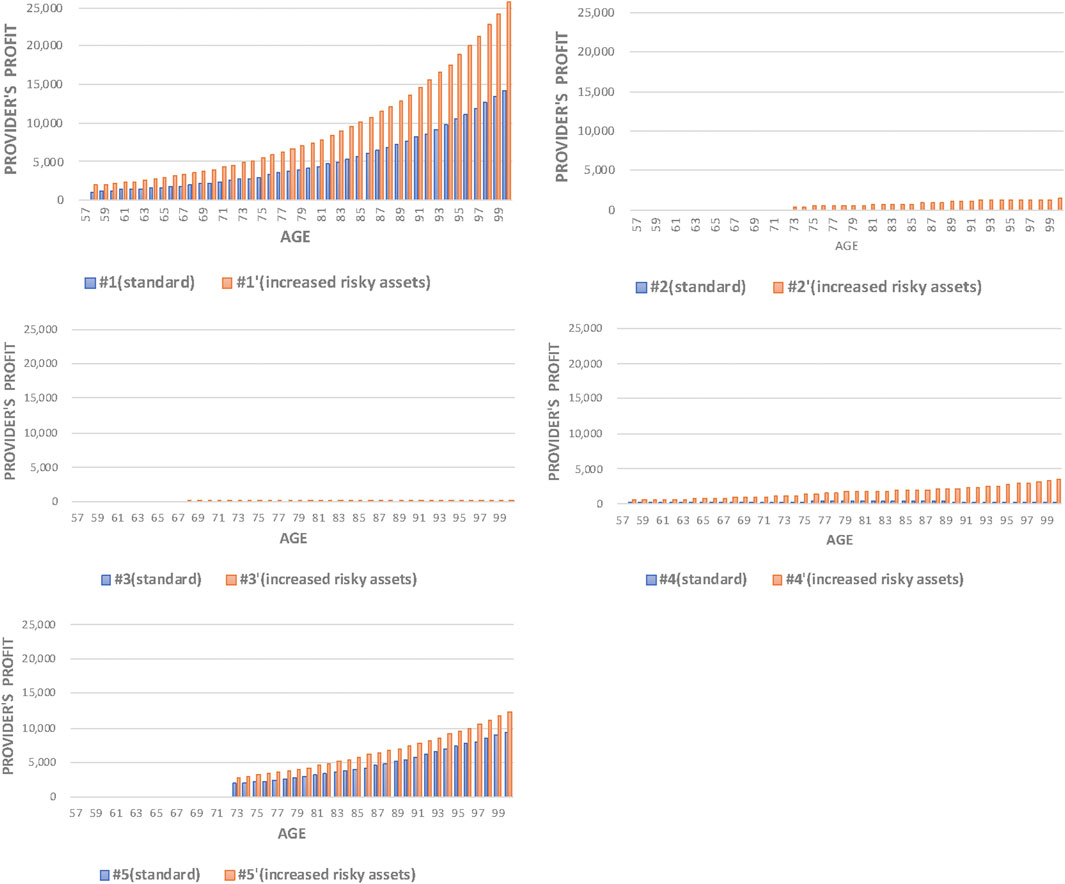
FIGURE 5. Time Series of Provider’s Profit per Customer Type (standard case vs. increased risky assets case).
5.4 Knowledge extraction using ordinary experience mapping methods
5.4.1 Formal description using a persona-scenario method [12, 13]
The following simulation results are formally described using ordinary experience mapping techniques. First, we used a persona–scenario method [12, 13].
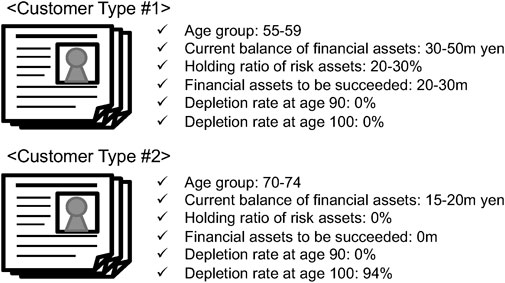
Figure 6 illustrates the contents of Table 1 and Figure 4 in the form of a persona skeleton. From the original questionnaire, the attributes “Age group,” “Current balances of financial assets,” “Holding ratio of risk assets,” and “Financial assets to be succeeded” were selected and described as the attributes obtained by clustering method. The statuses “Depletion rate at age 90” and “Depletion rate at age 100” were selected and described from the simulation results.
The advantage of using the persona scenario method of formal description is that it allows us to observe and compare differences in attributes and conditions among customer types, including simulation results, with little room for interpretation. On the other hand, the limitation exists that only static values are entered for a given cross-section.
5.4.2 Formal description using a customer journey map [13]
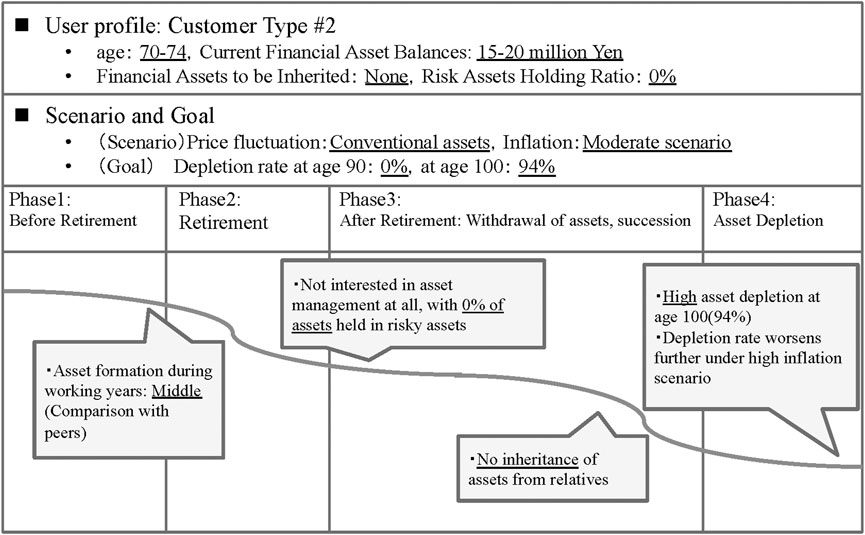
Second, we used a customer journey map to formally describe the simulation results [13]. Figure 7 depicts the contents of Table 1 and Figure 4 in the form of a customer journey map, illustrating Customer Type # 4 as s sample.
The “User Profile” part describes the attributes obtained from the original questionnaire by the clustering method. The “Scenario and Goal” part displays the various assumptions made in the simulation and the results of the simulation. In the “Phase” part, the simulation period is divided into four phases according to the customer’s condition. After that, we summarized the changes in the balance of assets held as well as the customer’s status in each phase. Furthermore, in the balloon in the figure, we filled in the status of the customer based on the simulation results. Discussions between stakeholders can also be used to describe the thoughts and feelings of the target customers and users. In this way, a formal description of the simulation results using a customer journey map demonstrates the advantage of allowing the customer or user’s perspective to be expressed.
5.4.3 Formal description using an SEBM [14]
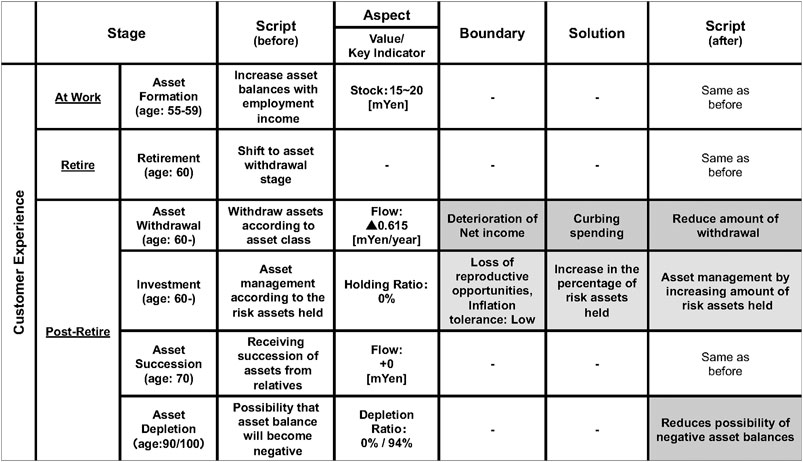
Third, we used an SEBM to formally describe the simulation results [14]. Figure 8 illustrates the contents of Table 1 and Figure 4 in the form of an SEBM. We illustrate Customer Type #2 case in this section as a sample.
First, the “Stage” part of Figure 8 represents the customer’s state changes in the simulation (At Work, Retire and Post-Retire). The “Aspect” part represents key indicators related to the simulation, corresponding to the behavioral variables of the simulation. These include simulation default settings, customer attributes, and macro variables obtained in the simulation results. By depicting the contents of Table 1 and Figure 4, it is possible to represent customer attributes at the start of the simulation (Asset Balance, Cash Flow, and Risky Assets Holding Ratio) and expected future attributes (“Depletion Ratio at age 90” and “Depletion Ratio at age 100” in Figure 8). However, the information obtained from this part is static (i.e., it is snapshot-like).
Next, the “Solution” part of Figure 8 corresponds to the measures to reduce the depletion rate for each customer type listed in Table 1. The “Script (after)” part then expresses how the simulation results change when depletion rate reduction measures are adopted. Thus, we can depict the dynamic transformations in user experience in a single map. An SEBM also enables us to compare “as-is” and “to be” scenarios by capturing information that leads the next design actions, such as how to improve countermeasures for each customer type. Conversely, the inability to express the thoughts of customers and users indicates room for improvement in service and product design. Furthermore, there are limitations in expressing the perspective of the service provider side.
5.4.4 Pros and cons of ordinary experience mapping methods
Based on Sections 5.4.1, 5.4.2, 5.4.3, we discuss the pros and cons of ordinary experience mapping methods. The persona–scenario method features the following advantages: 1) it leaves little room for interpreting the results, and 2) it allows data expansion through simulation. However, it features the disadvantages of providing only static information for a certain cross-section and not being able to express both customers’ thoughts and feelings and service providers’ perspectives. The customer journey map expresses the thoughts and feelings of customers and handles customer experience holistically. However, like the persona–scenario method, the customer journey map features the disadvantages of providing only static information for a certain cross-section and not expressing the service provider perspective. An SEBM provides dynamic information by comparing before and after scripts from the viewpoint of the type of solution could solve each customer’s boundary. In other words, it is able to depict changes in the customer experience in a single map. However, it has the disadvantages of being unable to express the thoughts and feelings of customers and limiting the perspective of the service provider.
Ordinary experience mapping methods have both advantages and disadvantages (Table 2). We emphasize the main advantage of an SEBM—namely, that changes in user experience can be depicted in a single map—and propose an extended formal descriptive model based on the SEBM model. The extended SEBM model represents an experience that integrates both the customer and provider perspectives, as described in Section 3.2.
5.5 Knowledge extraction using the proposed experience mapping method: The extended SEBM method
In this section provides a formal description of the simulation results using the extended SEBM framework. Figures 9, 10, 11 describes the contents of Table 1 and Figures 4, 5.
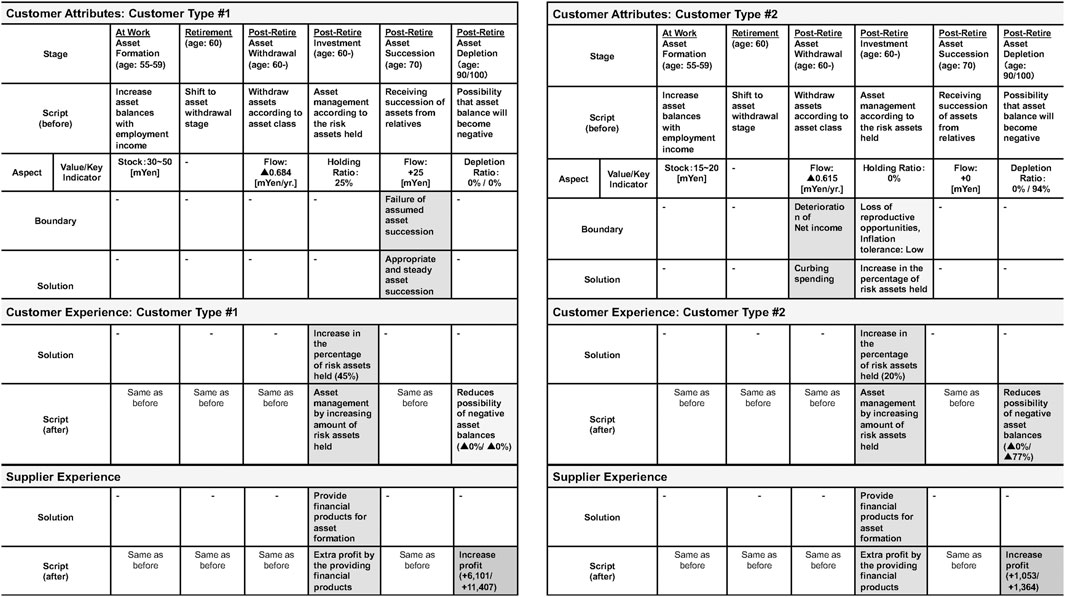
FIGURE 9. Simulation results described with extended SEBM (Customer type: #1, Right: Customer type: #2).
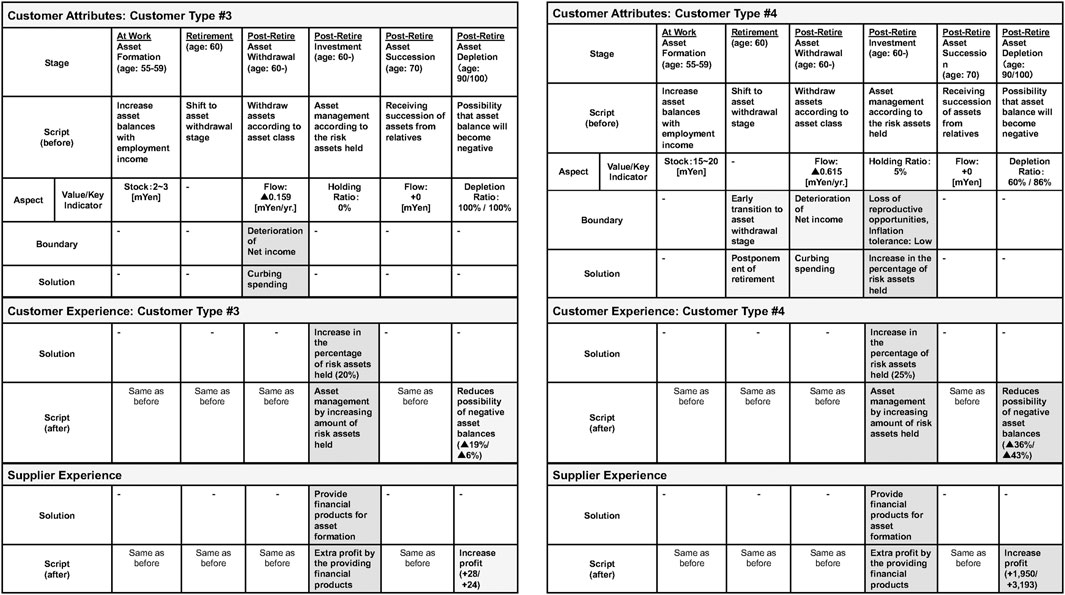
FIGURE 10. Simulation results described with extended SEBM (Customer type: #3, Right: Customer type: #4).
Figure 10 (Right) maps the simulation results for Customer Type #4, which demonstrates a low percentage of risky assets (5%) (Table 1) and a low tolerance for inflation. Customer Type #4, as a “Solution,” should take appropriate risks to hedge inflation (Table 1). If the customer takes measures that are consistent with the “Solution” (risky assets +20%), the depletion rate at ages 90 and 100 will be reduced by 36% and 43%, respectively (Figure 4). At this time, the additional profit to the service provider is + 1,960 and + 3,193, respectively, thereby ensuring an increase in revenue (Figure 5). Figure 10 depicts a map of these results. In this case, the depletion rate is significantly improved for the customer, and the service provider increases its revenue correspondingly. Therefore, it is reasonable for the service provider to target Customer Type #4 as a marketing strategy.
Similarly, Figure 9 (Left) maps the simulation results for Customer Type #1. Here the “Solution” should be to provide appropriate asset succession; however, inconsistent measures are taken to improve the proportion of risky assets. Thus, the service provider’s revenue increases, but the customer depletion rate does not increase. Targeting Customer Type #1 is a measure that only improves the service provider’s experience.
Figure 10 (Left) maps the simulation results for Customer Type #3. Here, the “Solution” should reduce spending, but inconsistent measures are taken to increase the share of risky assets. Although the customer depletion rate increases slightly, the increase in the service provider’s revenue is limited. Targeting Customer Type #3 provides limited improvement in the experience of the customer and the service provider.
Figure 9 (Right) maps the simulation results for Customer Type #2. Here, as in Customer Type #4, the “Solution” and measures are consistent, and the customer depletion rate increases significantly, especially at age 100. In addition, the revenue of the service provider increases significantly. Targeting Customer Type #2 is a measure that improves the experience of both the customer and the service provider.
Figure 11 maps the simulation results for Customer Type #5. Here, the “Solution” should reduce the amount of risk required to decrease the price volatility of risky assets; however, the exact opposite measure is taken by increasing the proportion of risky assets. Although the service provider’s revenue increases, the client depletion rate decreases slightly, especially at age 100. Targeting Customer Type #5 is a measure that worsens the customer’s experience and should be avoided.
The extended version of the SEBM method integrates both the customer and provider experiences. From the viewpoint of a product/service provider, the SEBM framework facilitates decision-making regarding targeting customers by comparing and evaluating KPIs on the customer and provider side.
The extent of achievement of the requirements described in Section 1 is as follows. The extended SEBM model is able to 1) express the customer’s perspective, 2) depict simulation results concisely in a single map, 3) include information in the map that guides the next actions in the form of “solutions” and “boundaries,” and 4) express the perspective of the service provider.
6 Conclusion
This study compares frameworks for log analysis and formal description of social simulations that contribute to product and service design and discusses their merits, shortcomings, and limitations. We propose an experience mapping method by extending an ordinary method that is also describes the service provider’s experience. We illustrate this method by using it to simulate pre- and post-retirement asset sustainability. The proposed method is capable of 1) describing the integrated experience of both the customers and providers of a “benefit-delay service” design and 2) enabling customer targeting based on this description.
The main contributions of this paper are as follows: 1) The proposed method yields a description that may lead directly to the design of benefit-delayed services and products. 2) The proposed experience mapping methodology is capable of extracting knowledge that directly supports marketing measures and management decision-making.
We plan to expand the scope of SEBM-related case studies and demonstrations in a future work.
Data availability statement
The original contributions presented in the study are included in the article/Supplementary Material, further inquiries can be directed to the corresponding author.
Author contributions
All authors listed have made a substantial, direct, and intellectual contribution to the work and approved it for publication.
Conflict of interest
TK is employed by Mitsubishi UFJ Trust and Banking Corporation.
The remaining author declares that the research was conducted in the absence of any commercial or financial relationships that could be construed as a potential conflict of interest.
Publisher’s note
All claims expressed in this article are solely those of the authors and do not necessarily represent those of their affiliated organizations, or those of the publisher, the editors and the reviewers. Any product that may be evaluated in this article, or claim that may be made by its manufacturer, is not guaranteed or endorsed by the publisher.
References
1. Yamada H, Ohori K, Iwao T, Kira A, Kamiyama N, Yoshida H, et al. “Modeling and managing airport passenger flow under uncertainty: A case of fukuoka airport in Japan,” 9th International Conference on Social Informatics (SocInfo), LNCS, Oxford, UK, September 13–15, 2017, 419–30. (2017).
2. Ohori K. Systems science approaches toward social implementation of AI. J Jpn Soc Artif Intelligence (2020) 35(4):542–8. doi:10.11517/jjsai.35.4_542
3. Kikuchi T, Takahashi H. Policy simulation for retirement planning based on clusters generated from questionnaire data. In: Agents and multi-agent systems: Technologies and applications 2022. Singapore: Springer (2021).
4. Kikuchi T, Takahashi H. Life planning support System for older generations using social simulation log analysis. Trans Soc Instrument Control Eng (2021) 57(12):552–62. doi:10.9746/sicetr.57.552
5. Fujimura K. Research on patient satisfaction with medical care services in consideration of ‘benefit delay’ effect. Serviceology (2015) 2(2):24–31. doi:10.24464/serviceology.2.2_24
6. Kelley T, Litterman J. The art of innovation: Lessons in creativity from IDEO, America’s leading design firm. New York, United States: Doubleday (2001).
7. Moggridge B. Designing Interactions 1/e. Cambridge, Massachusetts, United States: The MIT Press (2006).
9. Pruitt J, Adlin T. The persona lifecycles: Keeping people in mind throughout product design. Burlington, Massachusetts, United States: Morgan Kaufmann (2006).
10. Kalbach J. Mapping experiences: A complete guide to creating value through journeys, blueprints, and diagrams. 1st ed. Sebastopol, California, United States: O’Reilly Media (2016).
11. Kunigami M, Kikuchi T, Takahashi H, Terano T. A customer experience mapping model for business case description of innovation and value Co-creation. In: Agents and multi-agent systems: Technologies and applications, Singapore: Springer (2021). p. 255–64.
12. Kikuchi T, Takahashi H. A persona design method based on data augmentation by social simulation. In: The IEEE/ACIS 21st International Fall Conference on Computer and Information Science (ICIS 2021-Fall), Xi’an, China, October 13–15, 2021(2021). p. 136–43.
13. Kikuchi T, Takahashi H. Survey on social simulation and knowledge extraction from simulation results—application for constructing life planning support frameworks. Int J Adv Softw (2022) 15(1&2):54–64.
14. Kikuchi T, Takahashi H, Kunigami M, Terano T. A customer experience mapping for knowledge extraction from social simulation results. Agents Multi-Agent Syst Tech Appl (2022) 306:159–68. doi:10.1007/978-981-19-3359-2_14
15. Risdon C. The anatomy of an experience map, adaptive path’s web site (2011). https://articles.uie.com/experience_map/.
16.N Gilbert, and J Doran, editors. Simulating societies: The computer simulation of social phenomena, London, United Kingdom: University College of London Press (1994).
18. Takahashi H, Terano T. Agent-based approach to investors’ behavior and asset price fluctuations in financial markets. J Artif Societies Soc Simulation (2003) 6: 6–3.
19. Takahashi H. An Analysis of the Influence of dispersion of valuations on Financial Markets through agent-based modeling. Int J Info Tech Dec Mak (2012) 11(1):143–66. doi:10.1142/s0219622012500071
20. Takahashi H. Analyzing the influence of value at risk on financial markets through agent-based modeling. Int J Knowledge-Based Intell Eng Syst (2013) 17(4):257–66. doi:10.3233/kes-130276
21. Kikuchi T, Kunigami M, Yamada T, Takahashi H, Terano T. Analysis of the influences of central bank financing on operative collapses of financial institutions using agent-based simulation. In: IEEE The 40th Annual International Computers, Software & Applications Conference, the 3rd International workshop on Social Services through Human and Artificial Agent Models; 10-14 June 2016; Altanta, GA, USA (2016).
22. Kikuchi T, Kunigami M, Yamada T, Takahashi H, Terano T. Agent-based simulation of financial institution investment strategy under easing monetary policy for operative collapses. J Adv Comput Intelligence Intell Inform (2018) 22(7):1026–36. doi:10.20965/jaciii.2018.p1026
23. Farmer JD, Foley D. The economy needs agent-based modelling. Nature (2009) 460(7256):685–6. doi:10.1038/460685a
24. Ju SL, Tatiana F, Arika L, Behrooz H, Forrest S, Iris L, et al. The complexities of agent-based modeling output analysis. J Artif Societies Soc Simulation (2015) 18: 18–4.
25. Matsushima H, Uchitane T, Tsuji J, Yamashita T, Ito N, Noda I. Applying design of experiment based significant parameter search and reducing number of experiment to analysis of evacuation simulation. Trans Jpn Soc Artif Intelligence (2016) 31(6):AG-E_1/9. doi:10.1527/tjsai.ag-e
26. Tanaka Y, Kunigami M, Terano T. What can be learned from the systematic analysis of the log cluster of agent simulation. Stud Simulation Gaming (2018) 27(1):31–41. doi:10.32165/jasag.27.1_31
27. Goto Y. Hierarchical classification and visualization method of social simulation logs reflecting multiple analytical interests. Trans Soc Instrument Control Eng (2020) 56(10):463–74. doi:10.9746/sicetr.56.463
28. Kunigami M, Kikuchi T, Terano T. A formal model for the business innovation case description. J Syst Cybern Inf (2022) 20(1):296–318. doi:10.54808/jsci.20.01.296
29. Kikuchi T, Kunigami M, Takahashi H, Toriyama M, Terano T. Explaining log data of agent-simulation results with managerial decision-making description model. Stud Simulation Gaming (2019) 29(1):36–48. doi:10.32165/jasag.29.1_36
30. Kikuchi T, Kunigami M, Takahashi H, Toriyama M, Terano T. Description of decision-making process in actual business cases and virtual cases from organizational agent model using managerial decision-making description model. Trans Inf Process Soc Jpn (2019) 60(10):1704–18.
31. Cooper A. The inmates are running the asylum: Why high tech products drive us crazy and how to restore the sanity. London, United Kingdom: Macmillan (1999).
32. Ingersoll JE. Theory of financial decision making. Lanham, Maryland, United States: Row-Man & Littlefield Publishers (1987).
34.“Awareness survey on life in old age for before and after retirement generation,” Tokyo, Japan: MUFG Financial Education Institute (2019).
35.Statistics Bureau of Japan. National survey of family income and expenditure (2014). https://www.stat.go.jp/english/.
Keywords: social simulation, simulation analysis, experience mapping methods, service design, life planning
Citation: Kikuchi T and Takahashi H (2022) Service design based on social simulation: An integrated experience mapping methodology considering customers and service providers. Front. Phys. 10:1016655. doi: 10.3389/fphy.2022.1016655
Received: 11 August 2022; Accepted: 12 October 2022;
Published: 01 November 2022.
Edited by:
Hui-Jia Li, Beijing University of Posts and Telecommunications (BUPT), ChinaReviewed by:
Yuhao Feng, Beijing University of Posts and Telecommunications (BUPT), ChinaJinlong Ma, Hebei University of Science and Technology, China
Copyright © 2022 Kikuchi and Takahashi. This is an open-access article distributed under the terms of the Creative Commons Attribution License (CC BY). The use, distribution or reproduction in other forums is permitted, provided the original author(s) and the copyright owner(s) are credited and that the original publication in this journal is cited, in accordance with accepted academic practice. No use, distribution or reproduction is permitted which does not comply with these terms.
*Correspondence: Takamasa Kikuchi, dGFrYW1hc2Ffa2lrdWNoaUBrZWlvLmpw
 Takamasa Kikuchi
 Hiroshi Takahashi